Elliott Wave chart analysis for the SPX500 for 2nd December, 2010. Please click on the charts below to enlarge.
As expected from yesterday’s analysis the S&P has moved higher and is now within the target zone.
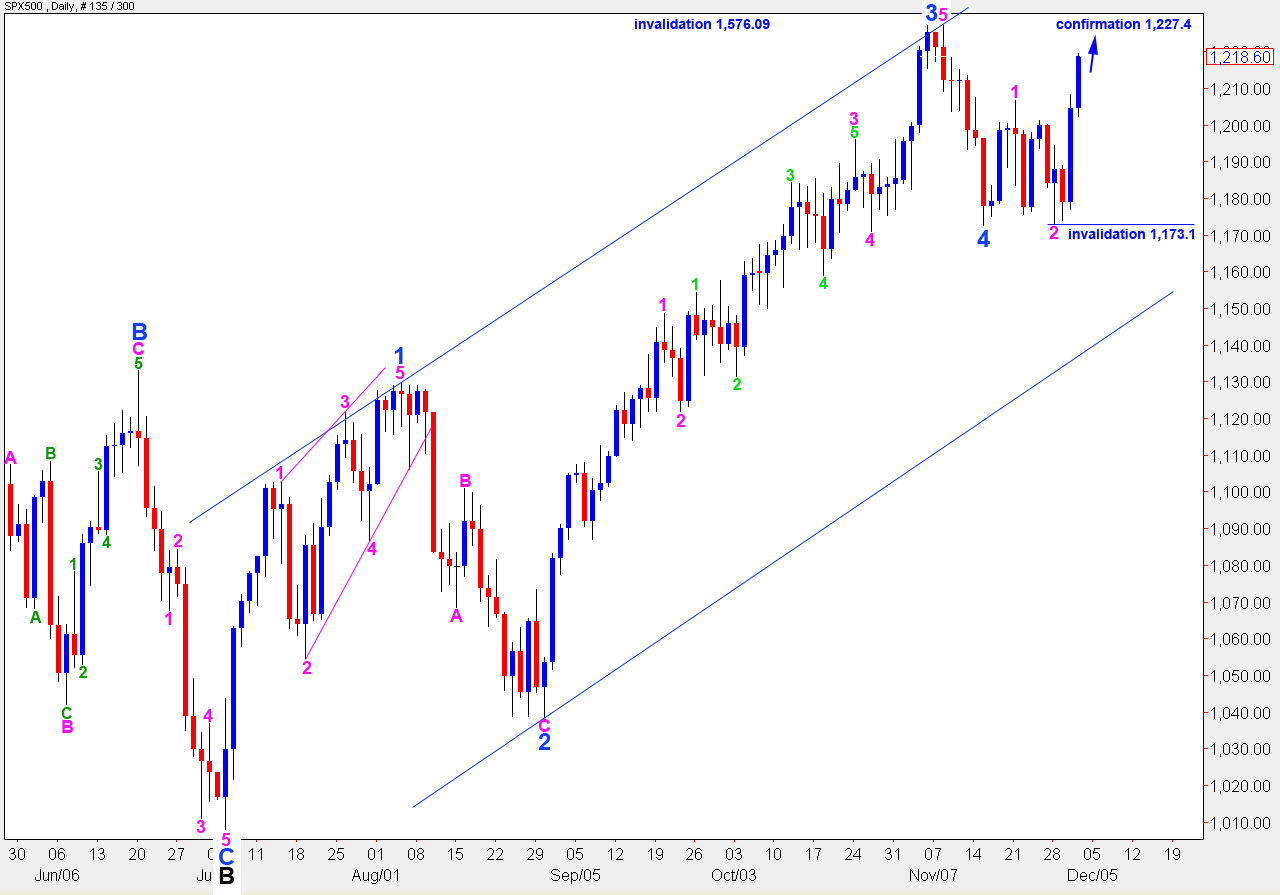
I have charted another alternate possibility for you: that wave 4 blue was remarkably brief and shallow and upward movement is wave 5 blue to end wave C black. We may use confirmation and invalidation points to work with this today. I consider this a slim possibility as I would expect a fourth wave at minor degree to show subdivisions within it on the daily chart.
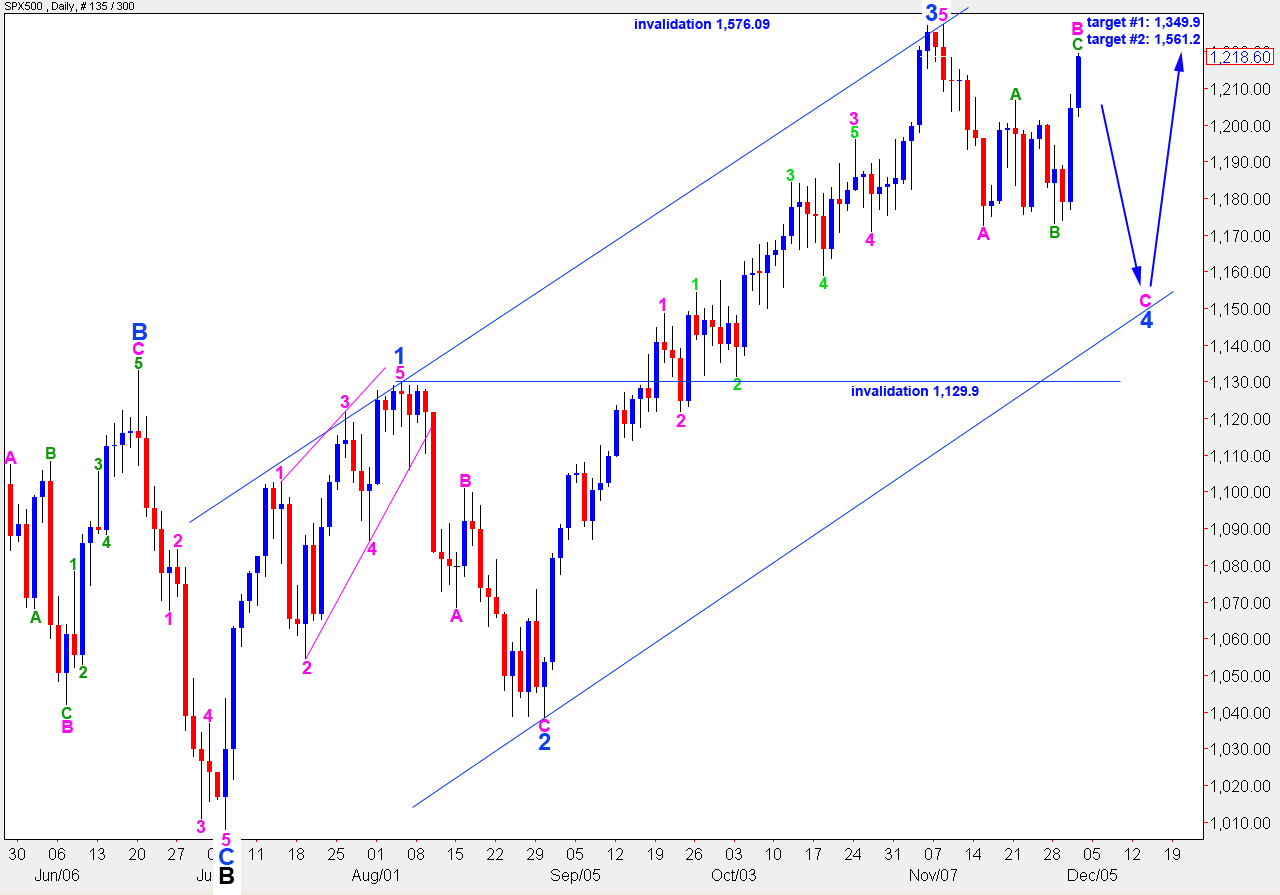
This main wave count expects downward movement in a C wave at pink (minute) degree to begin very soon. When we have an end to pink wave B confirmed then I can calculate a downward target for wave 4 blue to end. At this stage we may expect wave C pink to reach equality with wave A pink which is 54.8 points.
Upward targets remain the same. I favour the higher target at 1,561.2 where wave C black will reach equality with wave A black as that is the most common relationship between the two within a zigzag.
Upward movement may not make a new high above 1,576.09.
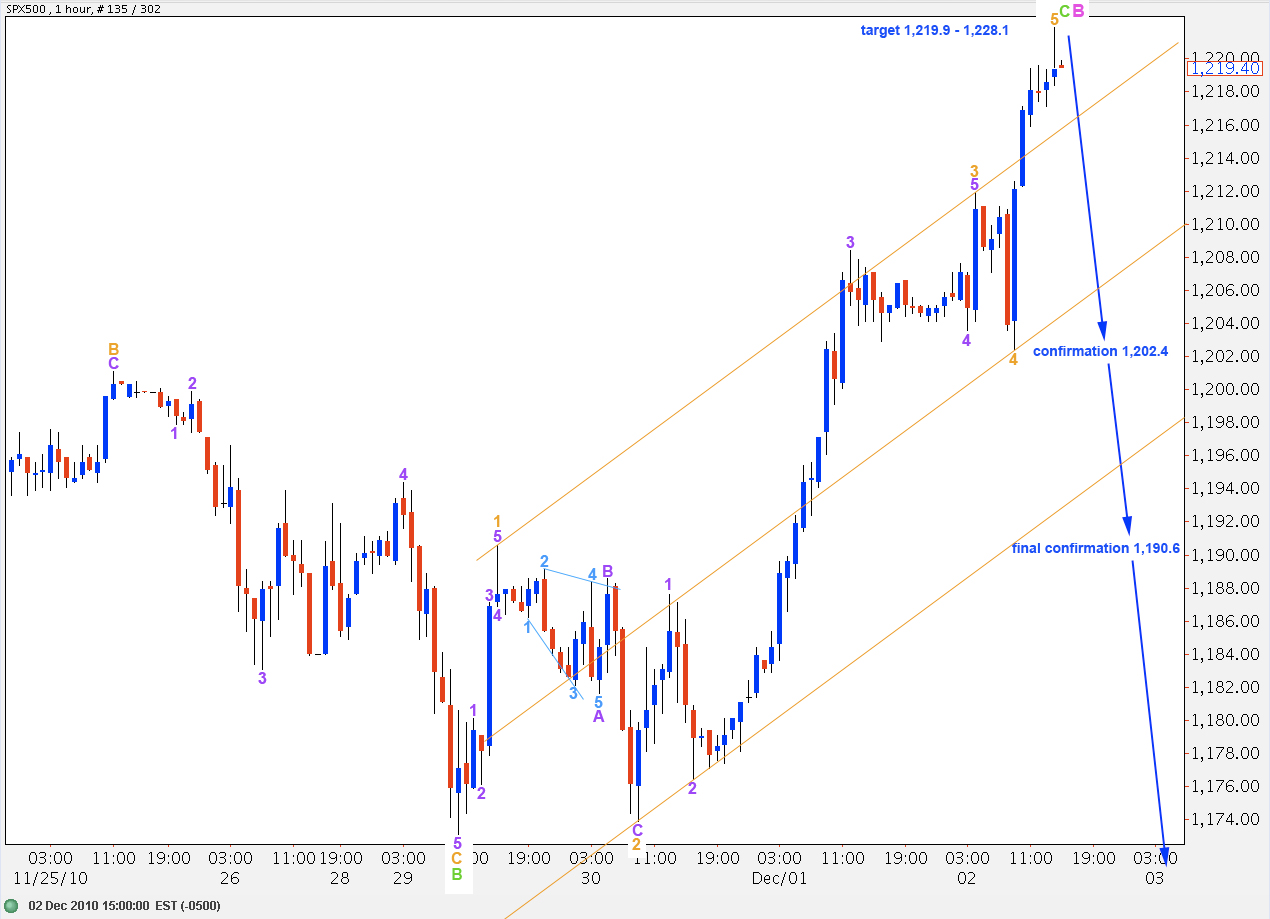
Our upward target was 1,220.4 to 1,228.1. Price has reached into the target zone as expected.
I have adjusted the labeling of wave C green upward. This labeling has better fibonacci ratios. It has an impulsive count of 9 so it should be over already or ending very soon.
Ratios within wave 3 orange are: wave 3 purple is 3.9 points short of 2.618 the length of wave 1 purple and wave 5 purple is just 0.2 points short of 0.618 the length of wave 1 purple.
Wave 3 orange has no fibonacci ratio to wave 1 orange.
Because any second wave correction within wave 5 orange may not move beyond the start of the first, we will have initial confirmation of this wave count with price movement below 1,202.4.
If the high labeled wave 5 orange was only the end to wave 3 orange then we should not see price move into wave 1 orange territory below 1,190.6. Therefore, this is our final confirmation point for the trend change to down.
I have created a double wide parallel channel around wave C green. First a trend line from the highs of 1 to 3 orange, then parallel copies on the lows of 4 and 2 orange. When this channel is breached to the downside we will have confirmation of a trend change back to down.
The upside invalidation point must lie at 1,227.4 so there is a reasonable risk to short positions opened here.
Alternate Wave Count.
This wave count expects wave 4 blue was over at 1,172.6. This wave count does not have a good look on the daily chart. I would expect wave 4 blue be longer than 6 days in duration, as wave 2 blue was 19 days in duration. I would also expect wave 4 blue to show subdivisions within it on the daily chart and these are not clear.
However, it is an outlying possibility we must consider. It may be considered confirmed with price movement above 1,227.4. At that stage we may expect price to continue higher towards targets given on the main wave count daily chart.
Price movement below 1,173.1 will invalidate this wave count as any second wave correction within wave 3 pink may not move beyond the start of the first.
However, price movement below 1,190.6 will see this wave count as even less likely. We may use the main hourly wave count at that stage.
Alternate Daily Wave Count.
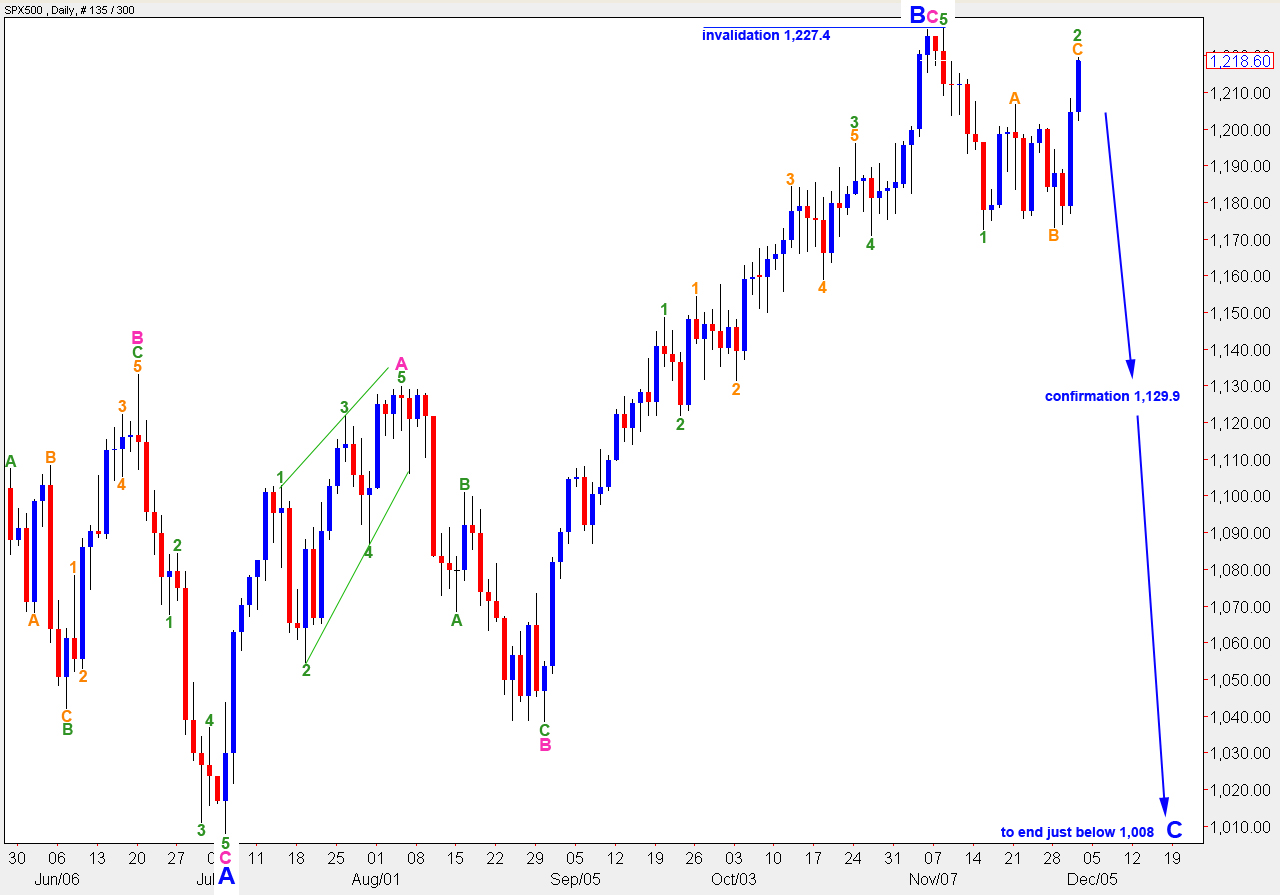
Analysis for this alternate count remains the same. This alternate wave count expects wave B black is still unfolding as a regular flat correction.
Wave B blue was 103% the length of wave A blue. Therefore, this structure is a regular flat correction and wave C blue is most likely to end just beyond the end of wave A blue, just below 1,008.
If the main wave count is invalidated with movement below 1,129.9 this alternate wave count will be correct. At that stage we may expect there is a very high probability of downward movement continuing and ending only below 1,008.
Wave 2 green may not move beyond the end of wave 1 green. Therefore, this wave count is invalidated with movement above 1,227.4.


Lara,
I have stumbled onto an interesting insight. I have been simultaneously watching the Russell 2000 index ($RUT on http://www.StockCharts.com). It tends to follow the same wave count as the SnP, but, much smoother and way more predictable!
I will test it as a predictor, but, if you look, you will see it with a much easier wave count to read.
I stumbled on this idea when I saw an article showing the Value Line index, which is arithmatecally weighted, ie, it ignores market cap. And, low and behold, had such a clearly defined wave count!
I will pursue this idea further, but, it may be a count counter check in one’s analysis to the major indexes.
I could see from the Russell that a new high was put in. It makes me wonder if then the SnP will put in a new high above 1227.4, and thus support that 4 Blue was put in. You mentioned this in the video as a slim possibility. If I were a betting man (and I am), I’d say that 4 Blue is in.
Just some ideas.
Wishing you all the BEST!!
John A
Thanks John, when I have an internet connection at home (hopefully tomorrow!) and I’m not working in my local internet cafe (thanks Telecom – not!) then I’ll have a good look at this.
Unfortunately upon closer inspection we may have movement above 1,227.4 for the main wave count, this is not the correct confirmation point for 4 blue being over. That confirmation point should be at 1,282.2 which is really of no use to anyone, but that’s what it is.
I would expect if we move above 1,227.4 that wave 4 blue is an expanded flat correction and we should then see price move up to 1,230.4 or a bit above before turning strongly back down.