
Elliott Wave chart analysis for the SPX500 for 1st December, 2010. Please click on the charts below to enlarge.
Upward movement has invalidated the main hourly wave count and confirmed the alternate. Upward movement has a strong impulsive look; this is characteristic of C waves and is to be expected.
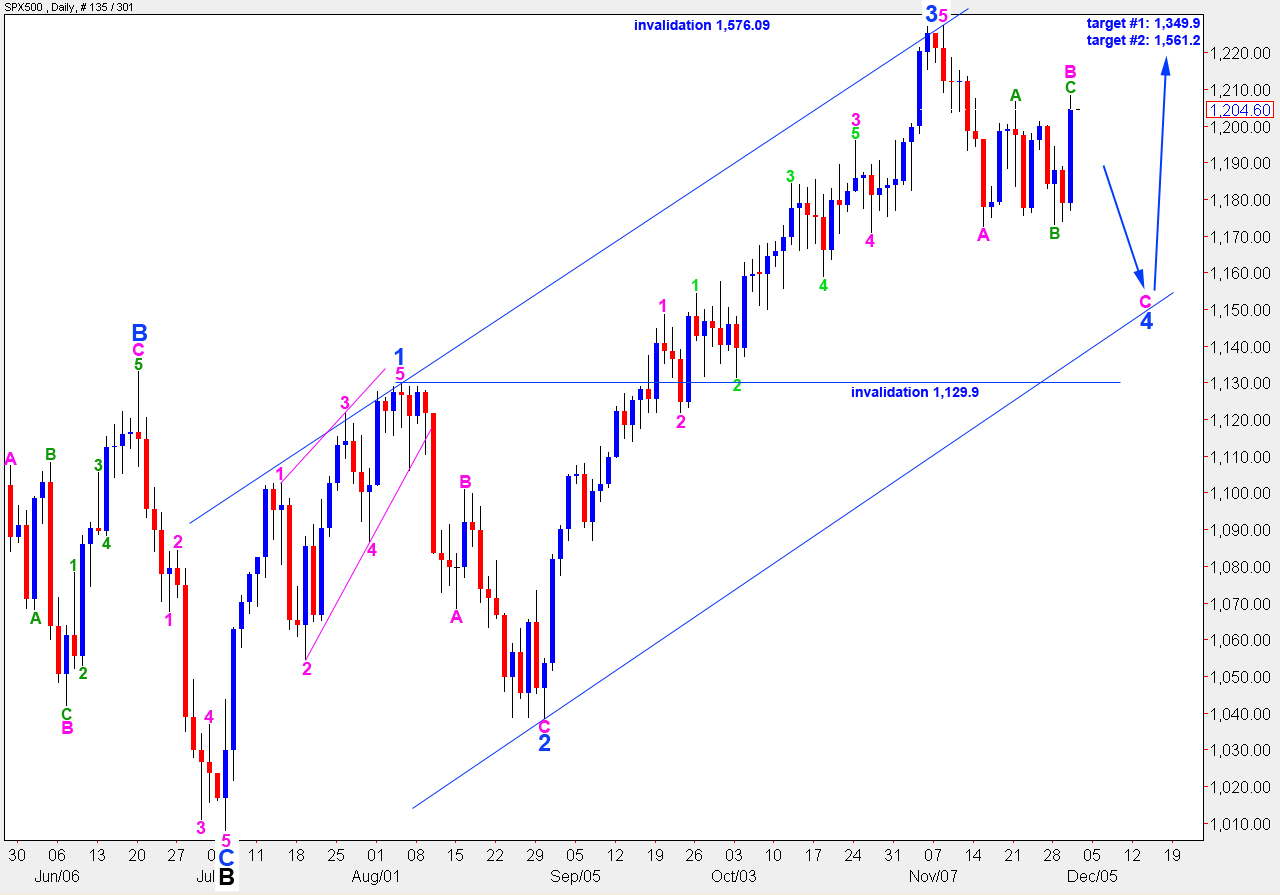
When wave 4 blue is over it should have an unmistakeable three wave or triangle structure on the daily chart. For this reason I do not think blue wave 4 was over at 1,172.6 (the low labeled pink A) and it should continue yet lower.
When wave B pink is over the S&P should resume the downward trend for wave C pink to end wave 4 blue. Wave 4 blue is likely to end about the lower edge of the wide blue parallel channel containing wave C black to the upside.
Targets for the end to wave C black and, therefore, the end to primary wave 2 remain the same. At 1,349.9 wave C black will reach 0.618 the length of wave A black. At 1,561.2 wave C black will reach equality with wave A black. This is the most common relationship between waves A and C of a zigzag. Therefore, the second higher target is more likely.
Wave 2 at primary degree may not move beyond the start of primary wave 1. Therefore, price may not move above 1,576.09.
Wave 4 blue may not move into wave 1 blue price territory. Therefore, this wave count is invalidated with movement below 1,129.9. If this occurs then the alternate daily wave count will explain movement.
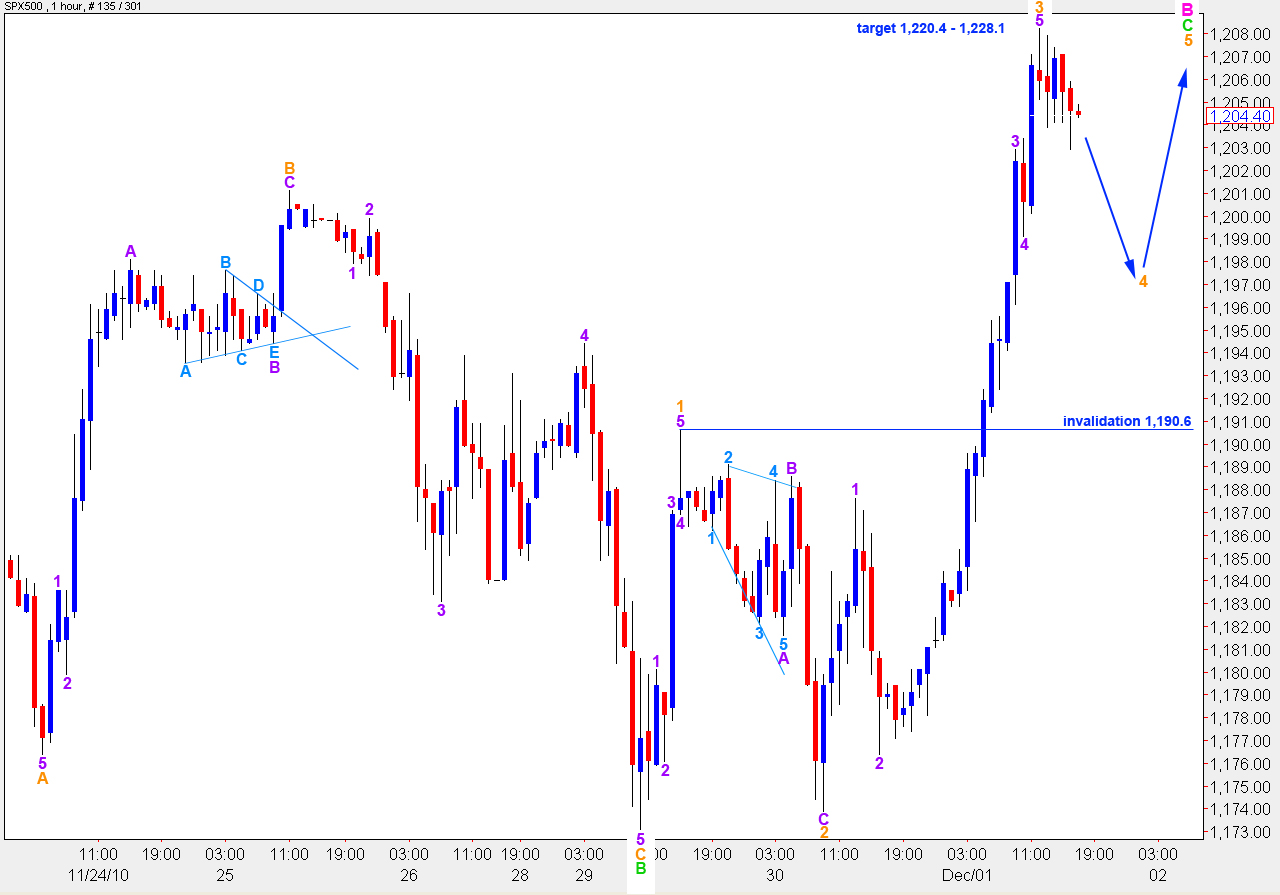
At 1,190.6 this wave count was confirmed and the main hourly wave count was invalidated. This alternate wave count expected further upward movement from that point which is certainly what we have seen.
The target for upward movement to end was at 1,207.1. If wave C green was over already then it would be fairly close to equality with wave A green. However, wave C green is not likely to be over as it does not have a satisfactory impulsive wave count.
Within wave C green wave 3 orange is 6.2 points longer than 1.618 the length of wave 1 orange. If wave 5 orange began at 1,202.9 and reaches equality with wave 1 orange it will end at 1,220.4. This is the upper end of our target zone.
At 1,228.1 wave C green will reach 1.618 the length of wave A green. This is the upper end of the target zone.
Ratios within wave 3 orange are: wave 3 purple is 4.3 points longer than 1.618 the length of wave 1 purple and wave 5 purple is just 0.8 points short of 0.618 the length of wave 1 purple.
If we count wave A pink as a five wave structure (and it is ambiguous, it may be seen as either a three or five) then wave C green, and therefore wave B pink, may not move above 1,227.4. If we count wave A pink as a three wave structure then wave B pink may move above this point.
Therefore, it is difficult for this upward movement to provide an upside invalidation point.
When wave C green has a satisfactory impulsive wave count then we should expect a resumption of downward movement. When price falls below 1,190.6 then we will have confirmation that wave C green and therefore wave B pink is over, and wave C pink to the downside has begun.
Daily Alternate Wave Count.
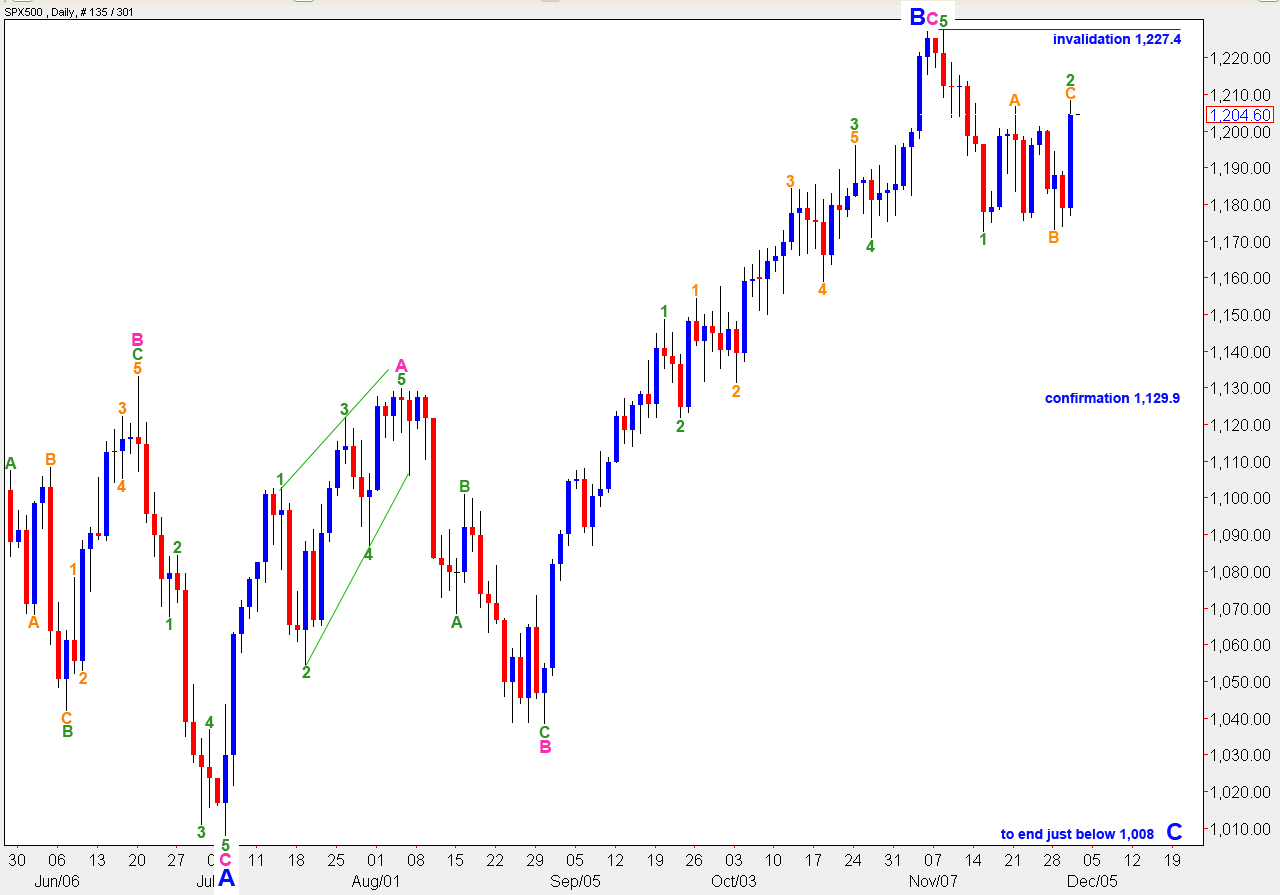
Analysis for this alternate count remains the same. This alternate wave count expects wave B black is still unfolding as a regular flat correction.
Wave B blue was 103% the length of wave A blue. Therefore, this structure is a regular flat correction and wave C blue is most likely to end just beyond the end of wave A blue, just below 1,008.
If the main wave count is invalidated with movement below 1,129.9 this alternate wave count will be correct. At that stage we may expect there is a very high probability of downward movement continuing and ending only below 1,008.
Wave 2 green may not move beyond the end of wave 1 green. Therefore, this wave count is invalidated with movement above 1,227.4.