
Elliott Wave chart analysis for the SPX500 for 24th November, 2010. Please click on the charts below to enlarge.
Upward movement has invalidated two of the hourly alternate wave counts. We are left now with a clearer picture and only two wave counts, both expecting the same direction of movement next.
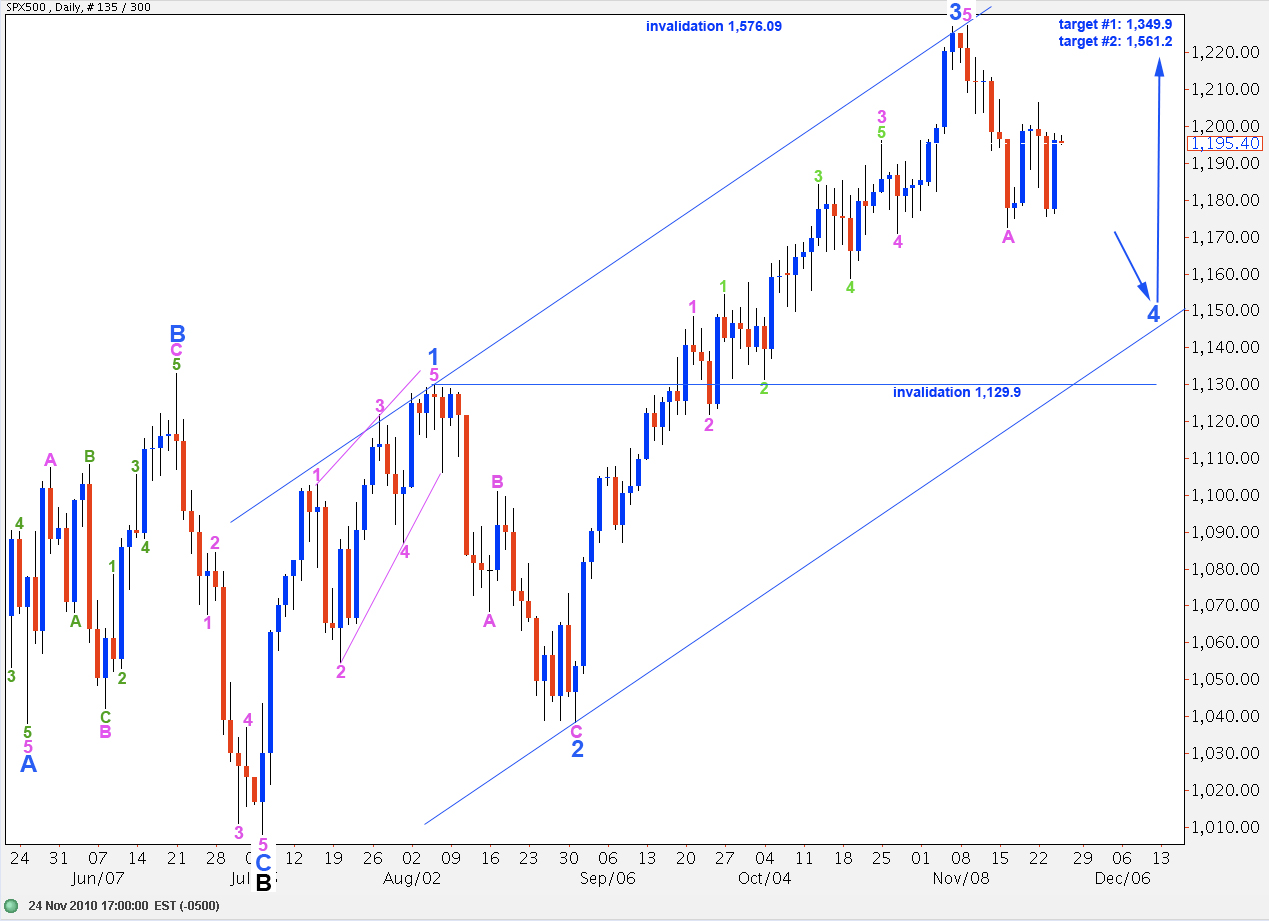
It is likely that wave 4 blue will end about the lower edge of the parallel channel drawn here around wave C black. When it is over the next movement should be upward towards the long term targets for the end to wave C black and, therefore, primary wave 2.
At 1,349.9 wave C black will reach 0.618 the length of wave A black. At 1,561.2 wave C black will reach equality with wave A black. Wave 2 is a simple zigzag and equality with A and C is the most common relationship and, therefore, the more likely of these two targets.
Upward movement may not move above 1,576.09 as wave 2 at primary degree may not move beyond the start of wave 1.
Wave B Pink Zigzag – Main Hourly Wave Count
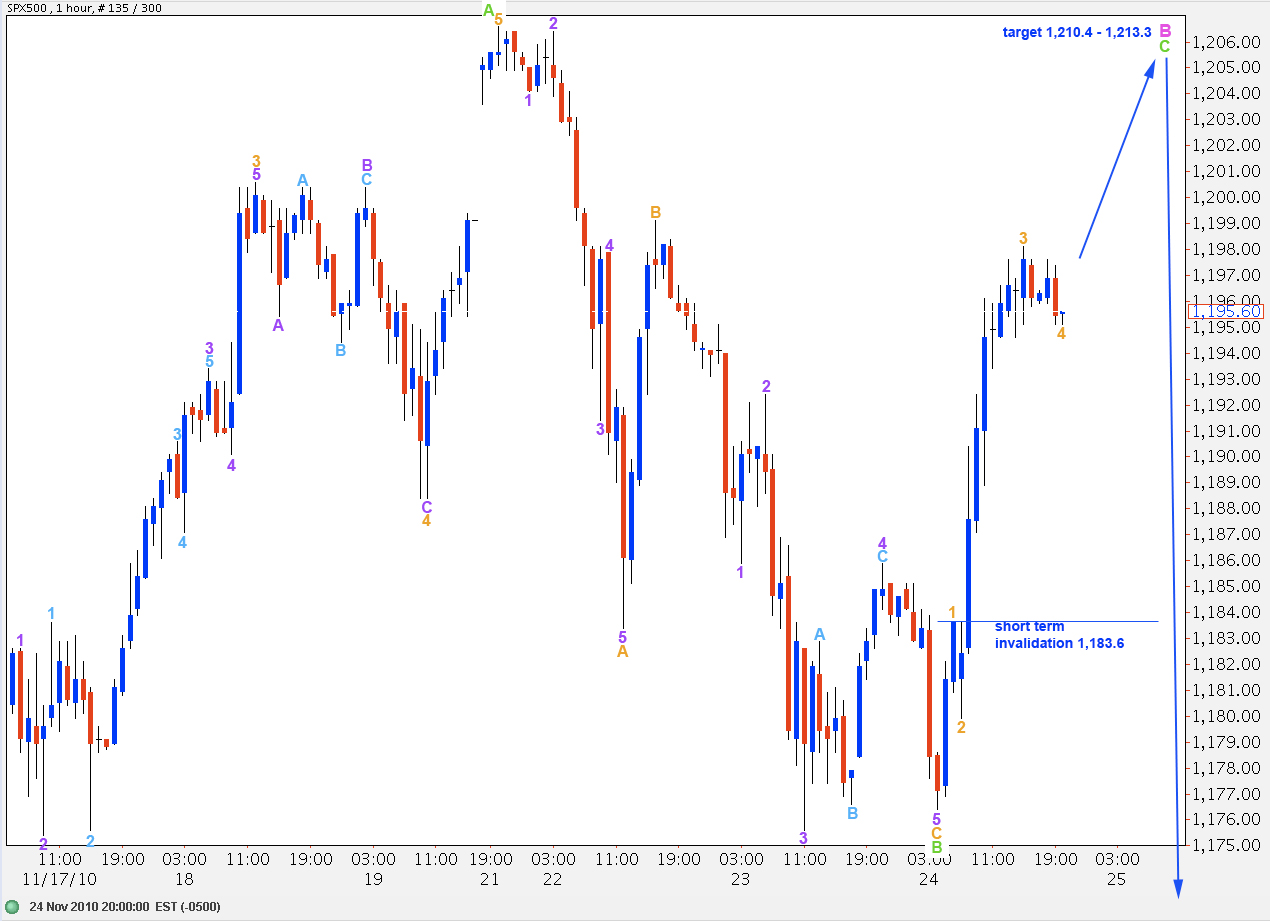
Wave C orange may have ended with a slightly truncated fifth wave.
Within wave C orange ratios are: wave 3 purple has no fibonacci ratio to wave 1 purple and wave 5 purple is 0.9 short of 0.618 the length of wave 3 purple.
Thereafter, the S&P has moved strongly upward in an impulsive movement. This wave count sees this as a C wave to end wave B pink.
Within wave C green wave 3 orange is just 0.6 short of 2.618 the length of wave 1 orange. At 1,213.3 wave 5 orange will reach equality with wave 3 orange.
At 1,210.4 wave C green to end wave B pink will reach equality with wave A green.
Wave 4 Blue Triangle – Alternate Hourly Wave Count.
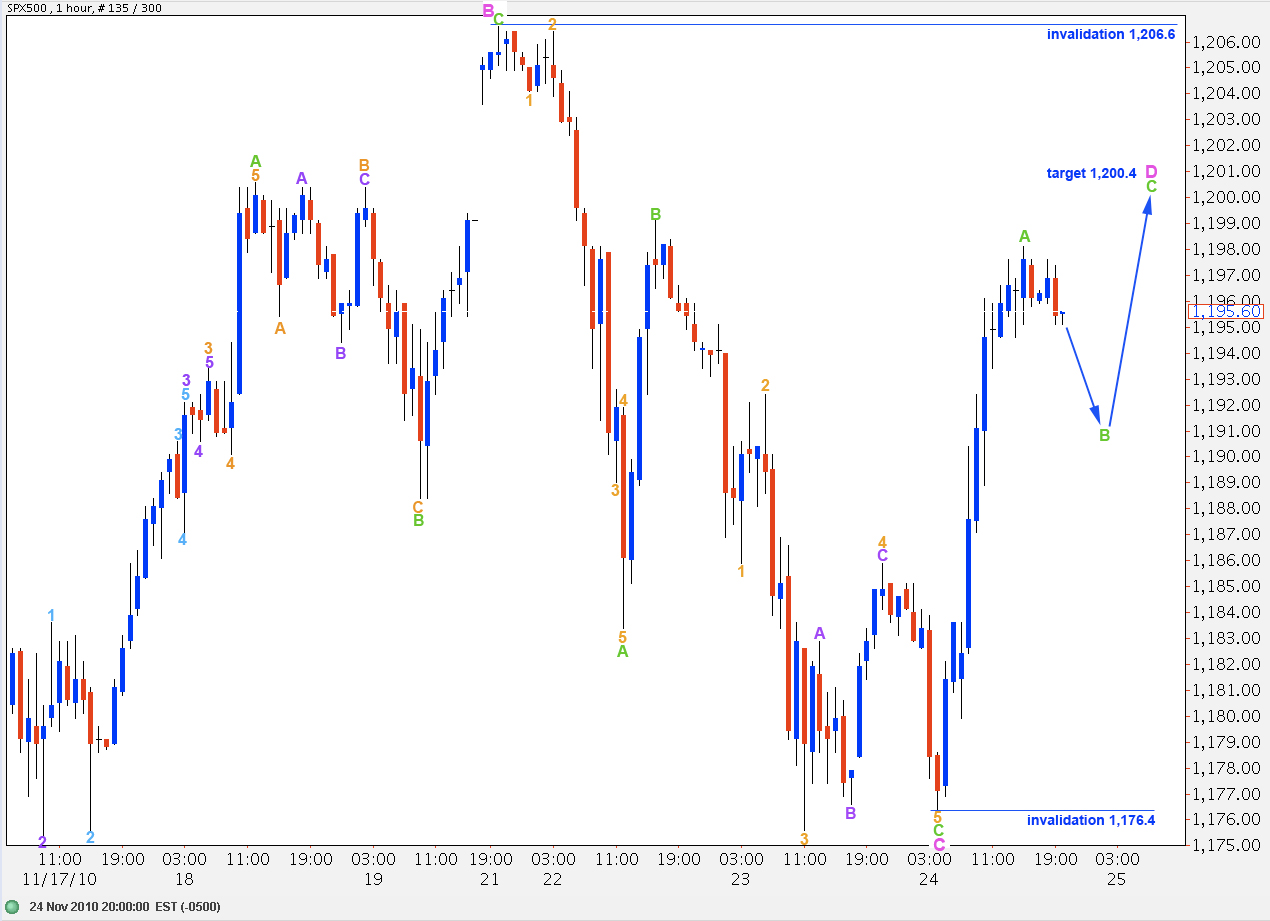
This alternate possibility is still valid while price remains between 1,206.6 above and 1,176.4 below.
Wave D pink should be a zigzag and may not move beyond the end of wave B pink.
Thereafter, a final wave E pink to the downside should end this fourth wave triangle.
On an 8 hourly chart this structure does not have a typical triangle look. It is not supported my MACD; MACD is not hovering about the zero line.
Therefore, this wave count would be the less likely of our two hourly wave counts.
Alternate Daily Wave Count.
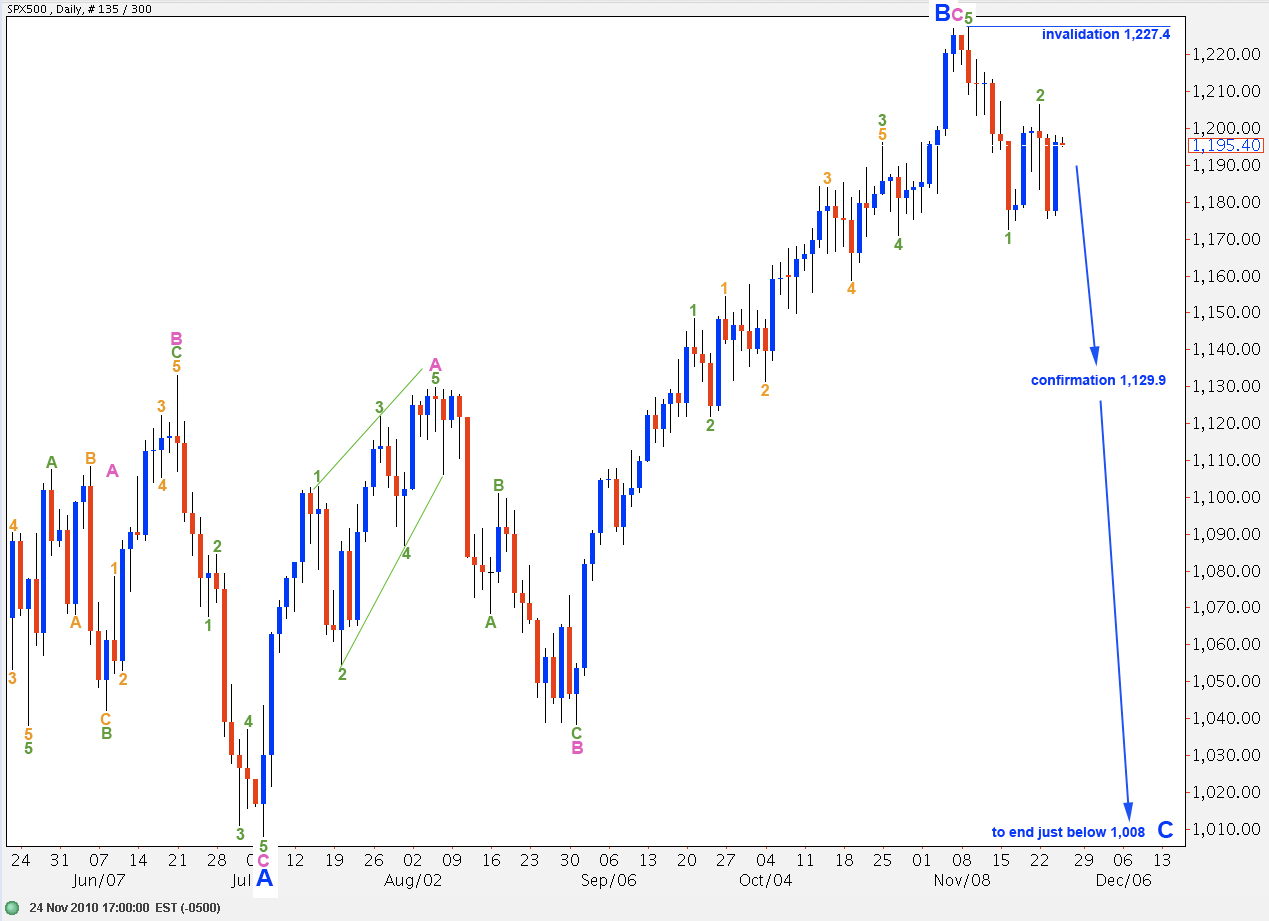
This alternate wave count expects wave B black is still unfolding as a regular flat correction.
Wave B blue was 103% the length of wave A blue. Therefore, this structure is a regular flat correction and wave C blue is most likely to end just beyond the end of wave A blue, below 1,008.
If the main wave count is invalidated with movement below 1,129.9 this alternate wave count will be correct. At that stage we may expect there is a very high probability of downward movement continuing and ending only below 1,008.
Wave 2 green may not move beyond the end of wave 1 green. Therefore, this wave count is invalidated with movement above 1,227.4