
Elliott Wave chart analysis for the SPX500 for 23rd November, 2010. Please click on the charts below to enlarge.
Downward movement has invalidated the hourly wave count. There are several valid possible wave counts at the hourly chart level at this stage.
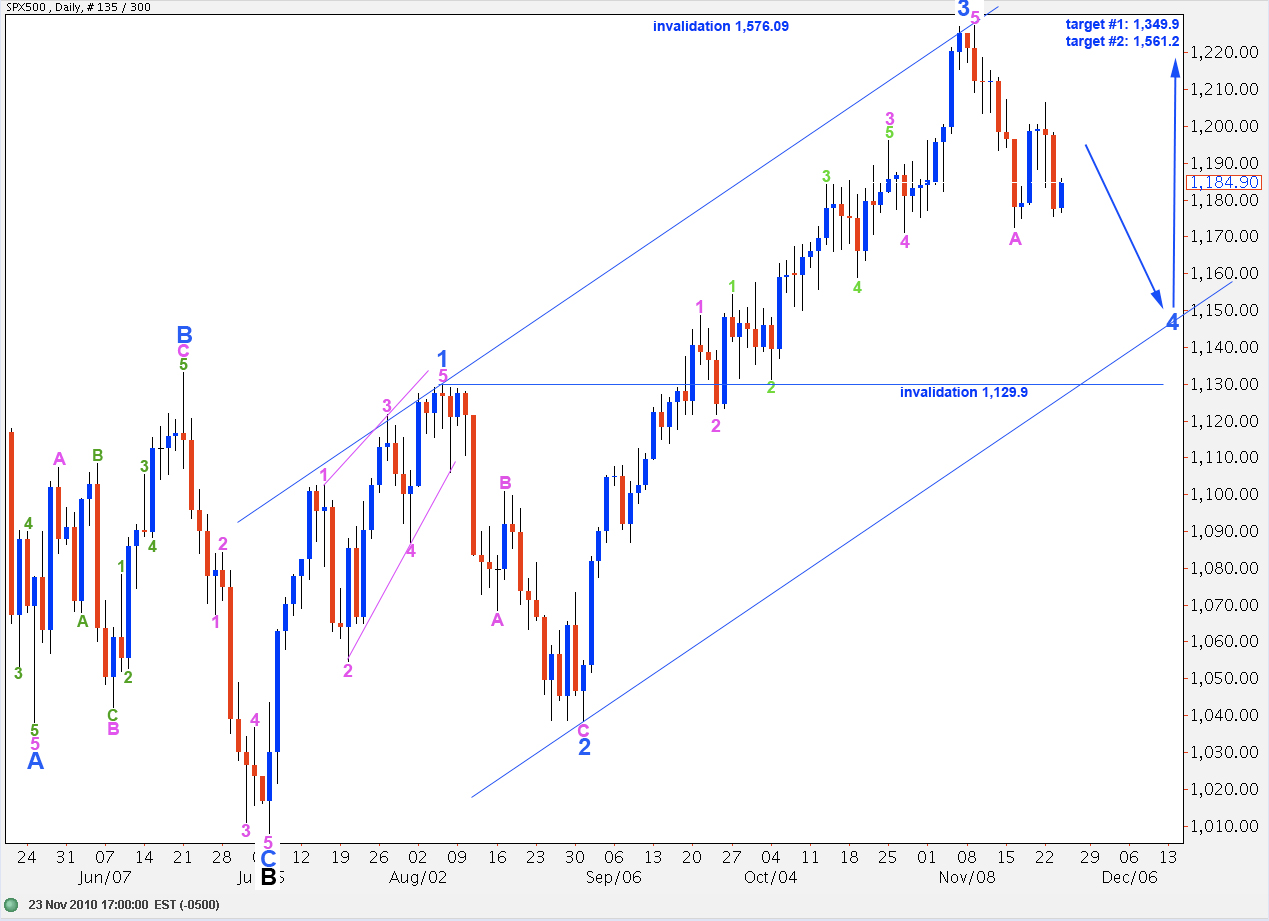
Wave 4 blue may be unfolding as a simple zigzag, a flat, or a triangle.
For all hourly wave counts for this main wave count wave 4 blue may not move into wave 1 blue price territory. Therefore, this wave count is invalidated with movement below 1,129.9. If this wave count is invalidated with movement below this point then we will use the daily alternate wave count and expect that price is highly likely to continue further down.
Wave B Pink Zigzag
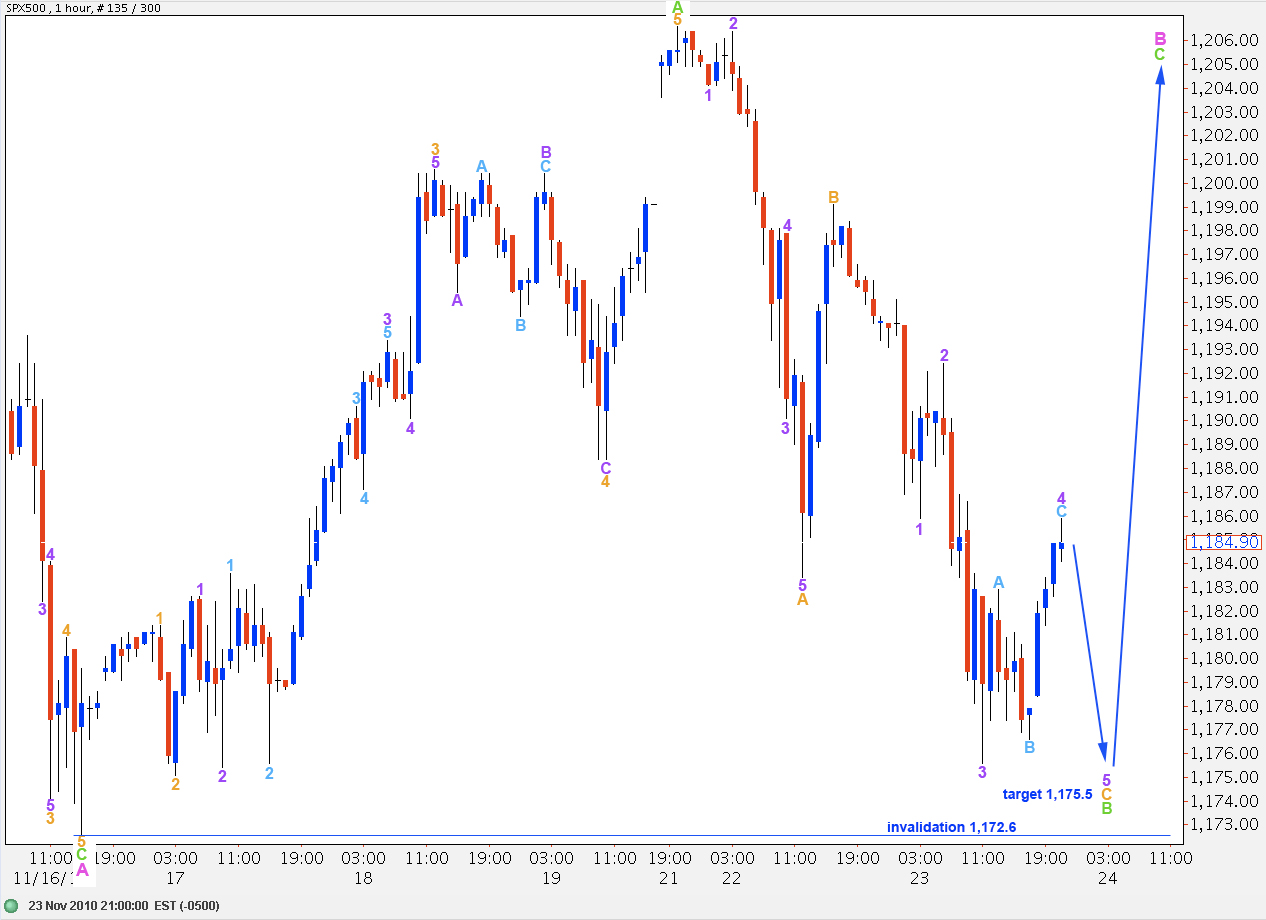
This wave count follows on directly from the one we have been working with. Wave B pink here is continuing and unfolding as a simple zigzag. Wave B green may not move beyond the start of wave A green for a zigzag. Therefore, movement below 1,172.6 will invalidate this wave count.
Ratios within wave A green are: wave 3 orange is 2 points longer than 2.618 the length of wave 1 orange and wave 5 orange is 2.6 points longer than 0.618 the length of wave 3 orange.
At 1,175.5 wave 5 purple will reach 0.618 the length of wave 1 purple. This final small impulse to the downside will end wave B green.
The next move should be an impulse to the upside about 34 points in length to end above 1,206.6 for wave C green to end wave B pink.
Wave B Pink Flat
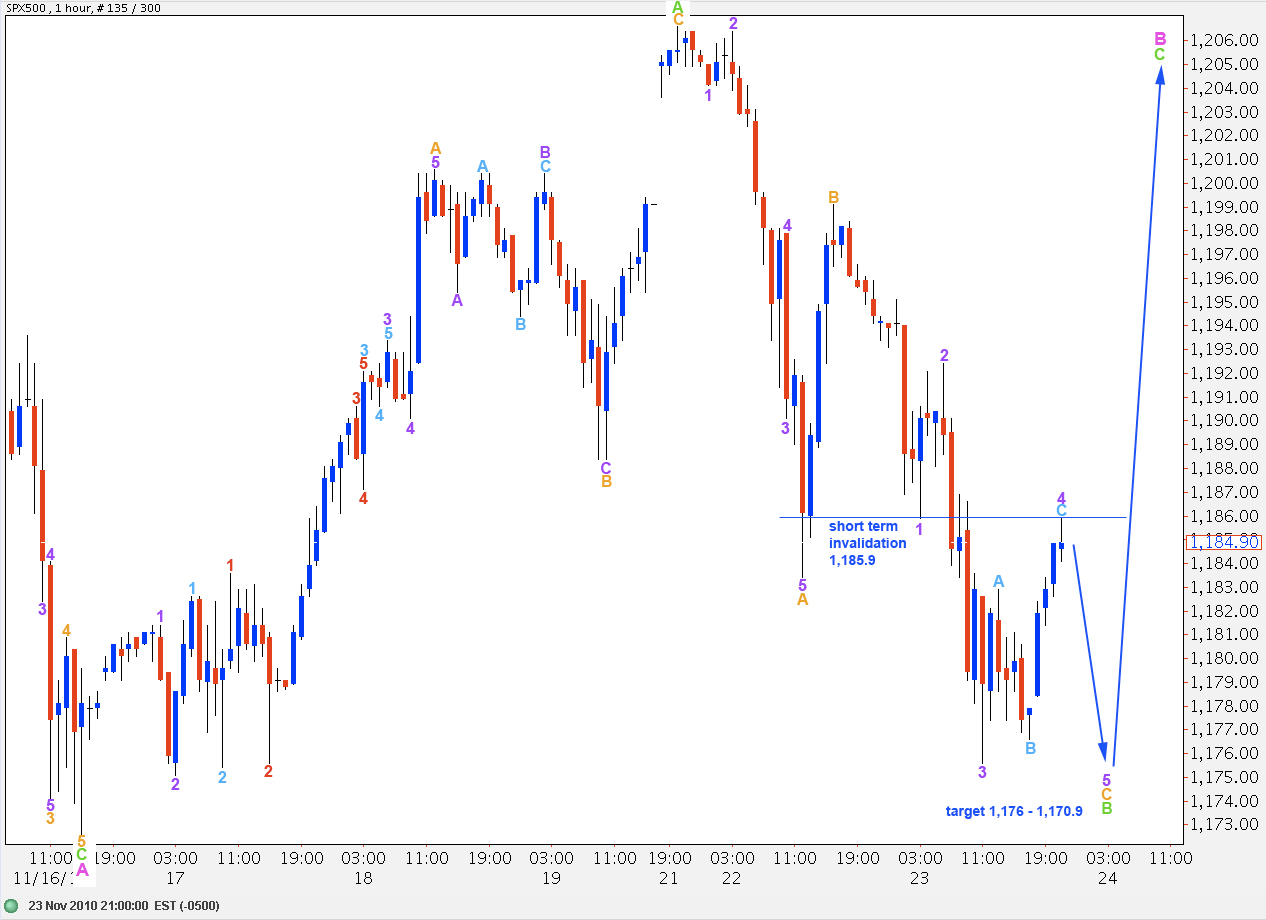
Wave B pink may be unfolding as a flat correction. It is possible to see wave A green as a three wave structure, and it may be a slightly better fit.
Within wave A green wave C orange is just 0.9 points short of 0.618 the length of wave A green.
While wave 5 purple is completing price may not move above 1,185.9 [Edit: correction to this price point made after publication] as wave 4 purple (if it extends higher) may not move into wave 1 purple price territory.
At 1,176.6 wave B green will reach 90% of wave A green; this price point has already been met. Therefore, the minimum required length for wave B green of a flat correction is met. At 1,170.9 wave B green will reach 105% the length of wave A green; this is the minimum required length of wave B in relation to wave A of an expanded flat, which is the most common type of flat correction.
When wave B green is over then we should see strong upward movement in a five wave structure for wave C green. When the end to wave B green is known then a target for wave C green may be calculated.
Wave 4 Blue Zigzag
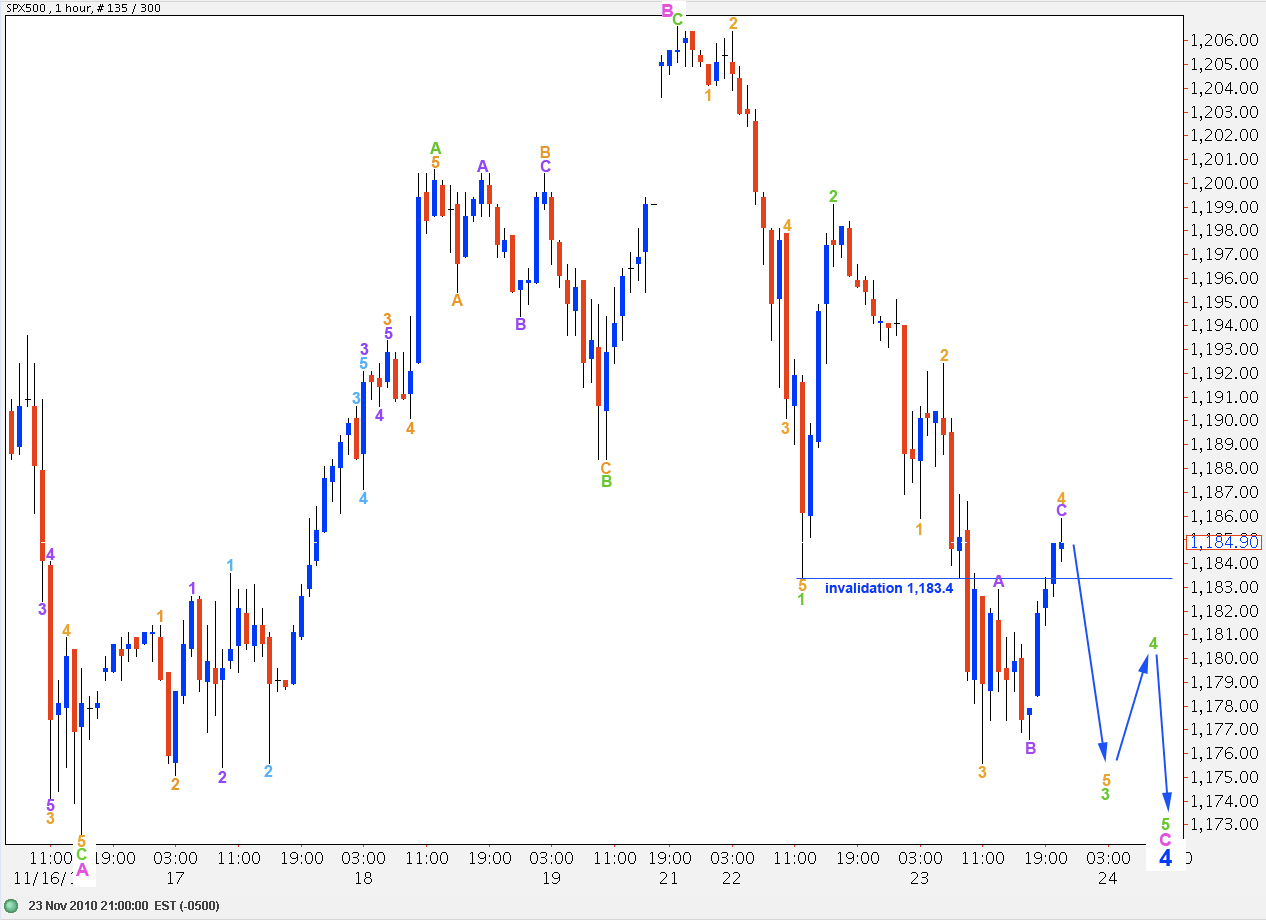
It is possible that wave 4 blue in its entirety is almost over. When wave 3 green is over, if we see price remain below 1,183.4 this possibility will remain. When we have an end to wave 4 green then a target may be calculated for wave 5 green to end wave C pink and, therefore, wave 4 blue.
It is possible that with one more trading day wave 4 blue may last a fibonacci 13 days. It would be brief and shallow, but it is possible.
Wave 4 Blue Triangle
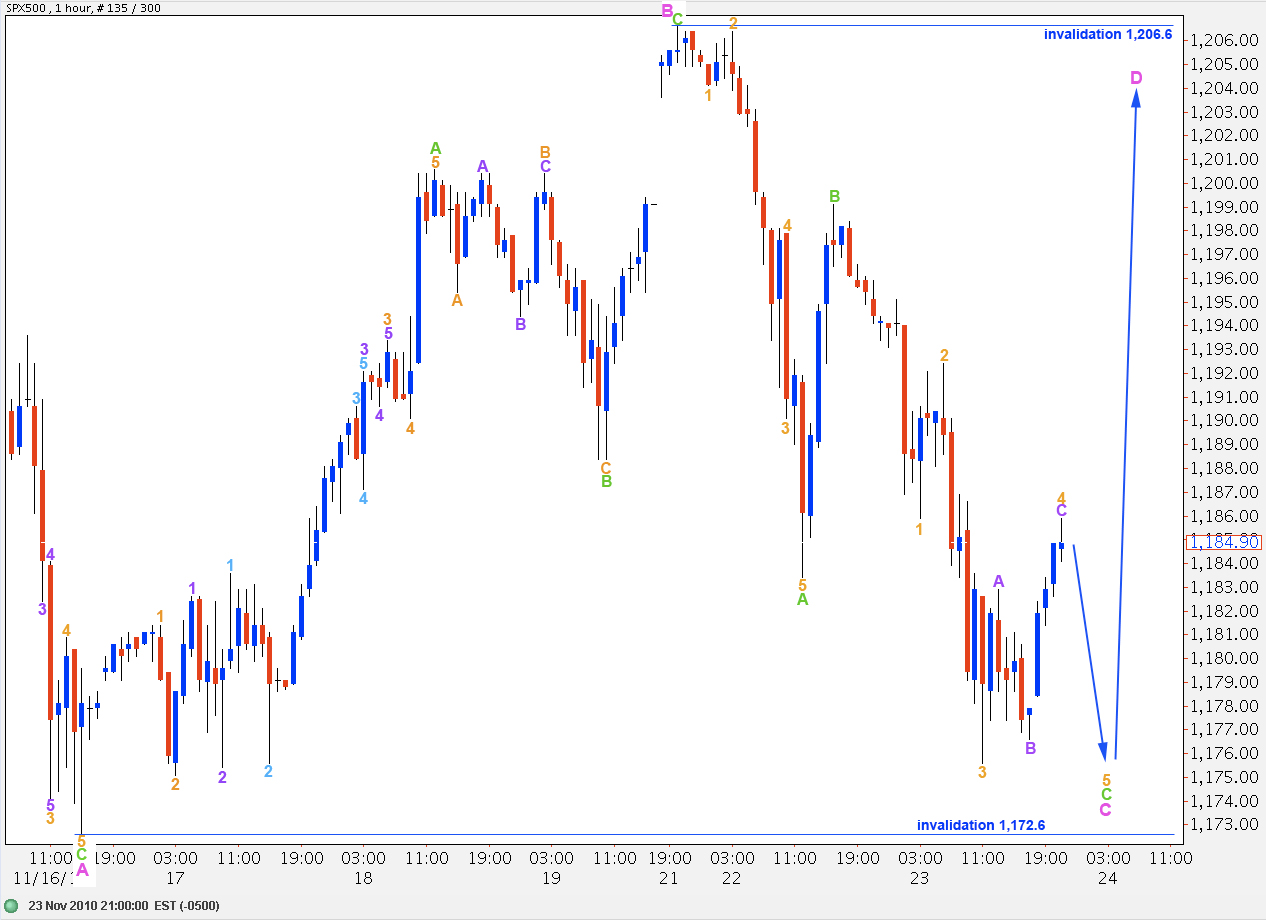
Finally, it is possible that wave 4 blue is unfolding as a triangle structure. This would see wave 4 blue being of a reasonably lengthy duration.
Price must remain above 1,172.6 and below 1,206.6 for a contracting triangle to remain a valid possibility.
Alternate Daily Wave Count
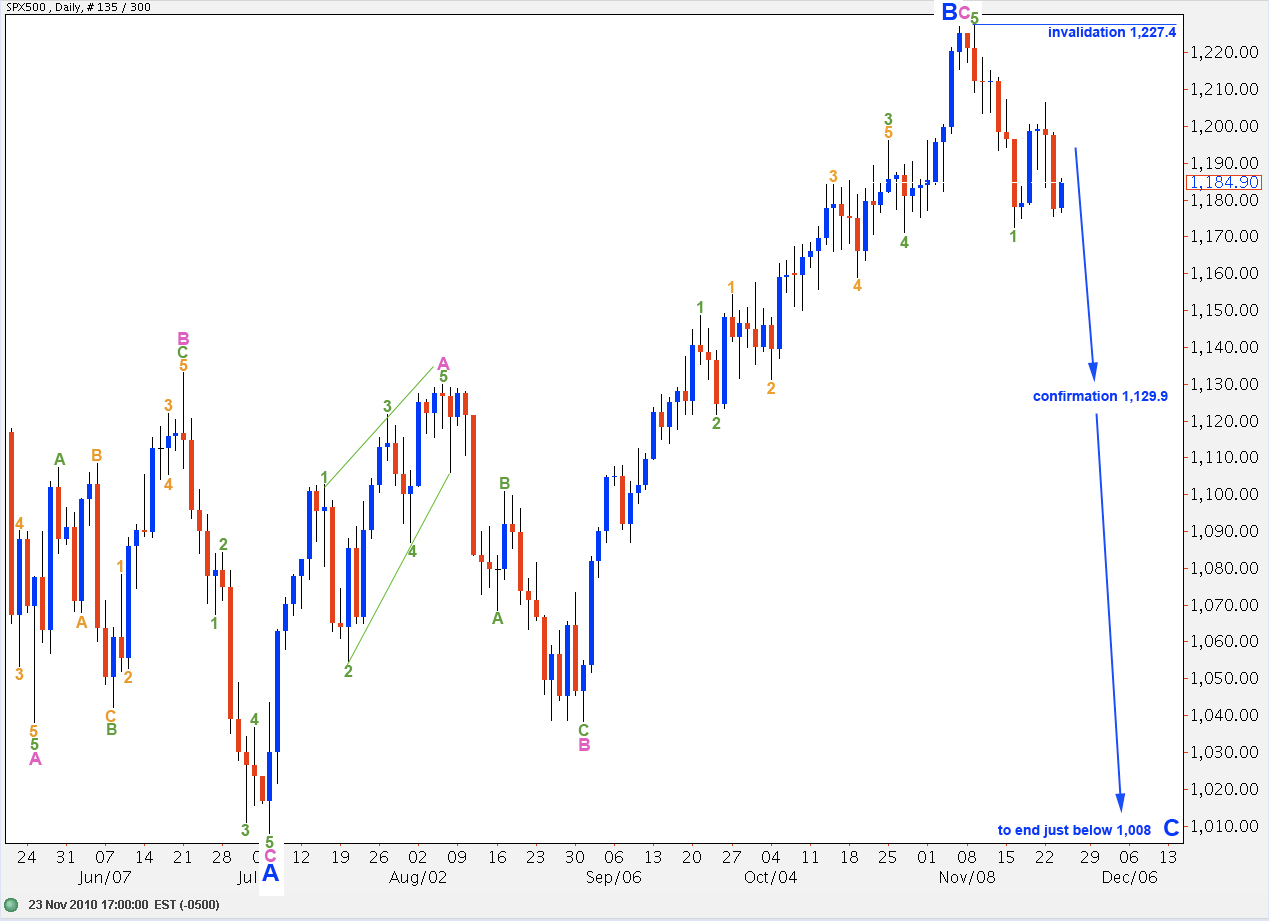
This alternate wave count expects wave B black is still unfolding as a regular flat correction.
Wave B blue was 103% the length of wave A blue. Therefore, wave C blue is most likely to end just beyond the end of wave A blue, below 1,008.
If the main wave count is invalidated with movement below 1,129.9 this alternate wave count will be correct. At that stage we may expect there is a very high probability of downward movement continuing and ending only below 1,008.
Wave 2 green may not move beyond the end of wave 1 green. Therefore, this wave count is invalidated with movement above 1,227.4