
Elliott Wave chart analysis for the SPX500 for 22nd November, 2010. Please click on the charts below to enlarge.
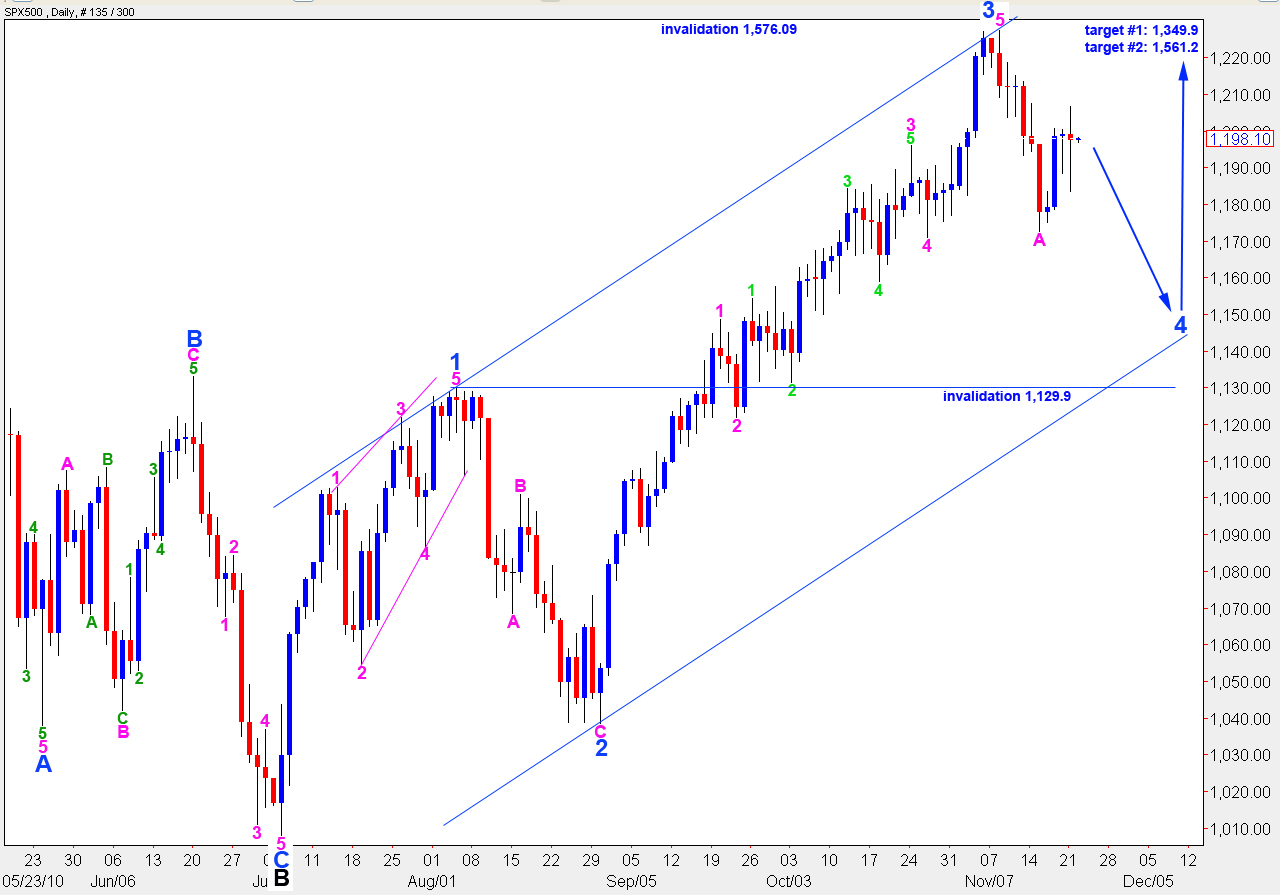
Price has remained above the hourly chart invalidation point of 1,190.4. Wave 4 blue is most likely not yet over. If it lasts a fibonacci 13 days it may end on Wednesday. The next fibonacci number in the sequence would see wave 4 blue ending on 8th December, lasting 21 days.
Wave 4 blue is likely to end about the lower edge of the parallel channel containing wave C black upwards.
Mid term targets for wave C black to end primary wave 2 remain the same. At 1,349.9 wave C black will reach 0.618 the length of wave A black. At 1,561.2 wave C black will reach equality with wave A black. This is the most likely target as this is the most common relationship between waves A and C of a simple zigzag.
Primary wave 2 may not move beyond the start of primary wave . Therefore, upwards movement should not move above 1,576.09.
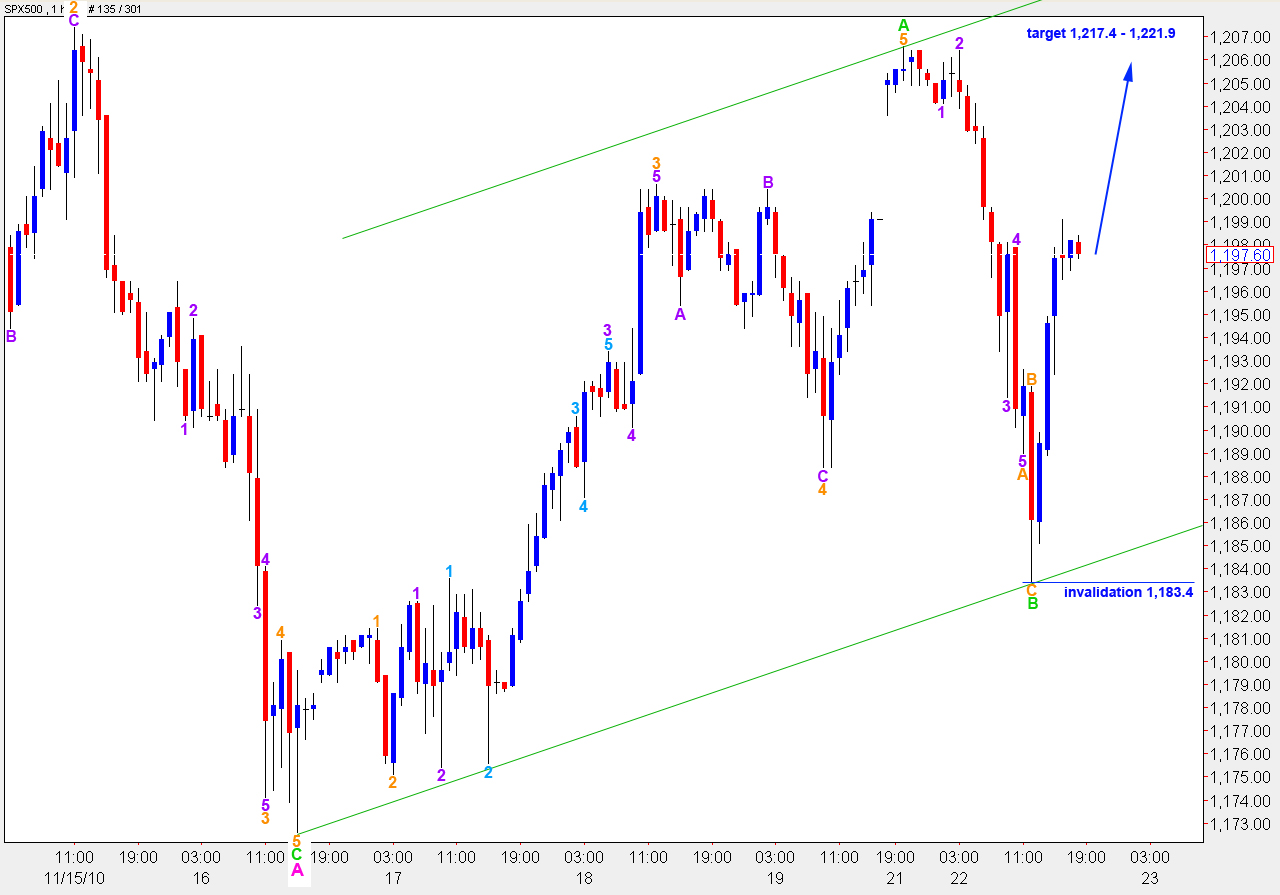
Wave 4 orange extended lower. This gives a more satisfactory structure for wave A green as wave 5 orange is not now truncated.
Ratios within wave A green are: wave 3 orange is just 2 points longer than 2.618 the length of wave 1 green and wave 5 green is 2.6 points longer than 0.618 the length of wave 3 green.
Wave B green has a corrective wave count. Wave C orange within it is 1.8 points longer than 0.382 the length of wave A orange.
Ratios within wave A orange of wave B green are: wave 1 purple has no fibonacci ratio to either waves 3 or 5 purple and wave 5 purple is just 0.4 points short of 0.618 the length of wave 3 purple.
While wave C green continues higher we should not see price move below its start at 1,183.4. If this wave count at the hourly level is invalidated by downwards movement then it is likely that wave B pink is over and wave C pink of wave 4 blue is underway.
At 1,217.4 wave C green will reach equality with wave A green.
At 1,221.9 wave B pink will reach 90% the length of wave A pink.
Alternate Daily Wave Count.
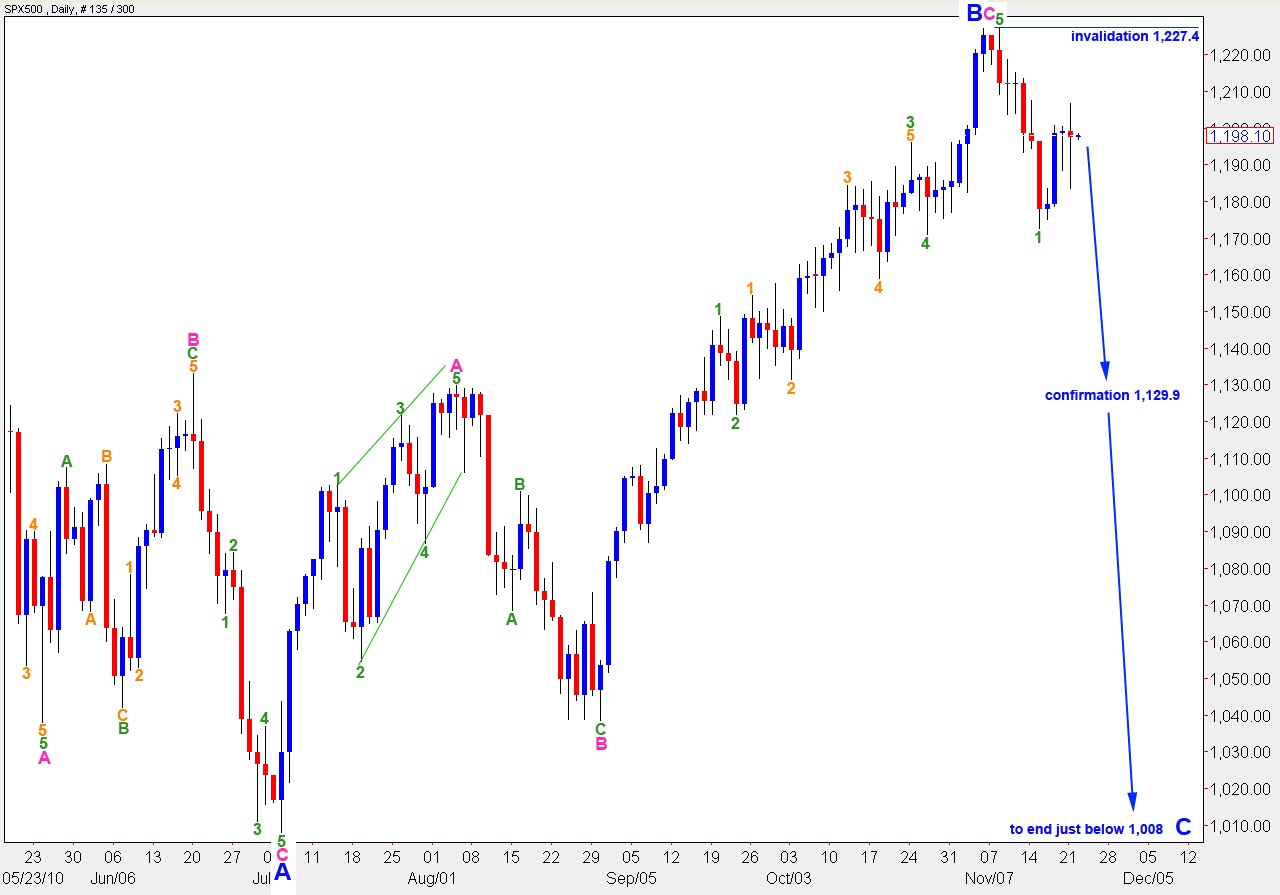
This alternate wave count expects wave B black is still unfolding as a regular flat correction.
Wave B blue was 103% the length of wave A blue. Therefore, wave C blue is most likely to end just beyond the end of wave A blue, below 1,008.
If the main wave count is invalidated with movement below 1,129.9 this alternate wave count will be correct. At that stage we may expect there is a very high probability of downwards movement continuing and ending only below 1,008.
Wave 2 green may not move beyond the end of wave 1 green. Therefore, this wave count is invalidated with movement above 1,227.4.