
Elliott Wave chart analysis for the SPX500 for 19th November, 2010. Please click on the charts below to enlarge.
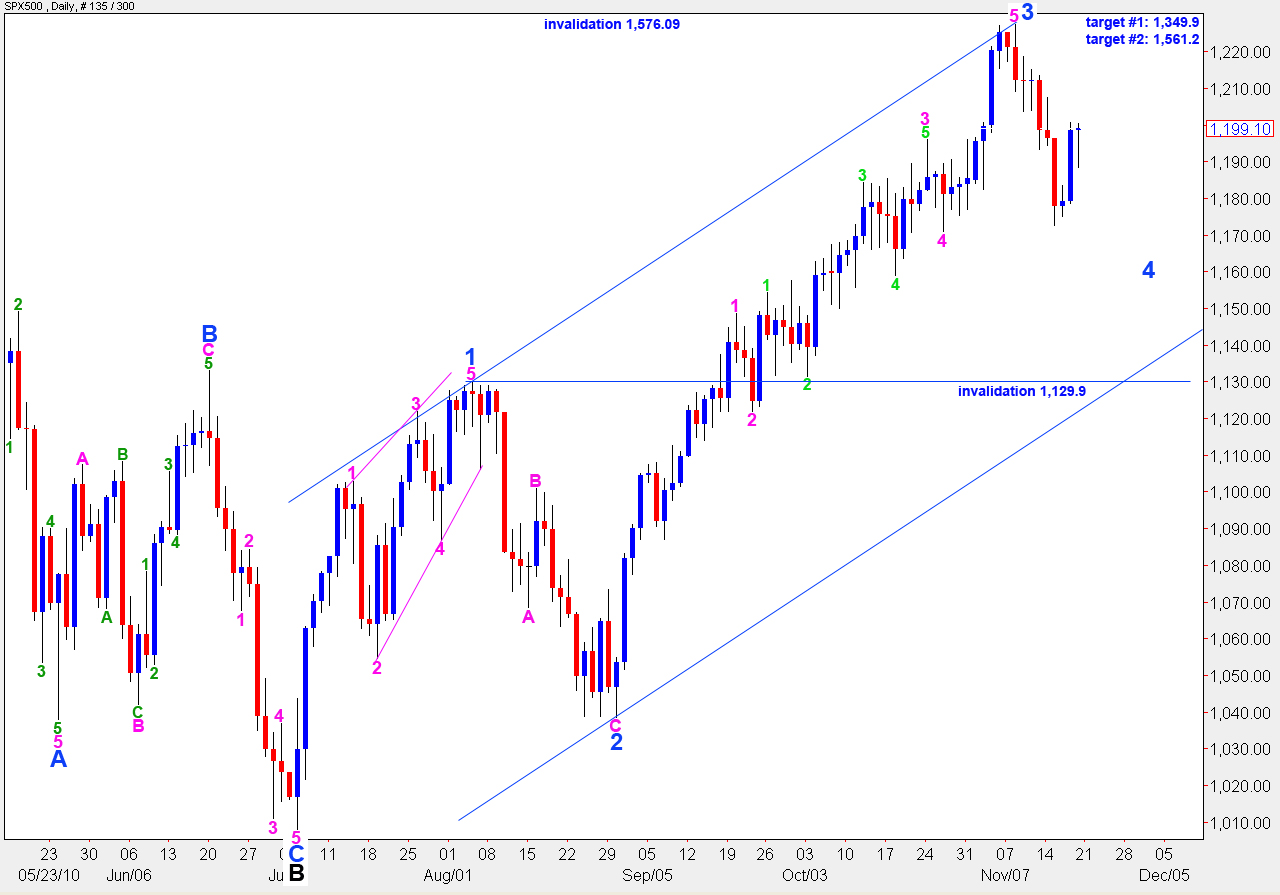
We should be seeing further upwards movement for Monday’s trading session to end wave B pink within wave 4 blue.
If wave 4 blue is unfolding as a flat correction, then wave B pink must reach 1,221.9 or higher and it may end above 1,227.4.
If wave 4 blue is unfolding as a triangle, then wave B pink does not have a minimum length in relation to wave A pink; it only needs to be a zigzag.
Long term targets for the end to primary wave 2 remain the same. At 1,349.9 wave C black will reach 0.618 the length of wave A black. At 1,561.2 wave C black will reach equality with wave A black.
Primary wave 2 may not move beyond the start of primary wave 1. Therefore, we should not see movement above 1,576.09.
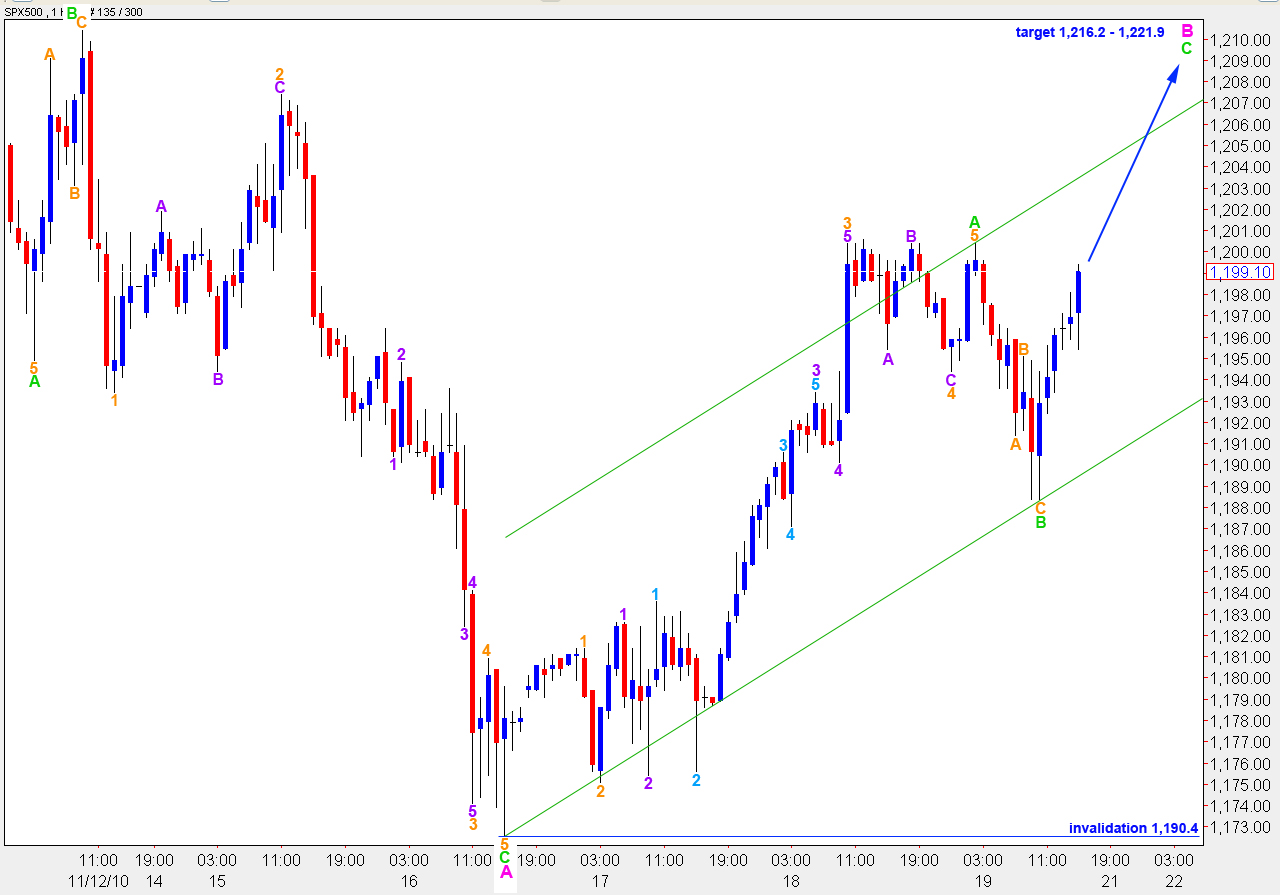
We were expecting a little further upwards movement to end wave 5 orange and, therefore, wave A green; the target was at 1,203.3. This did not happen and wave 5 orange is slightly truncated.
Ratios within wave A green are: wave 3 orange is 2 points longer than 2.618 the length of wave 1 orange and wave 5 orange is just 0.5 points short of 0.618 the length of wave 1 orange.
Within wave 4 orange waves A and C are just 0.8 points off equality.
Within wave B green wave C orange is 1.1 points longer than 0.618 the length of wave A orange.
We can now draw a trend channel around this upwards correction. It is highly likely that wave C green will overshoot the upper green trend line. When we have candlesticks below the lower edge of this trend channel then we shall have an indication that wave B pink is over and wave C pink is underway.
In the short term if wave B green extends lower it may not move beyond the start of wave A green. Therefore, price should not move below 1,190.4.
At 1,216.2 wave C green will reach equality with wave A green. At 1,221.9 wave B pink will reach 90% of wave A pink. This is our upwards target zone for wave B pink to end.
Alternate Daily Wave Count.
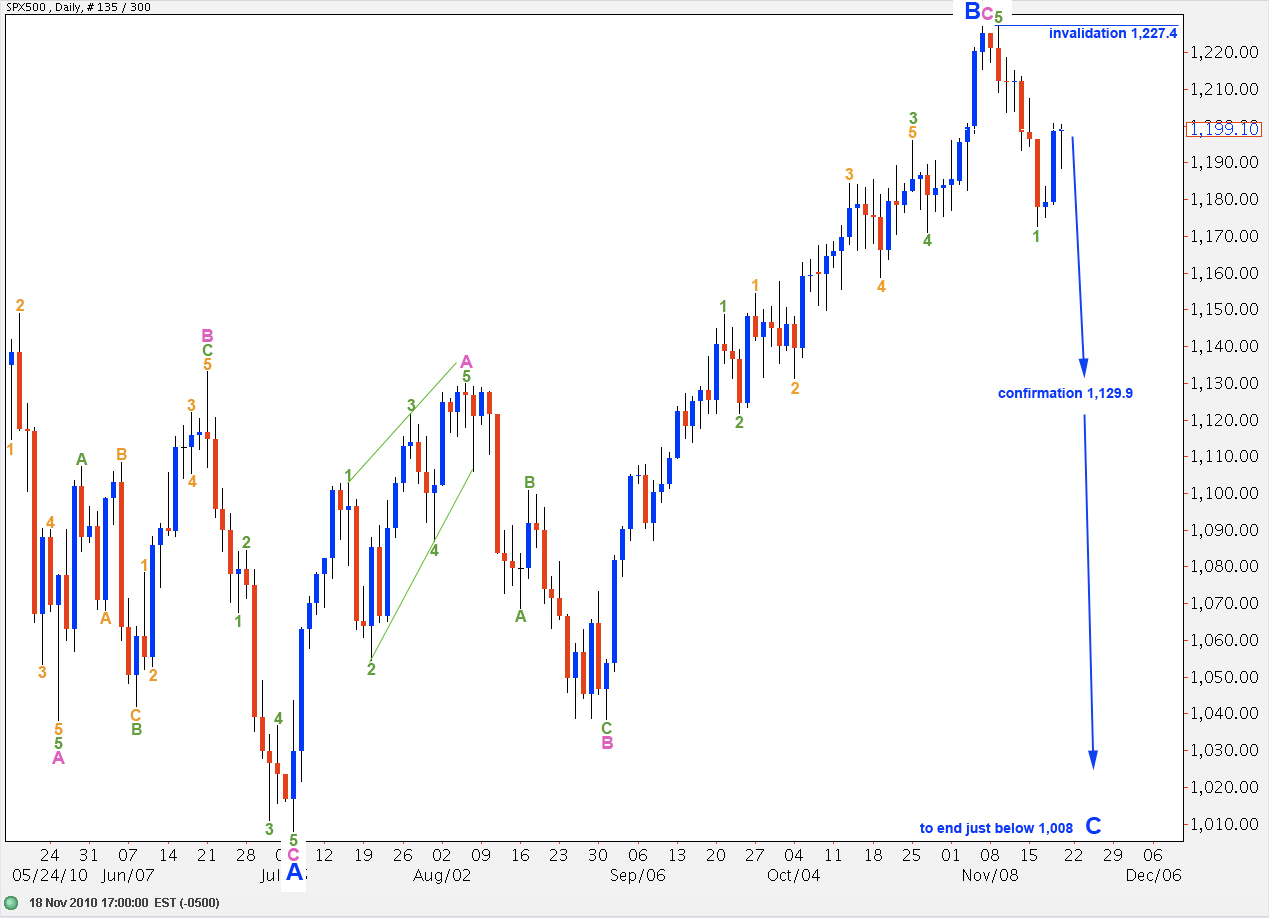
This alternate wave count expects wave B black is still unfolding as a regular flat correction.
Wave B blue was 103% the length of wave A blue. Therefore, wave C blue is most likely to end just beyond the end of wave A blue, below 1,008.
If the main wave count is invalidated with movement below 1,129.9 this alternate wave count will be correct. At that stage we may expect there is a very high probability of downwards movement continuing and ending only below 1,008.
Wave 2 green may not move beyond the end of wave 1 green. Therefore, this wave count is invalidated with movement above 1,227.4.