
Elliott Wave chart analysis for the SPX500 for 18th November, 2010. Please click on the charts below to enlarge.
Upwards movement has invalidated the wave count at the hourly chart level. Wave A pink within wave 4 blue is over and upwards movement is wave B pink.
If wave 4 blue is unfolding as a flat correction then wave B pink must be at least 90% of A which is at 1,221,9.
If wave B pink does not reach 90% of A then wave 4 blue may be a zigzag or triangle.
If wave 4 blue began at 1,227.1, and was an expanded flat correction with an exceptionally long C wave within it, then it may have been over on the 16th at 1,172.6, lasting a fibonacci 8 days. This is possible but it seems unlikely that wave 4 at minor degree would be this brief and the length of wave C in relation to wave A is unusual.
We were expecting a little more downwards movement to end wave A pink before significant upwards movement for wave B pink, but this has not happened.
It is possible to see a complete zigzag for wave A pink. This structure is ambiguous and it is also possible to count it as an impulse.
Ratios within wave A pink are: wave C green is just 5.3 points longer than equality with wave A green.
Ratios within wave C green are: wave 3 orange is 5.8 points longer than 1.618 the length of wave 1 orange and wave 5 orange is just 0.4 points longer than 0.236 the length of wave 3 orange.
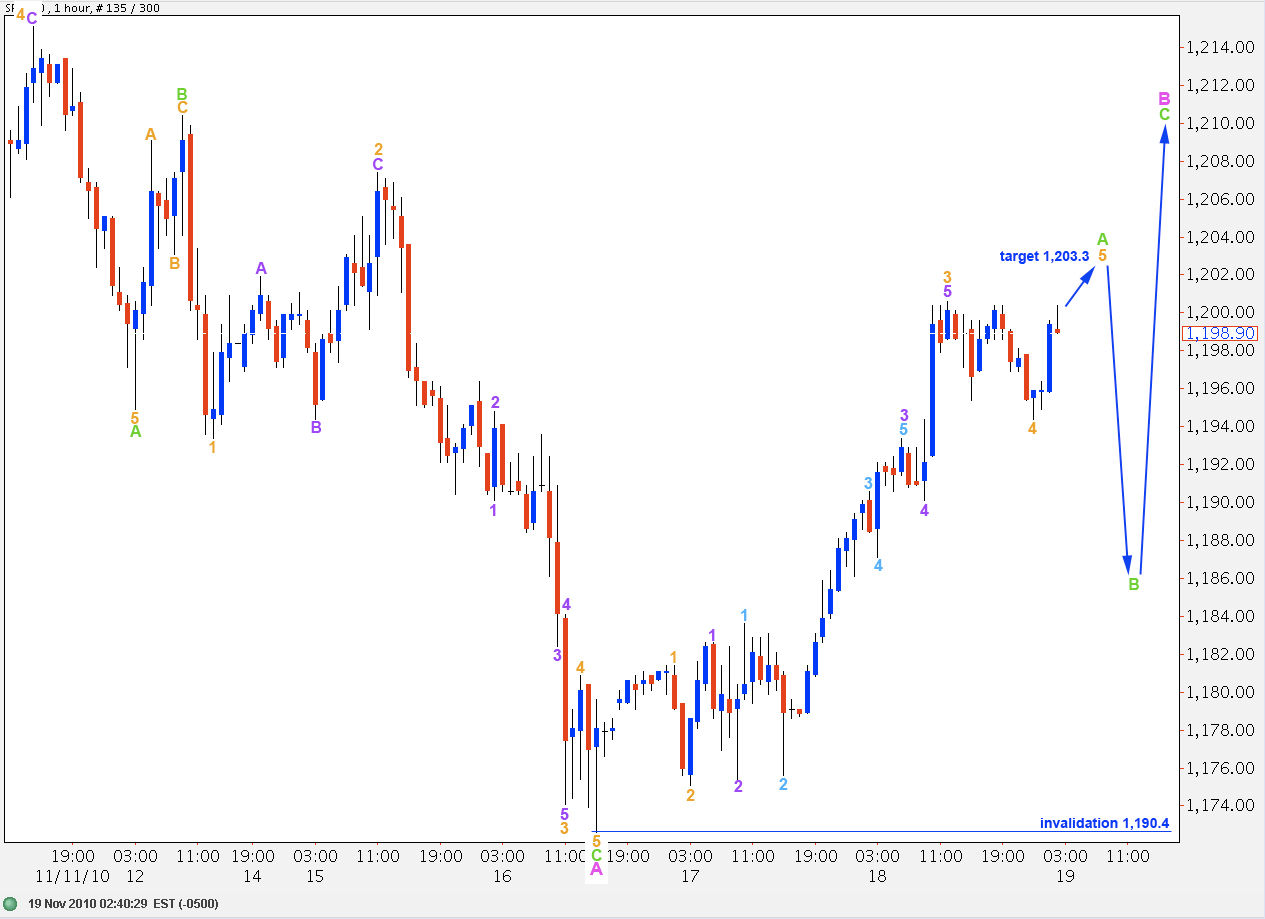
Ratios within wave A green of wave B pink are: wave 3 orange is just 2 points longer than 2.618 the length of wave 1 orange. Wave 5 orange will reach equality with wave 1 orange at 1,203.3. This is our target for wave A green to end.
Ratios within wave 3 orange of wave A green are: wave 3 purple is just 1.6 points short of 2.618 the length of wave 1 purple and wave 5 purple is 1.8 points short of 1.618 the length of wave 1 purple.
Ratios within wave 3 purple are: wave 3 aqua is 1.7 points longer than 1.618 the length of wave 1 aqua and wave 5 aqua is 1.2 points longer than 0.618 the length of wave 1 aqua.
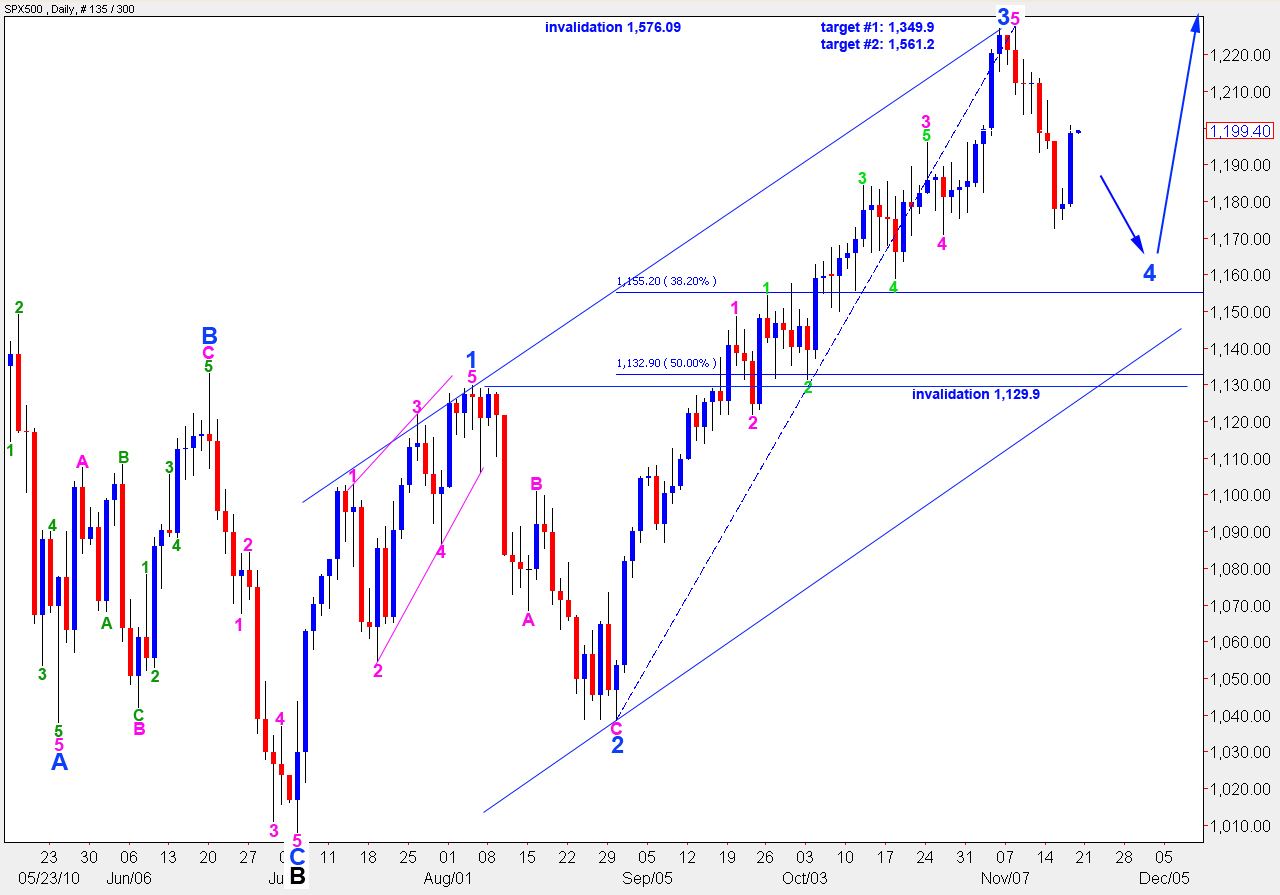
When wave 5 orange ends a complete impulse structure for wave A green we should see a zigzag to the downside for wave B green, which may not move beyond the start of A below 1,190.4.
When wave B green is over the S&P should resume upwards movement for another five wave impulse, probably towards 1,221.9 or above.
Alternate Wave Count.
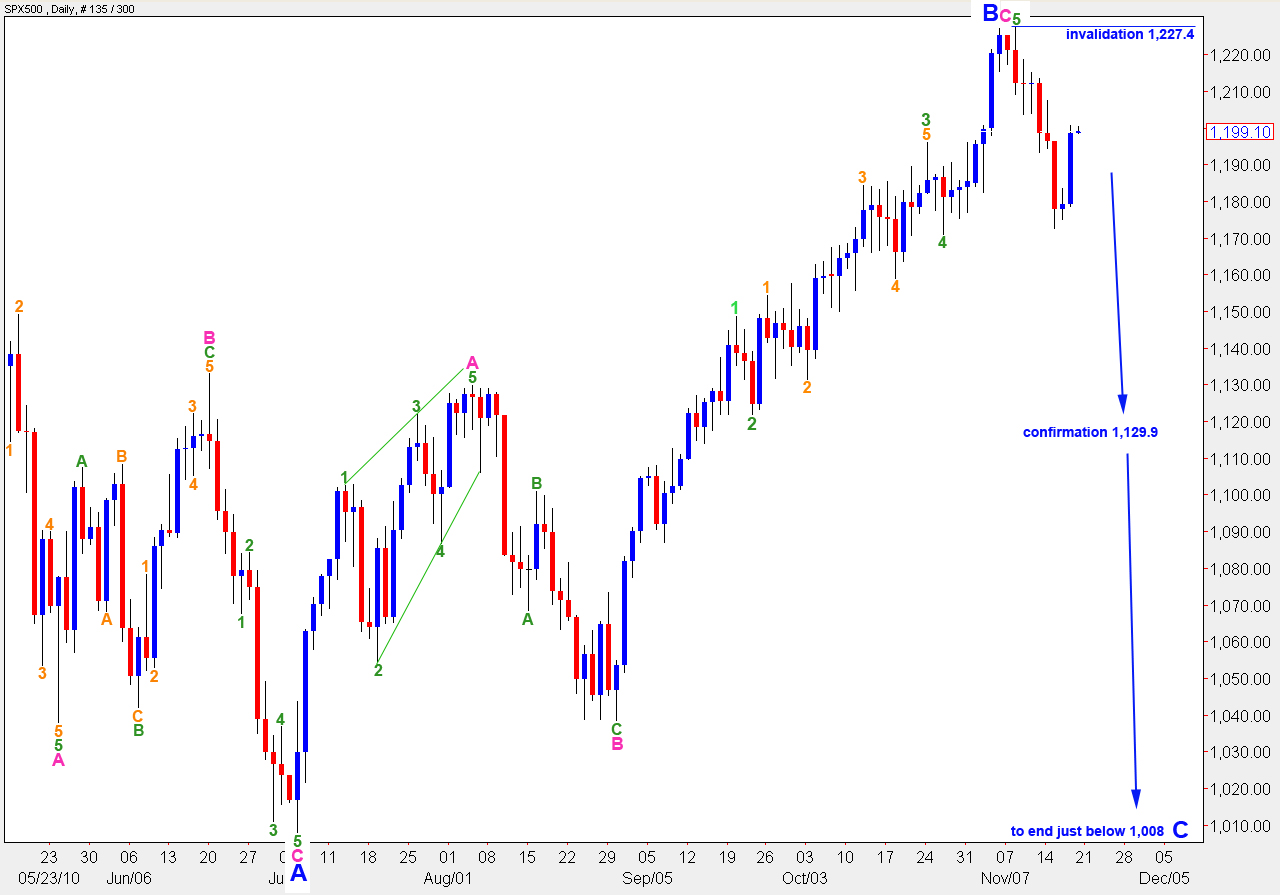
This alternate wave count expects the S&P is still in wave B black (intermediate) within primary wave 2.
Upwards movement is likely a second wave correction, and most likely is at green wave degree. Wave 2 may not move beyond the start of wave 1 therefore this wave count now would be invalidated with movement above 1,227.4.
Wave B blue was a 103% correction of wave A blue. Therefore, this B wave at intermediate degree is most likely a regular flat correction. Therefore, wave C blue is most likely to end just beyond the low of wave A blue, below 1,008.
If price moves below 1,129.9 the main wave count at the daily chart level will be invalidated. At that stage there will be a very high probability that price would continue downwards to end just below 1,008.