
Elliott Wave chart analysis for the SPX500 for 16th November, 2010. Please click on the charts below to enlarge.
Downwards movement below 1,190.4 has given a strong indication that the S&P is in a fourth wave at minor degree.
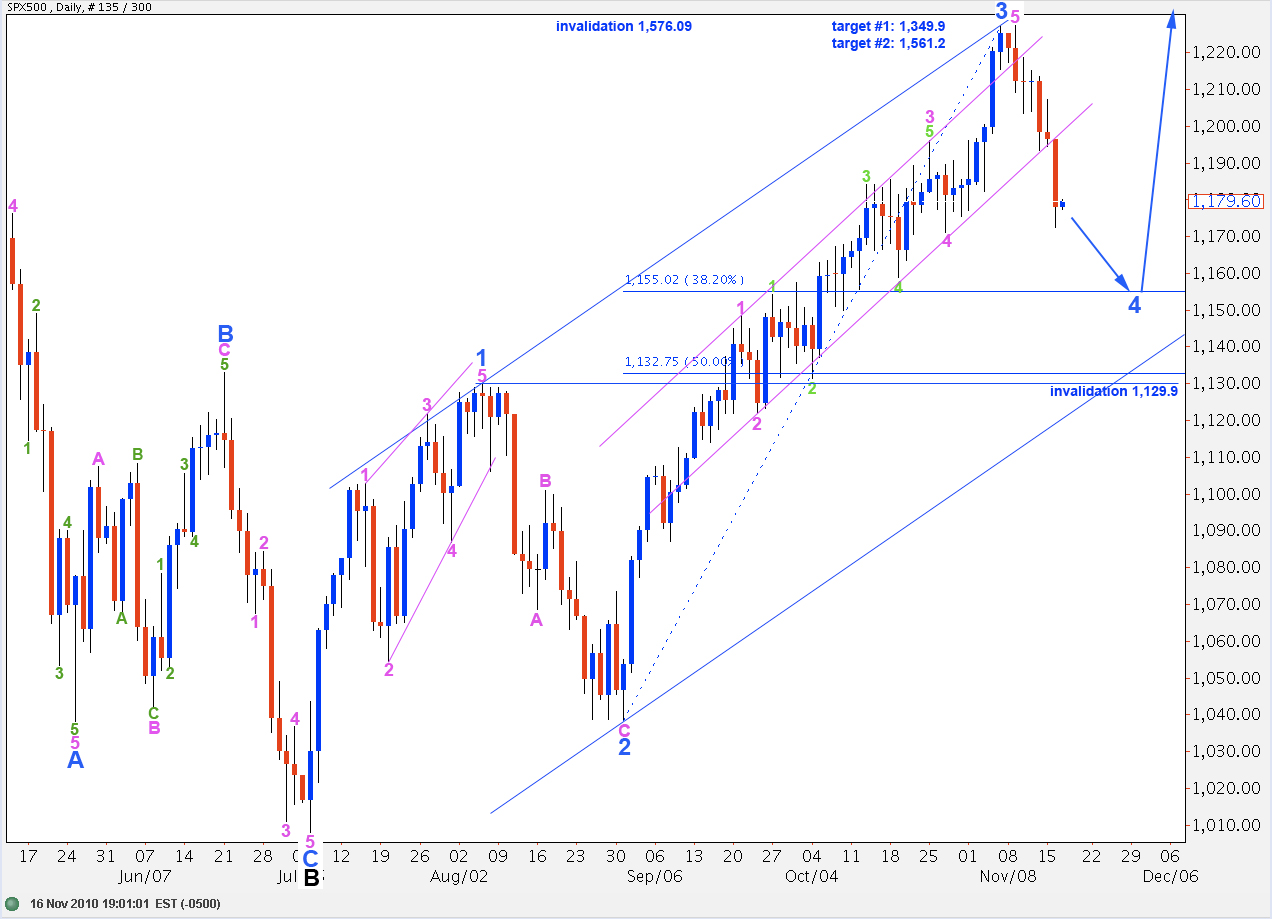
Ratios within wave 3 blue are: wave 3 pink is just 6.1 points longer than 0.618 the length of wave 1 pink, and wave 5 pink has no fibonacci ratio to either 1 or 3.
At this stage we may use fibonacci ratios for wave 3 blue as guidelines to where wave 4 blue is likely to end. Because wave 2 blue was a deep correction, 75% of wave 1 blue, it is likely that wave 4 blue will be a shallow correction, with the highest probability being 1,155.02 at the 0.382 fibonacci ratio.
Wave 2 blue was a simple zigzag. Wave 4 blue is likely to be a flat, triangle or combination correction.
Wave 4 blue may not move into wave 1 blue price territory. Therefore, this downwards movement for this wave count may not move below 1,107.6. If this wave count is invalidated with downwards movement then the alternate daily wave count will be correct.
On the 3rd of December downwards movement will have lasted a fibonacci 21 days. It may end on this date, give or take one trading day either side.
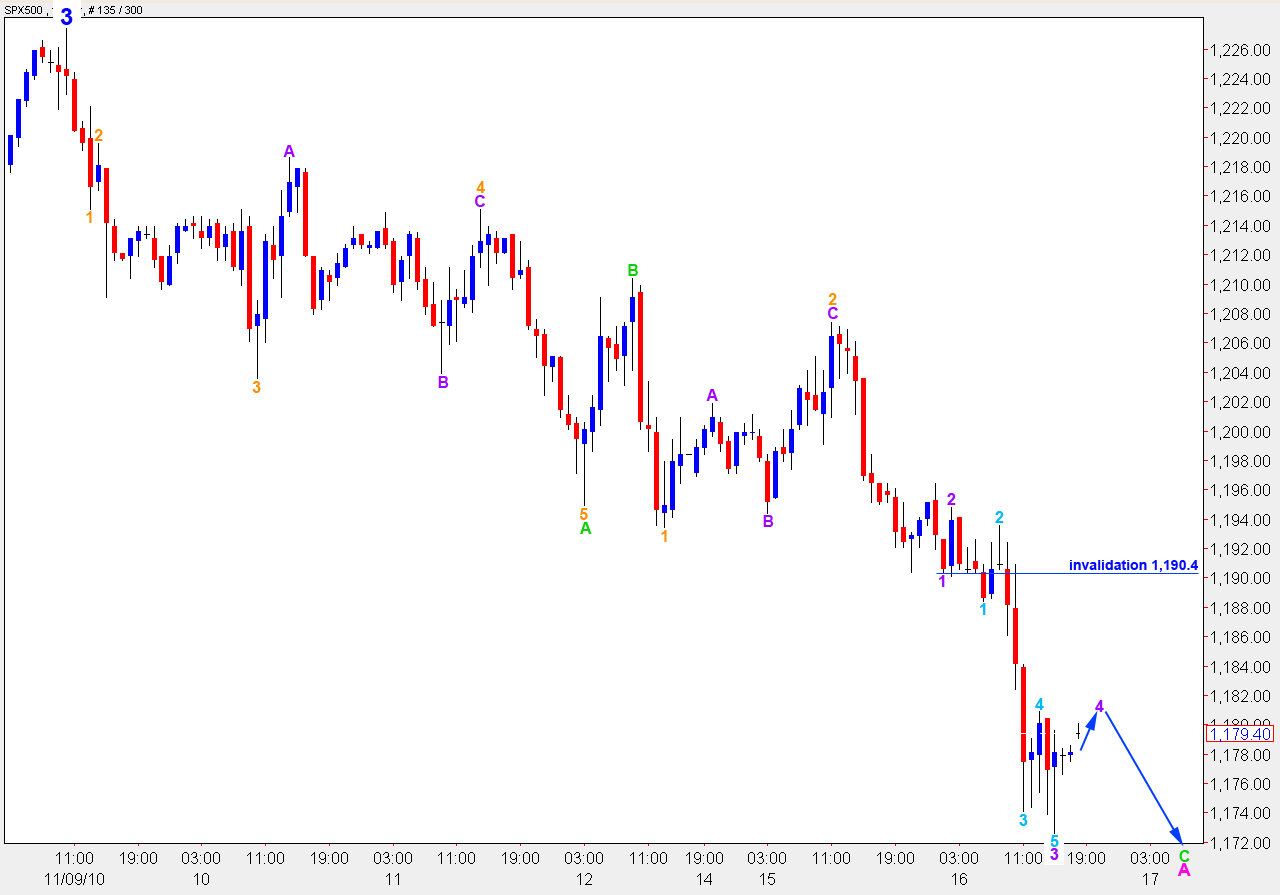
It is likely that wave 4 blue began at 1,127.4 with wave A pink.
Wave A pink is fairly likely to be a three wave structure and it is probably completing wave C at this stage. Wave A pink may also be a five wave structure. We will have to keep this in mind as this downwards wave ends.
Upwards movement is completing a small fourth wave correction. Wave 4 purple may not move into wave 1 purple price territory above 1,190.4.
Thereafter, we should expect another short fifth wave to end wave 3 orange. Thereafter, another fourth wave at orange degree will give the next couple of trading sessions a choppy overlapping look.
Wave C green has passed equality with wave A green. It will reach 1.618 the length of wave A green at 1,157.8.
When wave A pink has a satisfactory zigzag structure then the S&P will be due for a larger correction for wave B pink to the upside.
Alternate Daily Wave Count.
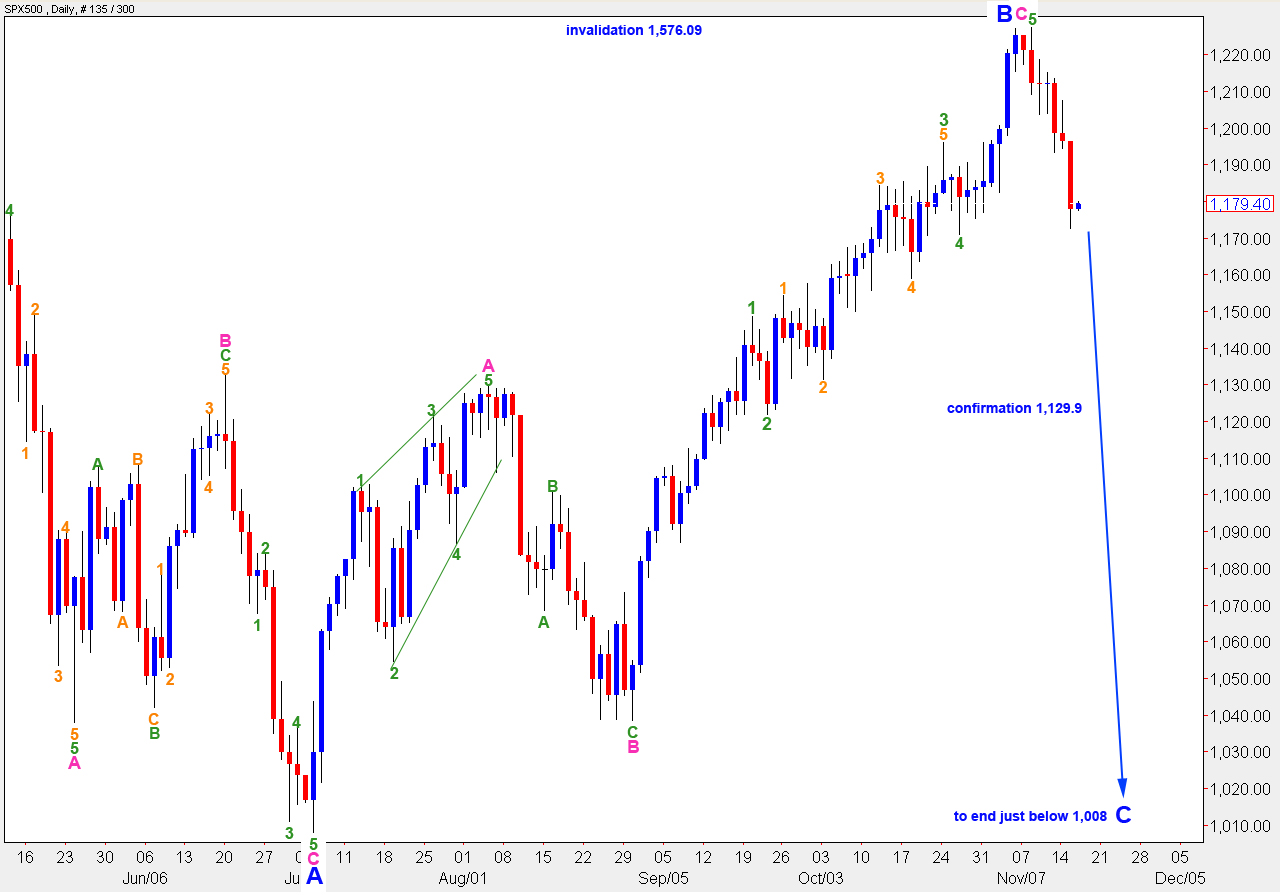
Downwards movement has increased the likelihood that wave B blue is over.
Wave B blue was a 103% correction of wave A blue. Therefore, this B wave at intermediate degree is most likely a regular flat correction. Therefore, wave C blue is most likely to end just beyond the low of wave A blue, below 1,008.