
Elliott Wave chart analysis for the SPX500 for 15th November, 2010. Please click on the charts below to enlarge.
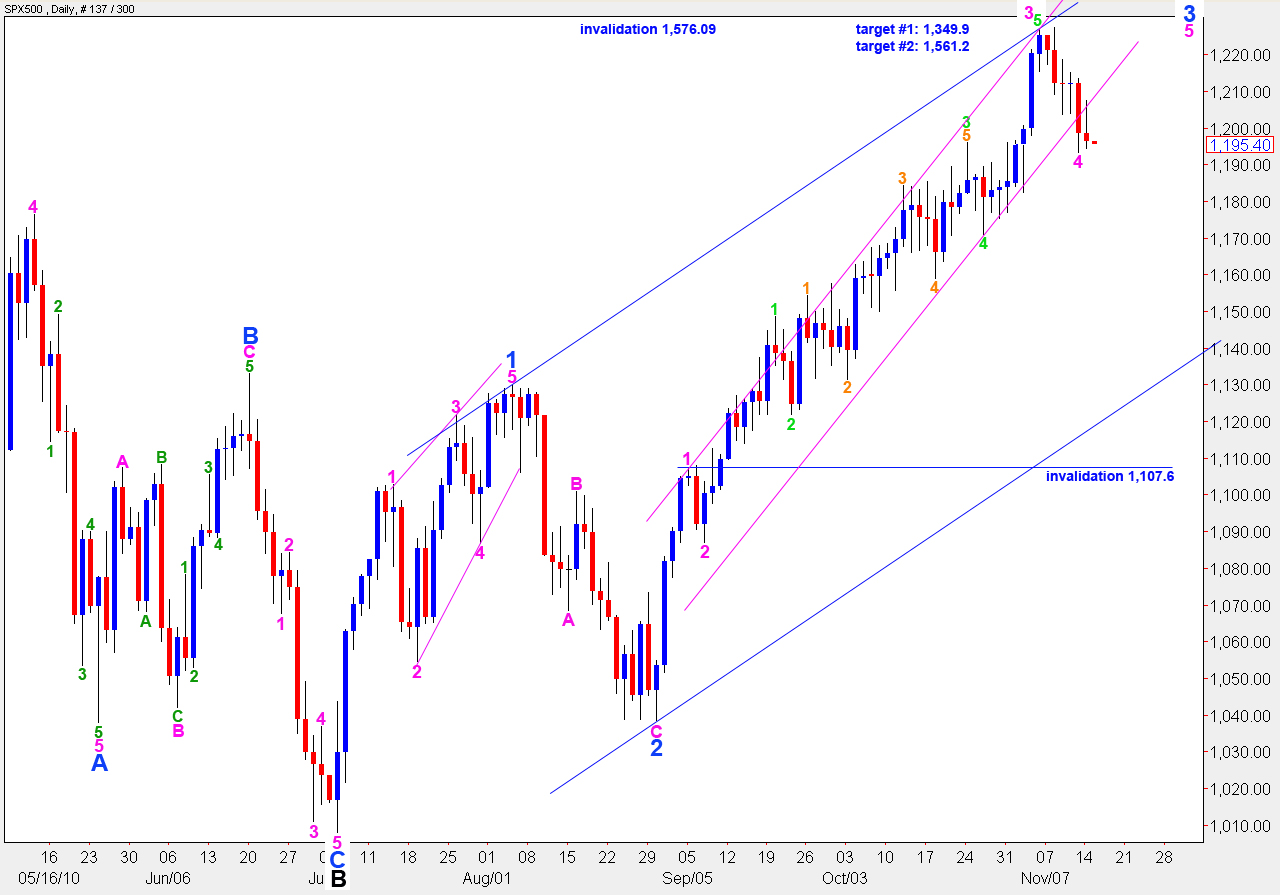
As expected we have had further downwards movement for wave 4 pink. If this correction is at pink (minute) degree it is likely that it is over before the next New York session opens. If however it is at blue (minor) degree then the next New York session should see further downwards movement.
If downwards movement continues for Tuesday we may have a candlestick outside the lower edge of the pink parallel channel containing wave 3 blue upwards. That would be a strong indication that wave 3 blue is over. Wave 4 blue may not move into wave 1 blue price territory therefore the invalidation point would move up to 1,129.9.
If however this correction was at minute degree we should see a resumption of the upwards trend for Tuesday’s session.
Primary wave 2 may not move beyond the start of primary wave 1 therefore upwards movement may not move above 1,576.09.
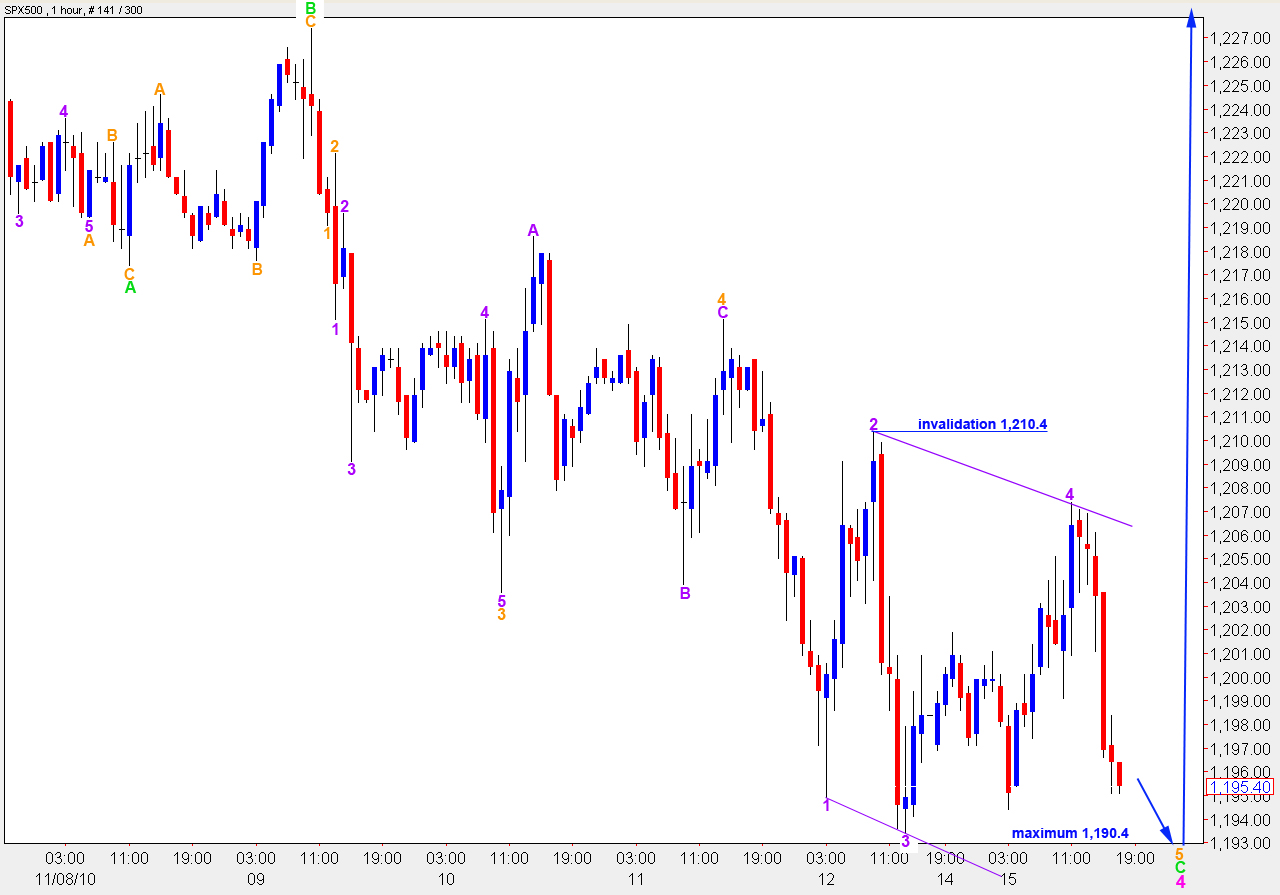
As expected the S&P moved upwards to complete wave 4 of the ending diagonal 0.2 points above the target zone.
Thereafter price turned back down for a fifth wave which has ended below the low of wave 3 purple since this chart was uploaded.
Because this is a contracting ending diagonal wave 5 purple should not be longer than wave 3 purple. At 1,190.4 wave 5 purple will reach equality with wave 3 purple. This is the maximum allowable downwards limit for this structure.
If price moves below 1,190.4 then the likelihood of this fourth wave correction being at minor degree (and labeling here being all one degree higher) is increased.
Therefore if we see price movement below 1.190.4 then the likelihood of the short term trend remaining down for another week or more is increased.
Alternate Daily Wave Count.
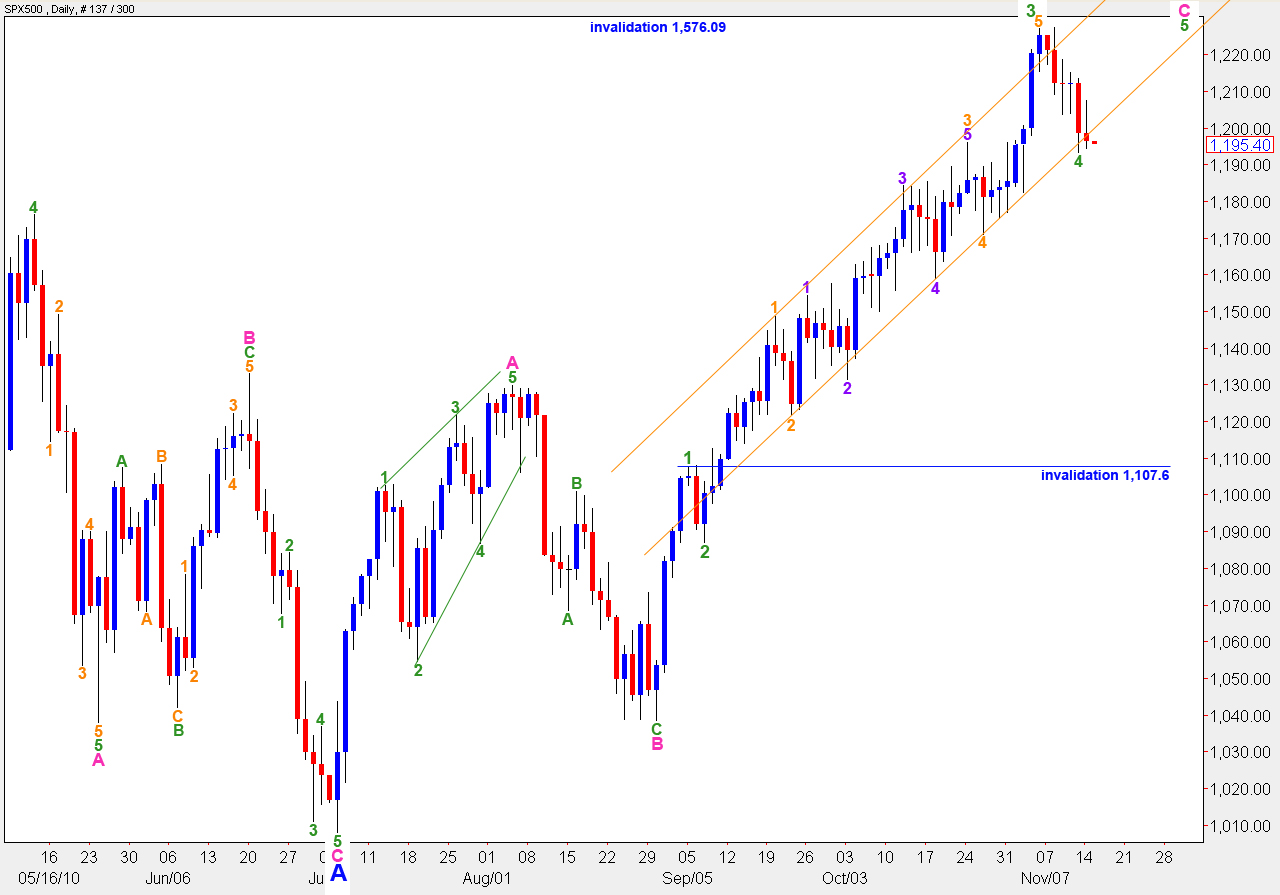
The short term outlook for this alternate daily wave count is exactly the same as the main wave count.
In the long term this wave count expects a C wave at minor (blue) degree to develop to the downside to complete an expanded flat correction for wave B black.
If price moves below 1,129.9 before we have a satisfactory five wave structure from the low at 1,008 (labeled here A blue) then this wave count will provide explanation and the most likely next direction.