
Elliott Wave chart analysis for the SPX500 for 12th November, 2010. Please click on the charts below to enlarge.
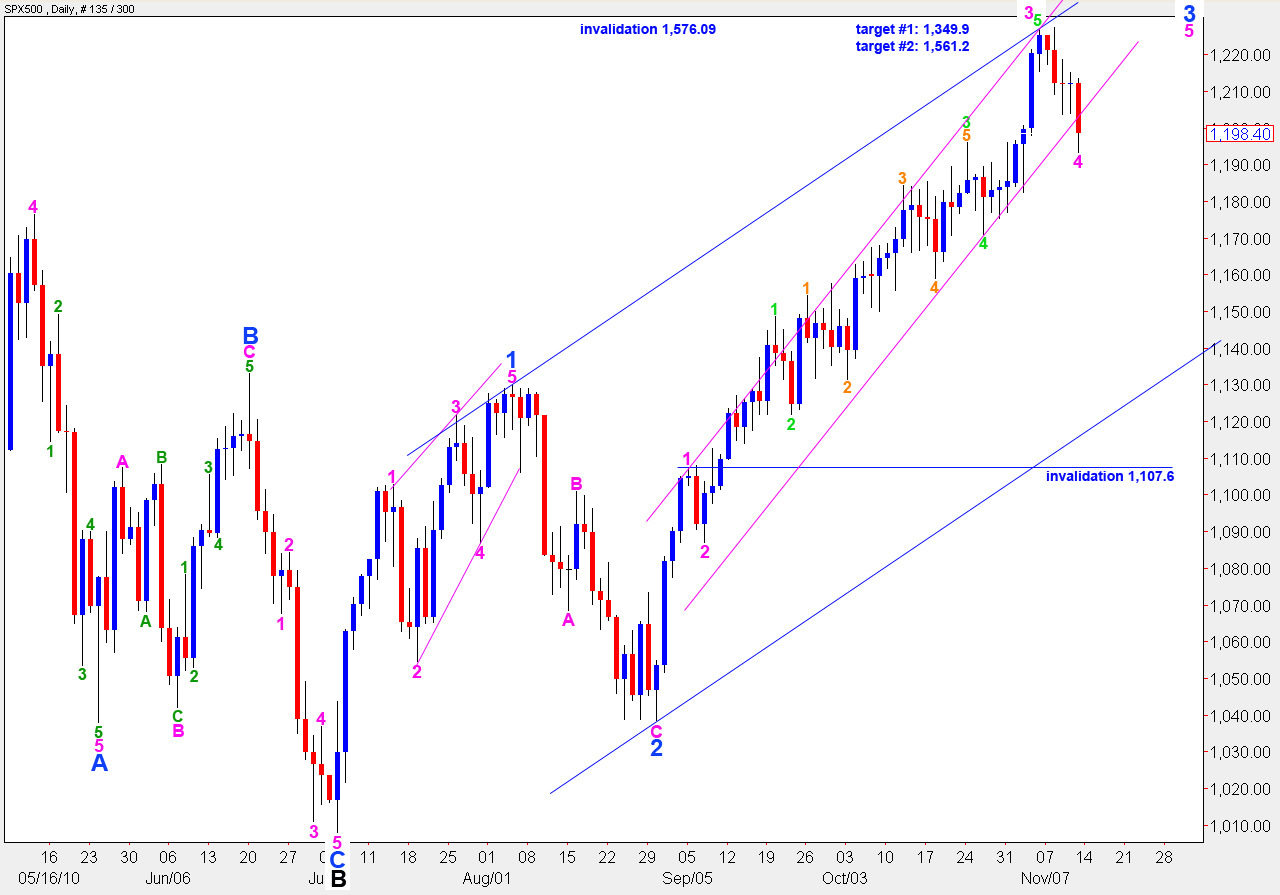
Wave 4 at pink (minute) or blue (minor) degree continues to move downwards as expected.
This fourth wave correction is still not over. The structure requires further downwards movement to be complete.
If we see a candlestick below the lower edge of the narrow pink parallel channel, containing wave 3 blue upwards, then this correction is likely to be of one degree higher than labeled here. At that stage we may expect the correction is at blue (minor) degree and the invalidation point would move, therefore, to 1,219.9.
If this correction is a fourth wave at minor degree we should also expect it to be of a duration reasonably equal to wave 2 blue which lasted 18 days. This would take it to the 1st of December (18 days, equal in duration to wave 2 blue) to the 6th of December (a fibonacci 21 days).
At this stage I will leave the labeling of this correction at pink (minute) degree. The short term outlook is the same.
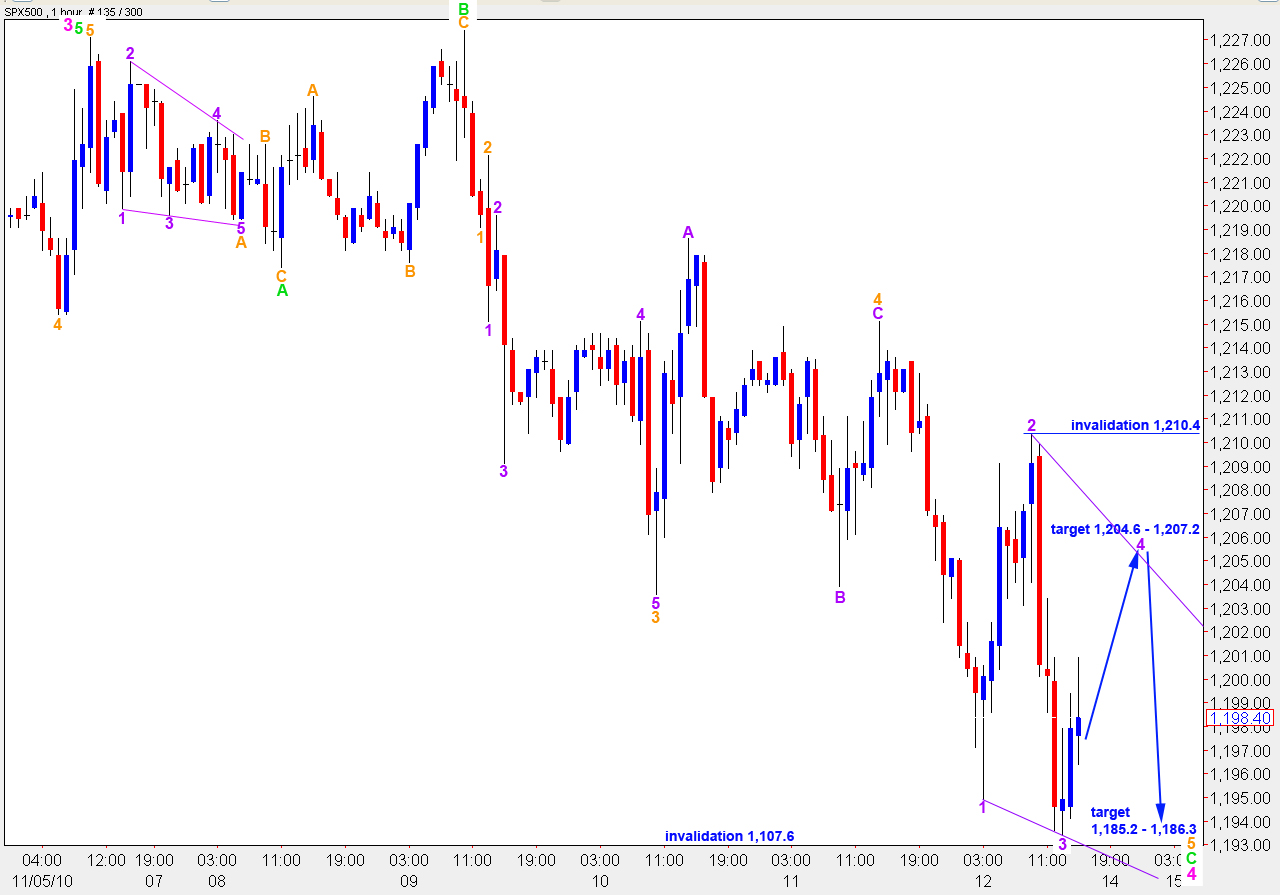
Downwards movement for wave C green has passed 2.618 the length of wave A green. The next likely target is 4.236 the length of wave A green which is at 1,186.3.
Within wave C green wave 3 orange is 3.2 points short of 2.618 the length of wave 1 green.
Wave 4 orange is a regular flat correction with a truncated C wave within it.
Wave 5 orange is most likely unfolding as a contracting ending diagonal. Wave 1 purple and wave 2 purple have corrective counts. Wave 3 purple on a 5 minute chart has a clear zigzag structure.
Wave 4 purple is most likely to be between 0.66 to 0.81 of wave 3 purple. Therefore, the target zone for upwards movement to end wave 4 purple lies between 1,204.6 to 1,207.2.
Wave 4 purple may not move beyond the end of wave 2 purple. Therefore, this diagonal for wave 5 green is invalidated with price movement above 1,210.4.
Thereafter, a final zigzag to the downside would complete this diagonal structure.
At 1,185.2 wave 5 green will reach 1.618 the length of wave 3 green. This is the lower end of the target zone.
Alternate Daily Wave Count.
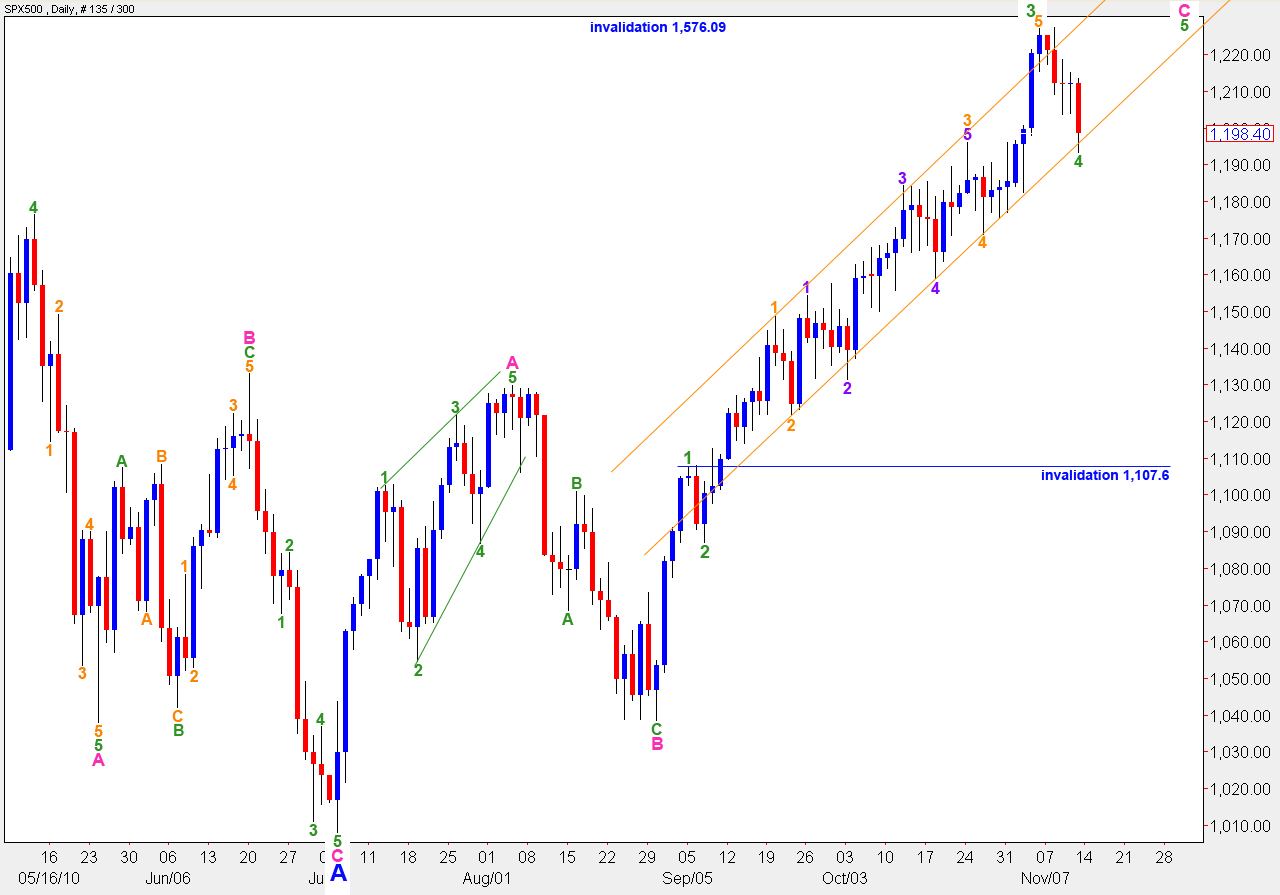
The short term outlook for this alternate daily wave count is exactly the same as the main wave count.
In the long term this wave count expects a C wave at minor (blue) degree to develop to the downside to complete an expanded flat correction for wave B black.
If price moves below 1,129.9 before we have a satisfactory five wave structure from the low at 1,008 (labeled here A blue) then this wave count will provide explanation and the most likely next direction.