
Elliott Wave chart analysis for the SPX500 for 11th November, 2010. Please click on the charts below to enlarge.
The S&P has moved sideways during the last New York session. It is likely that it is completing a small fourth wave triangle and should move strongly downwards when this is done.
If the thrust out of the triangle is short, and equal in length to the widest part of the triangle, then it is most likely that this correction is a fourth wave at minute (pink) degree.
If price moves strongly downwards through the target zone on the hourly chart then we may be seeing a fourth wave correction at minor (degree).
Downwards movement may not move below 1,107.6 as wave 4 pink may not move into wave 1 pink price territory. However it is most likely that if this is a pink wave 4 correction that price will remain close to the lower edge of the narrow pink parallel channel drawn here around wave 3 blue.
I have two hourly wave counts for you today. Both see downwards movement as wave 4 pink, the most likely structure is a triangle but it is also possible that this fourth wave is a regular flat.
Main Hourly Wave Count.
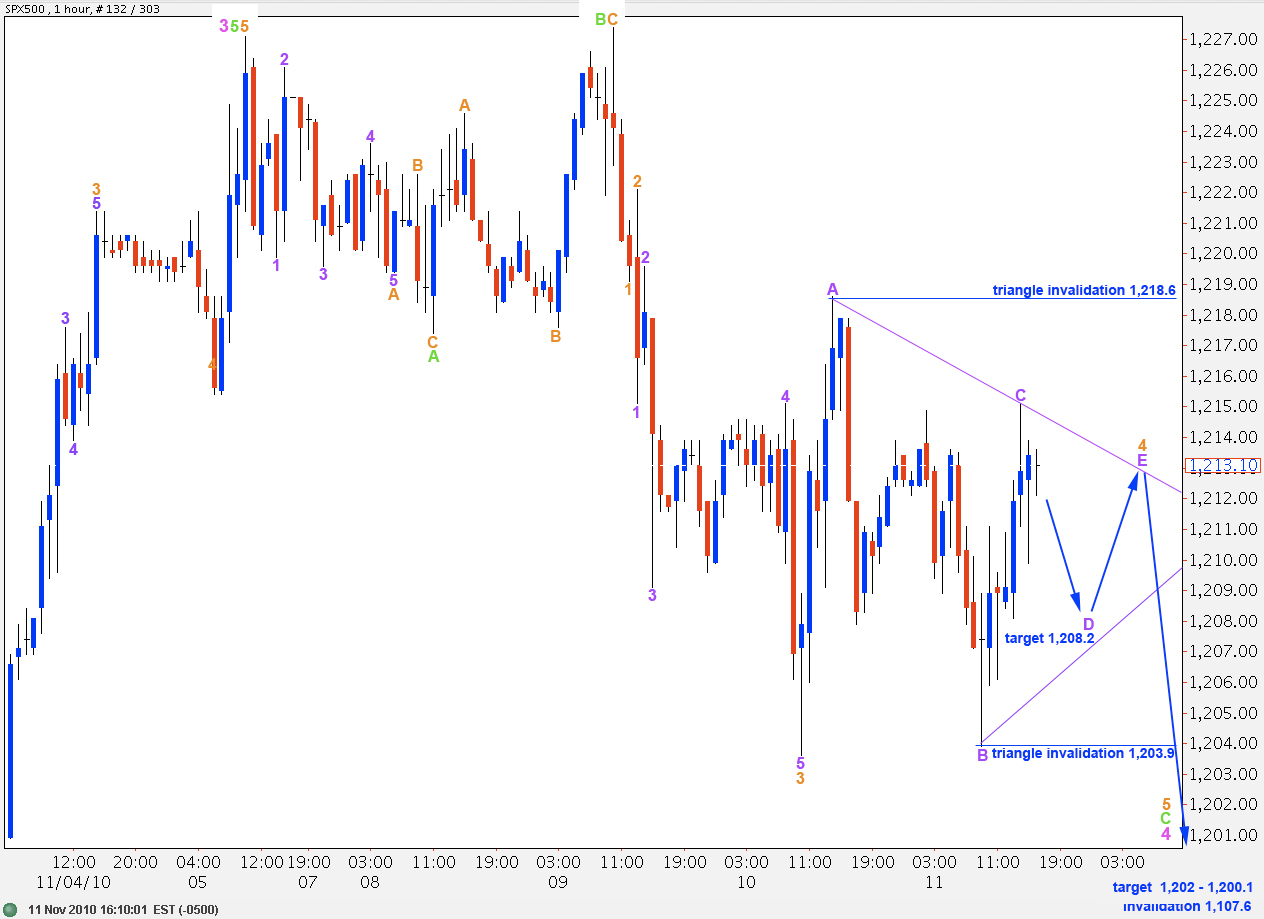
If this sideways movement is a triangle then price must remain between 1,218.6 above and 1,203.9 below while this structure completes.
At 1,208.2 wave D purple will reach 0.618 the length of wave C purple.
Thereafter wave E purple must complete upwards and cannot end beyond the end of wave C purple at 1,215.1. Wave E purple may either undershoot or overshoot the A-C trendline.
If this structure holds then we may be presented with a very low risk short term short position for wave 5 orange. Stops may be set just one point above the end of wave C purple when wave E purple is over. Wave 5 orange is likely to be about 15 points in length.
Alternate Hourly Wave Count.
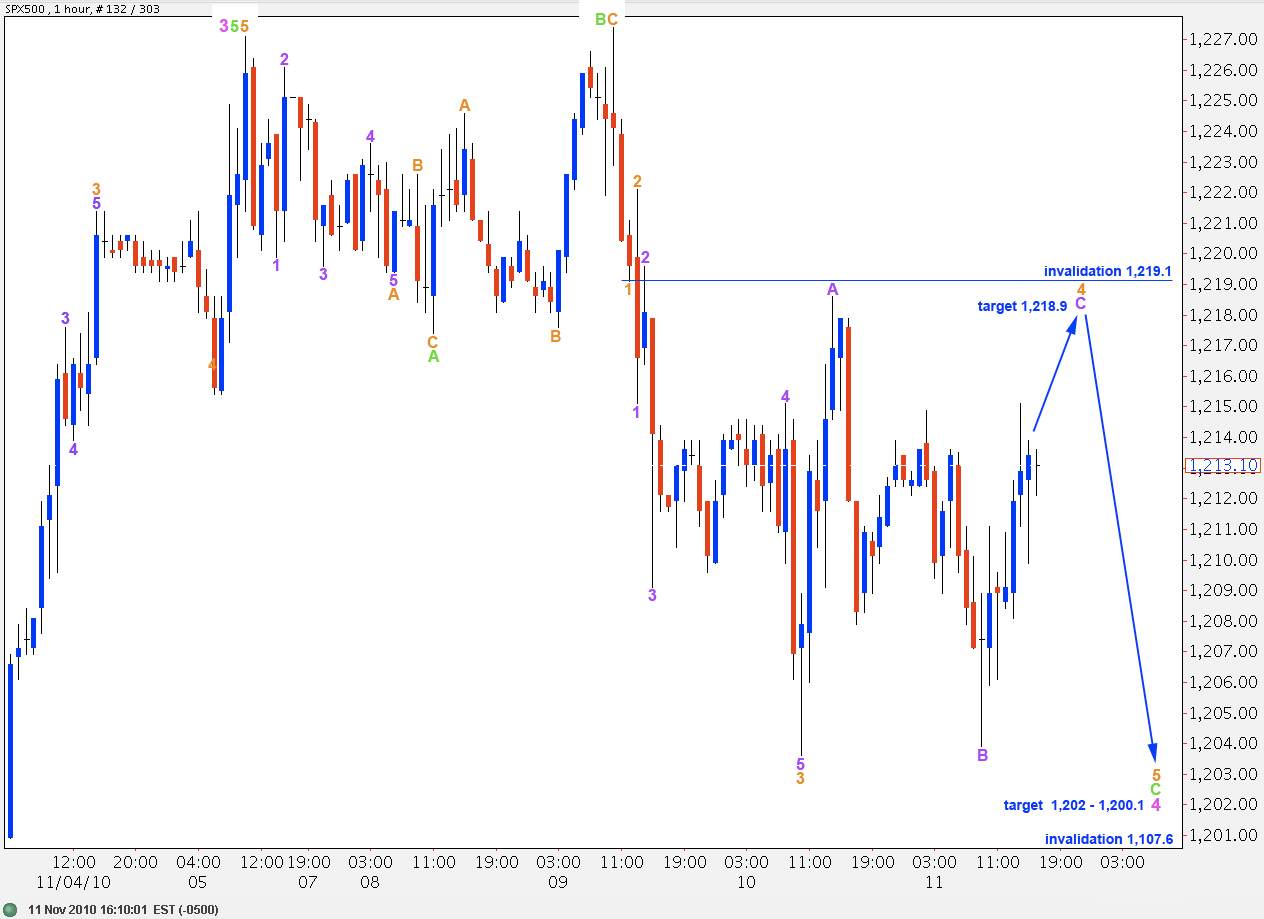
If upwards movement is above 1,218.6 invalidating the triangle then wave 4 orange may be a regular flat correction.
At 1,218.9 wave C purple will reach equality with wave A purple.
Wave 4 orange may not move into wave 1 orange price territory therefore upwards movement may not move above 1,219.1.
If this wave count is invalidated by upwards movement then either the end of wave 1 orange is labeled incorrectly, or wave C green and therefore the correction for wave 4 pink is over and the upwards trend has resumed.
Alternate Daily Wave Count.
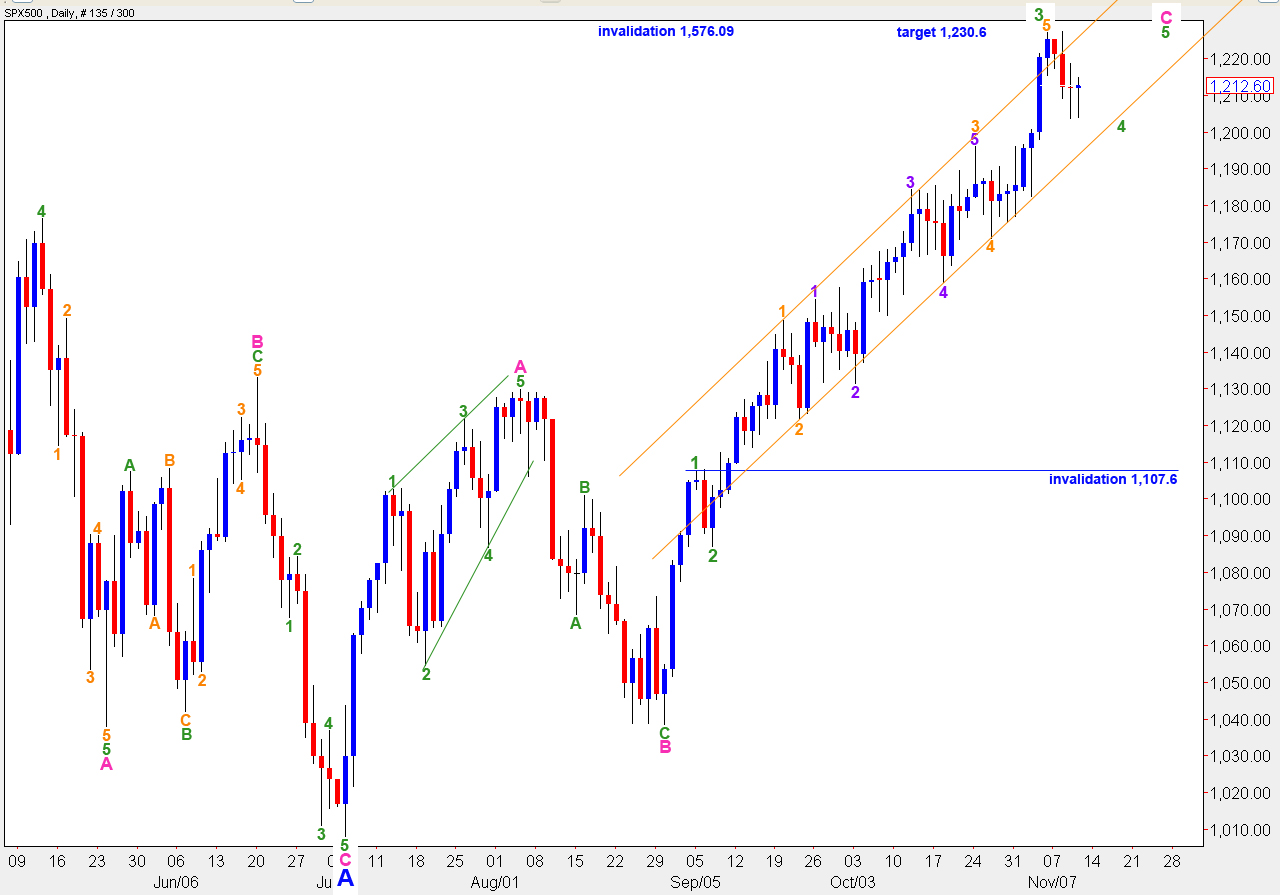
The short term outlook for this alternate daily wave count is exactly the same as the main wave count.
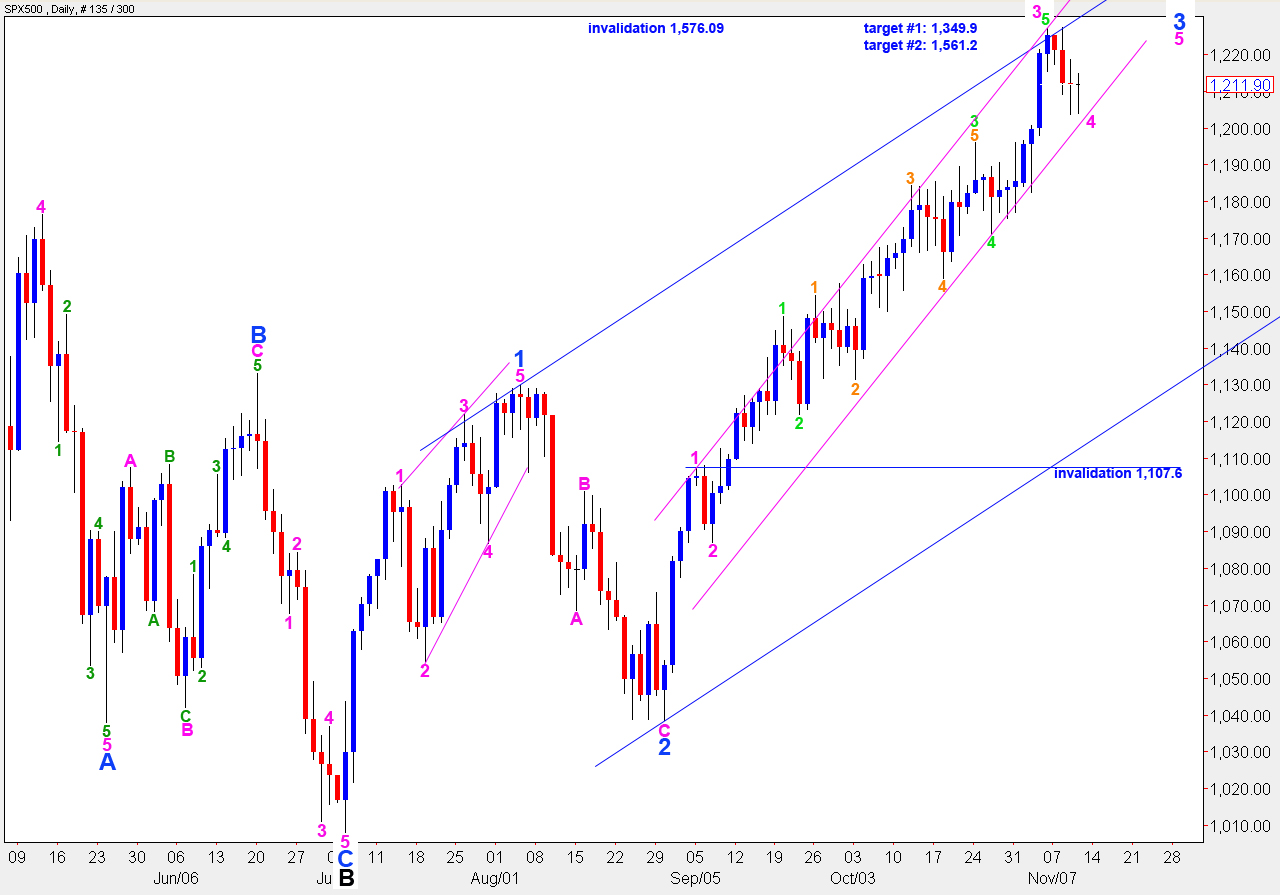
In the long term this wave count expects a C wave at minor (blue) degree to develop to the downside to complete an expanded flat correction for wave B black.
If price moves below 1,129.9 before we have a satisfactory five wave structure from the low at 1,008 (labeled here A blue) then this wave count will provide explanation and the most likely next direction.