Elliott Wave chart analysis for the SPX500 for 10th November, 2010. Please click on the charts below to enlarge.
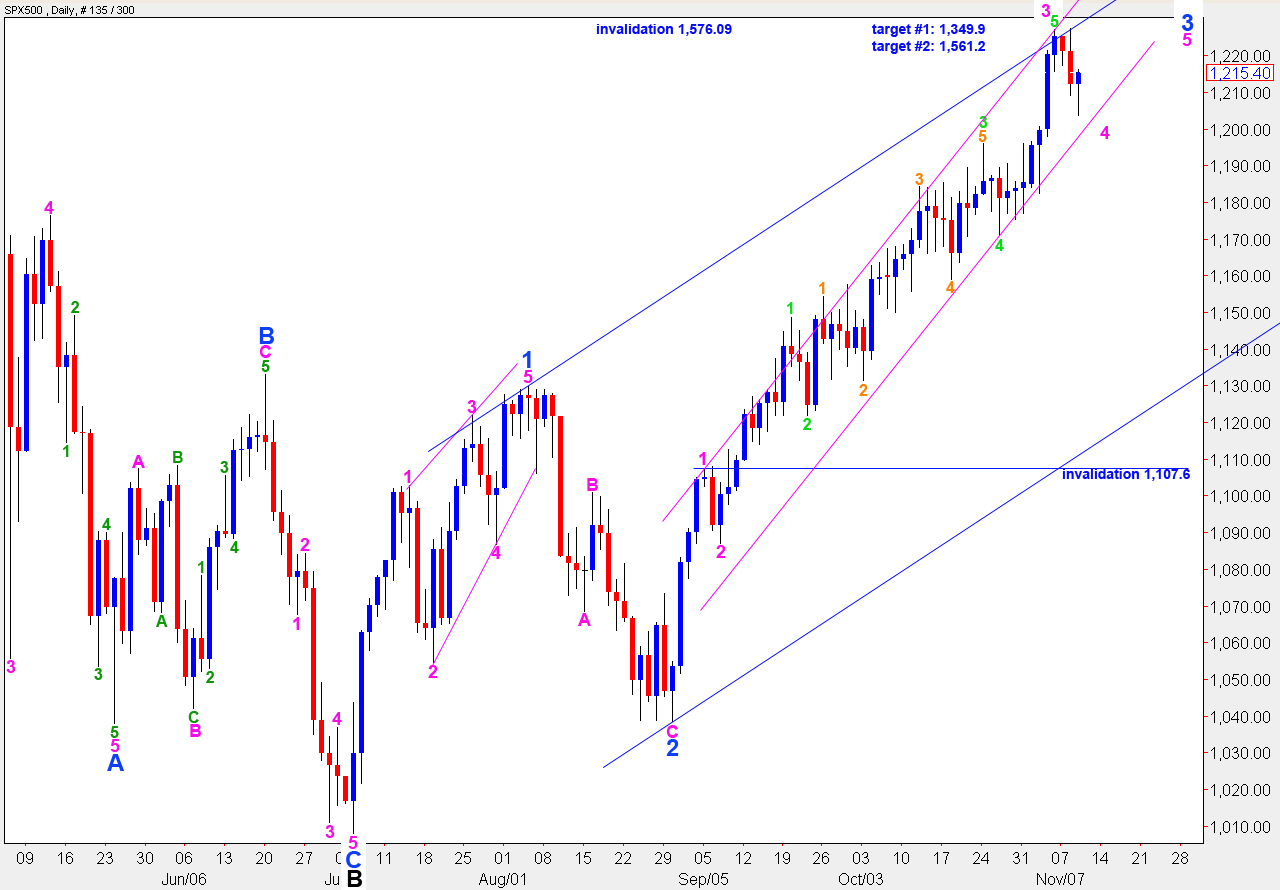
As expected the S&P has moved lower in a correction. This wave count has this correction as wave 4 pink (minute). It is also possible that it may develop further as wave 4 blue (minor).
If downwards movement continues outside the lower edge of the small parallel pink channel, drawn here around wave 3 blue, then we may expect that the correction is of minor degree and should continue for at least two weeks duration.
Targets for the daily chart are long term targets for the end to wave C black and an end to primary wave 2. At 1.3949 wave C black will reach 0.618 the length of wave A black. At 1.5162 wave C black will reach equality with wave A black, which is the most common relationship between the two and, therefore, a more likely upwards target.
Upwards movement for this C wave to end primary wave 2 may not move above 1,576.09 to a new high as wave 2 may not move beyond the start of wave 1.
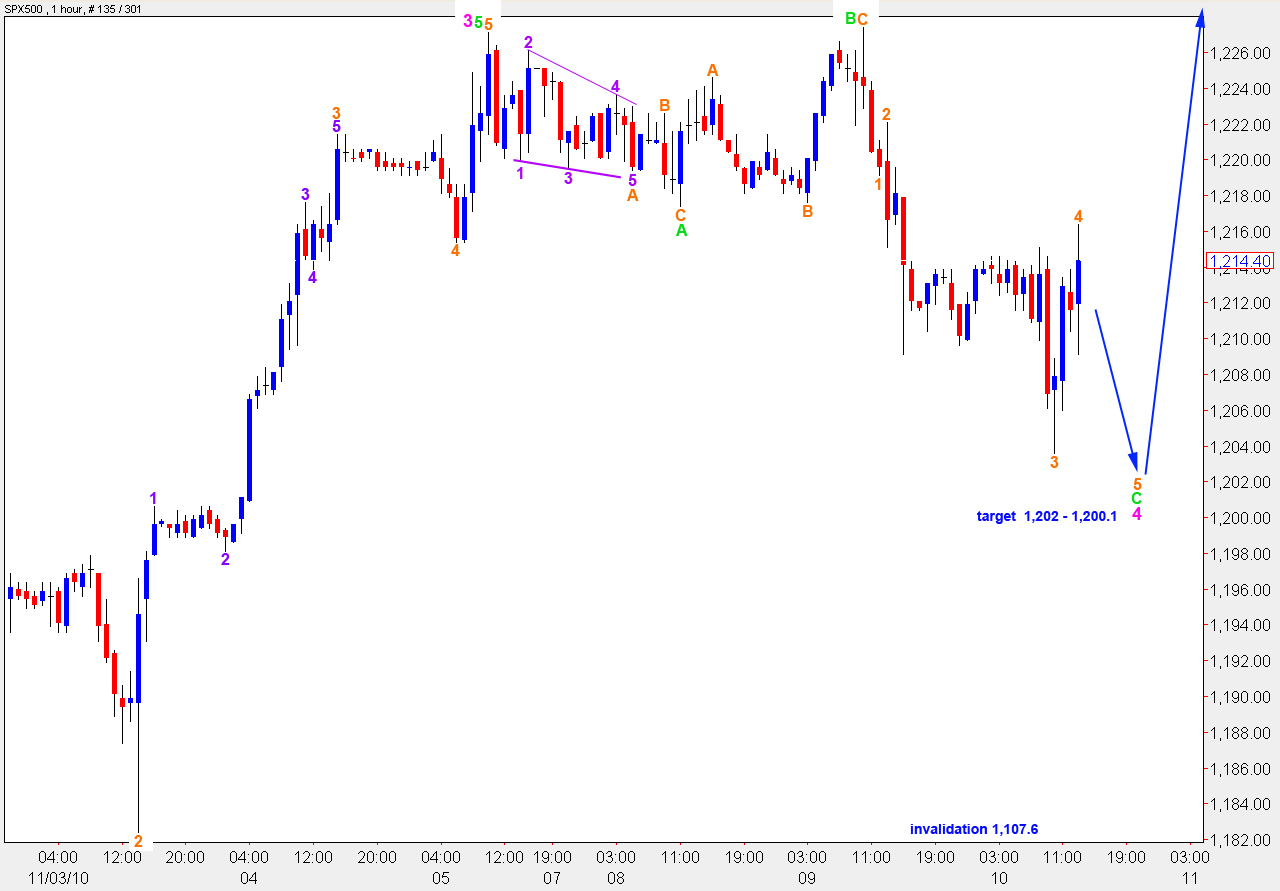
Our downside target of 1,202 was nearly met. However, wave C green is not yet a satisfactory five wave structure and requires further downwards movement to end it.
We can count five waves within wave C green down where 4 does not move into 1 price territory. However, this leaves wave 3 as the shortest which violates a core rule. Therefore, wave C green requires further downwards movement.
At 1,202 wave C green will reach 2.618 the length of wave A green. At 1,200.1 wave 5 orange within wave C green will reach equality with wave 3 orange. This is our small downside target.
If downwards movement ends about the target zone and the upwards trend resumes, then this wave a fourth wave correction at minute (pink) degree.
If, however, downwards movement continues in the next day or so then we may expect it is a fourth wave at minor (blue) degree.
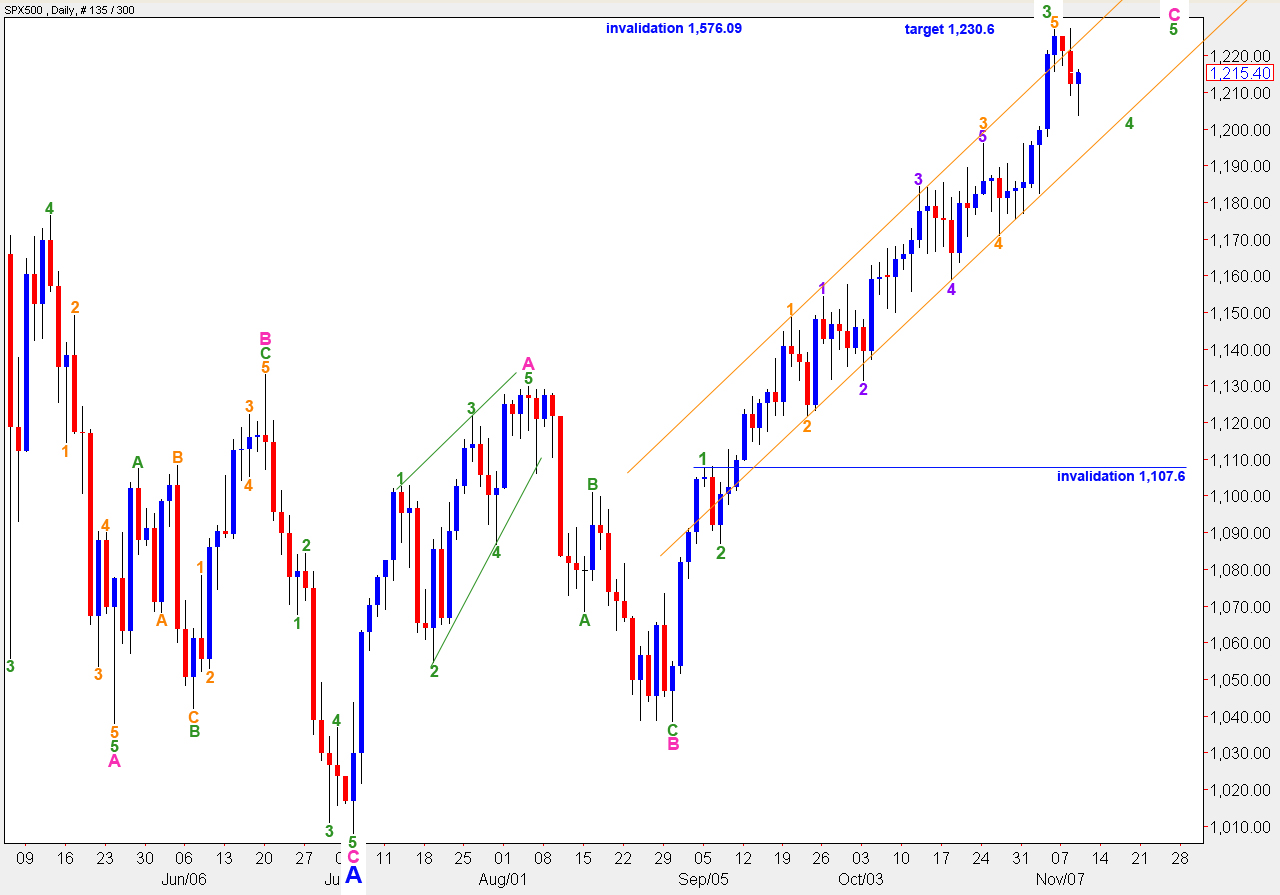
Alternate Wave Count.
The short term outlook for this wave count is the same as the main wave count. The downwards invalidation point is the same.
At 1,230.6 wave B blue will reach 105% the length of wave A blue which is the minimum requirement for an expanded flat correction. As this is the most common type of flat correction this upwards target is most likely for this wave count.
The upside invalidation point is the same as the main wave count: wave 2 black may not move beyond the start of wave 1 black at 1,576.09.


Thank you so much for your work.
It seems to me that the alternate is more likely when I hold the chart at arms length. Plus, with the Euro appearing to start a decline, it almost seems that a deeper correction down is “on the table”. But, I’m very curious to see. I can only guess.
Your recomendations for holding off until the move is confirmed with bars above/below the support lines is extremely valuable. I need to impound this into my head and WAIT! I’m now practicing this method with “play money” until I better get this down. One cant under estimate the value of patience.
Thanks so much,
John A