
Elliott Wave chart analysis for the SPX500 for 8th November, 2010. Please click on the charts below to enlarge.
The S&P has moved slowly downwards for the last session in a shallow correction, as expected.
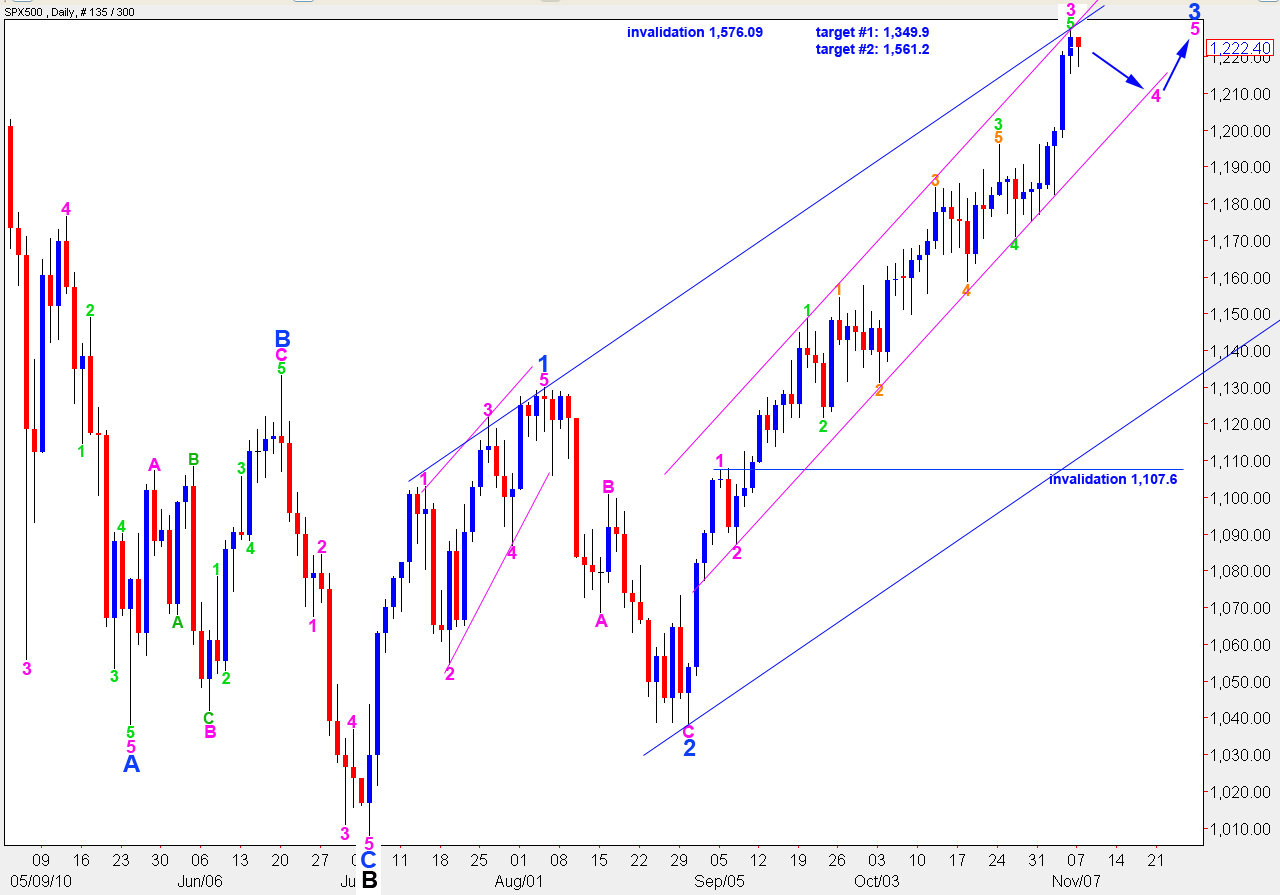
This fourth wave correction may end about the lower edge of the small pink parallel channel drawn here. This channel is a best fit.
When this correction is over we should see one more upwards thrust for a fifth wave to end minor wave 3. At that stage the S&P will be due for a larger correction which may last a couple of weeks or more but may not move below 1,129.9.
Upwards movement may not move above 1,576.09 as wave 2 at primary degree may not move beyond the start of wave 1.
At 1,349.88 wave C black will reach 0.618 the length of wave A black. At 1,561.2 wave C black will reach equality with wave A black; this is the most common relationship between the two.
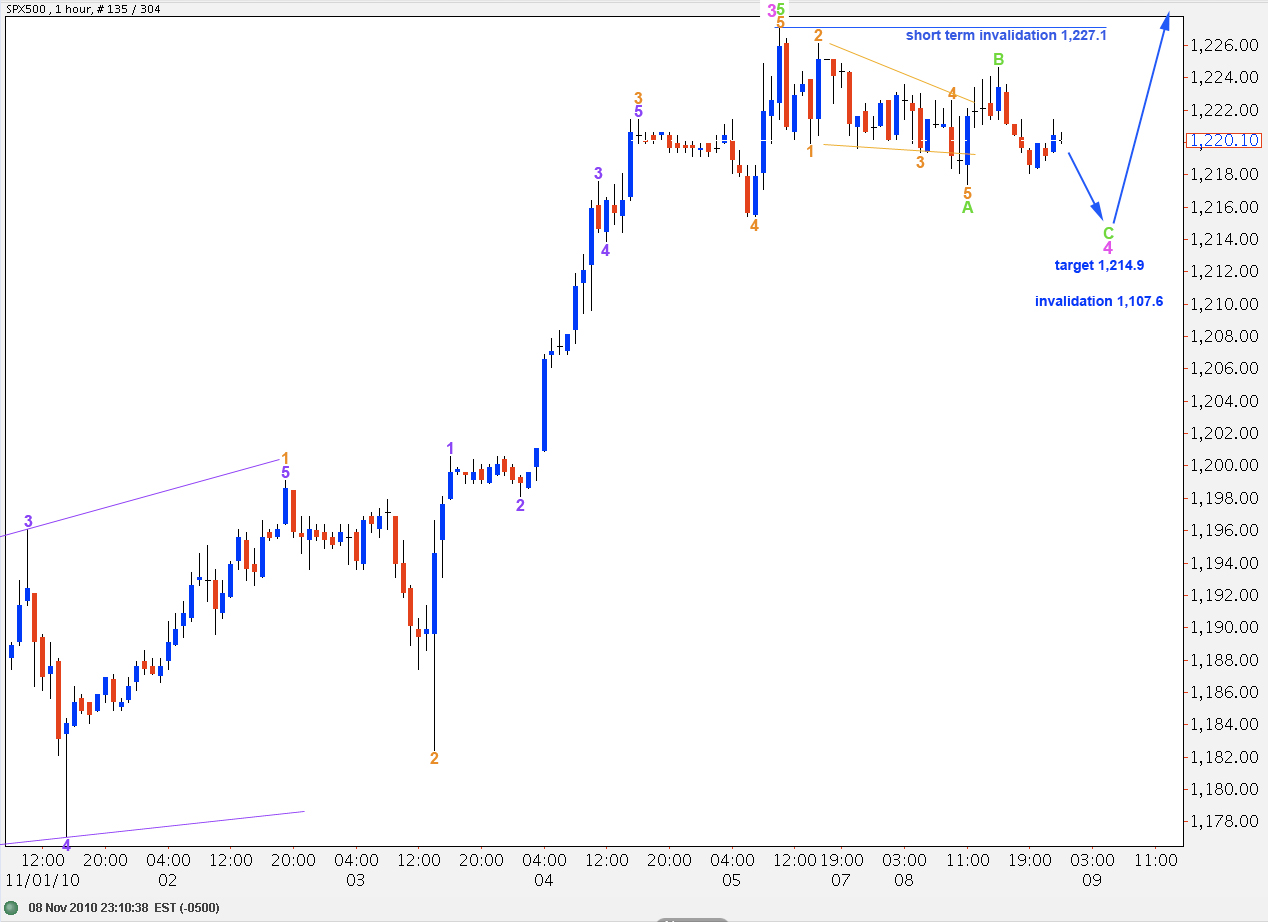
Monday’s sideways movement can be seen as a clear five wave leading contracting diagonal for wave A green of wave 4 pink.
If wave B green was over at 1,224.6 and does not extend higher then a target for wave C green to end is at equality with A at 1,214.9.
If wave B green extends higher it may not move beyond the start of wave A green above 1,227.1.
When wave 4 pink is over with a satisfactory three wave structure we should expect further upwards movement from the S&P. At 1,235.6 wave 3 blue will reach 1.618 the length of wave 1 blue; this is our mid term upside target at this stage. When we have a known end for wave 4 pink and the start of wave 5 pink this target may be refined.
Alternate Wave Count.
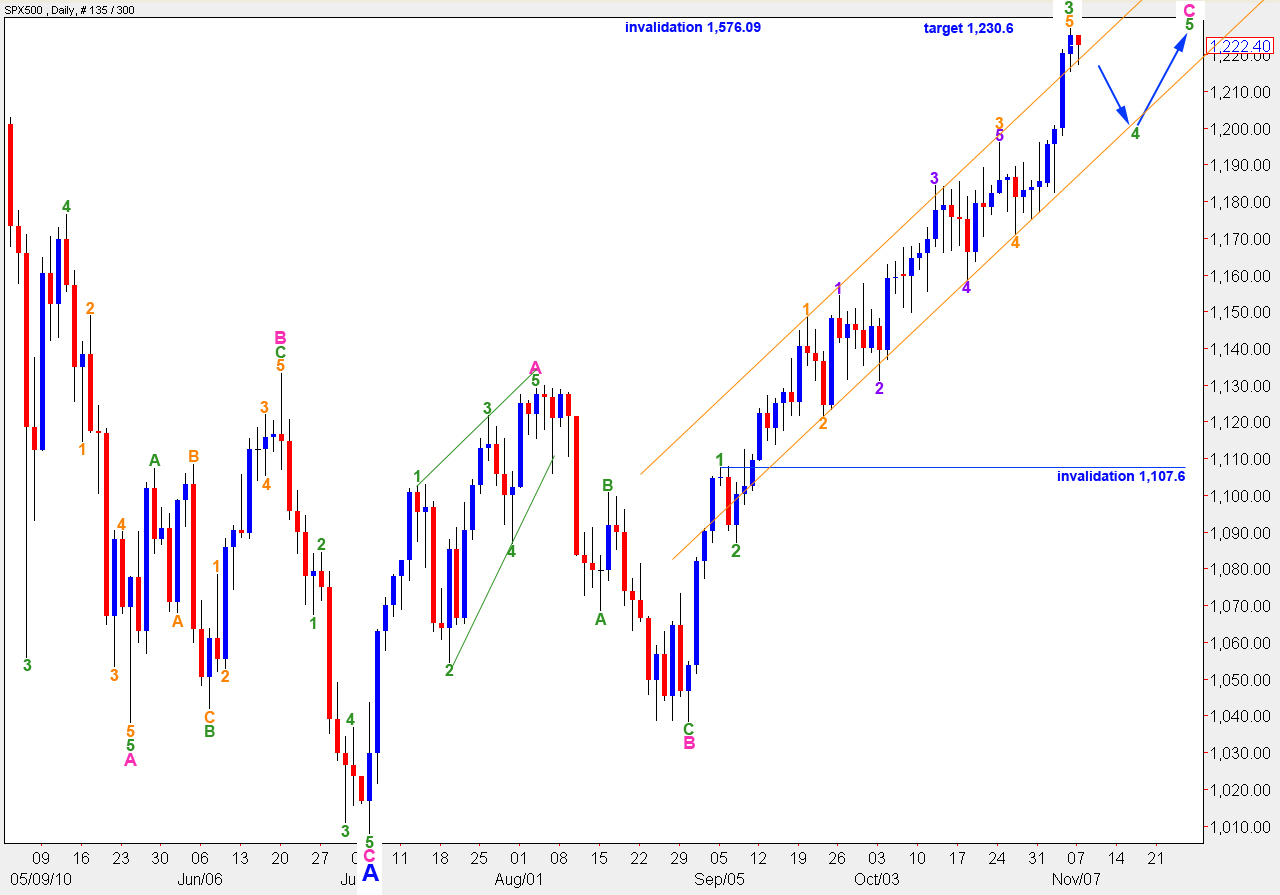
This wave count is still possible. However, it is not confirmed by MACD whereas the main wave count is. Divergence between the highs of A and C pink within wave B blue would support this wave count but this support is absent.
This wave count sees wave B at intermediate degree (black) sill unfolding as an expanded flat correction. The wave degrees for recent movement are all one degree lower than the main wave count, which is not as good a fit as the main count.
At 1,230.6 wave B blue will reach 105% the length of wave A blue. This is the minimum requirement for an expanded flat correction which is the most common type of flat. Therefore, this upwards minimum target is most likely to be met.
This wave count would be confirmed with movement below 1,129.9.