
Elliott Wave chart analysis for the SPX500 for 2nd November, 2010. Please click on the charts below to enlarge.
Main Wave Count
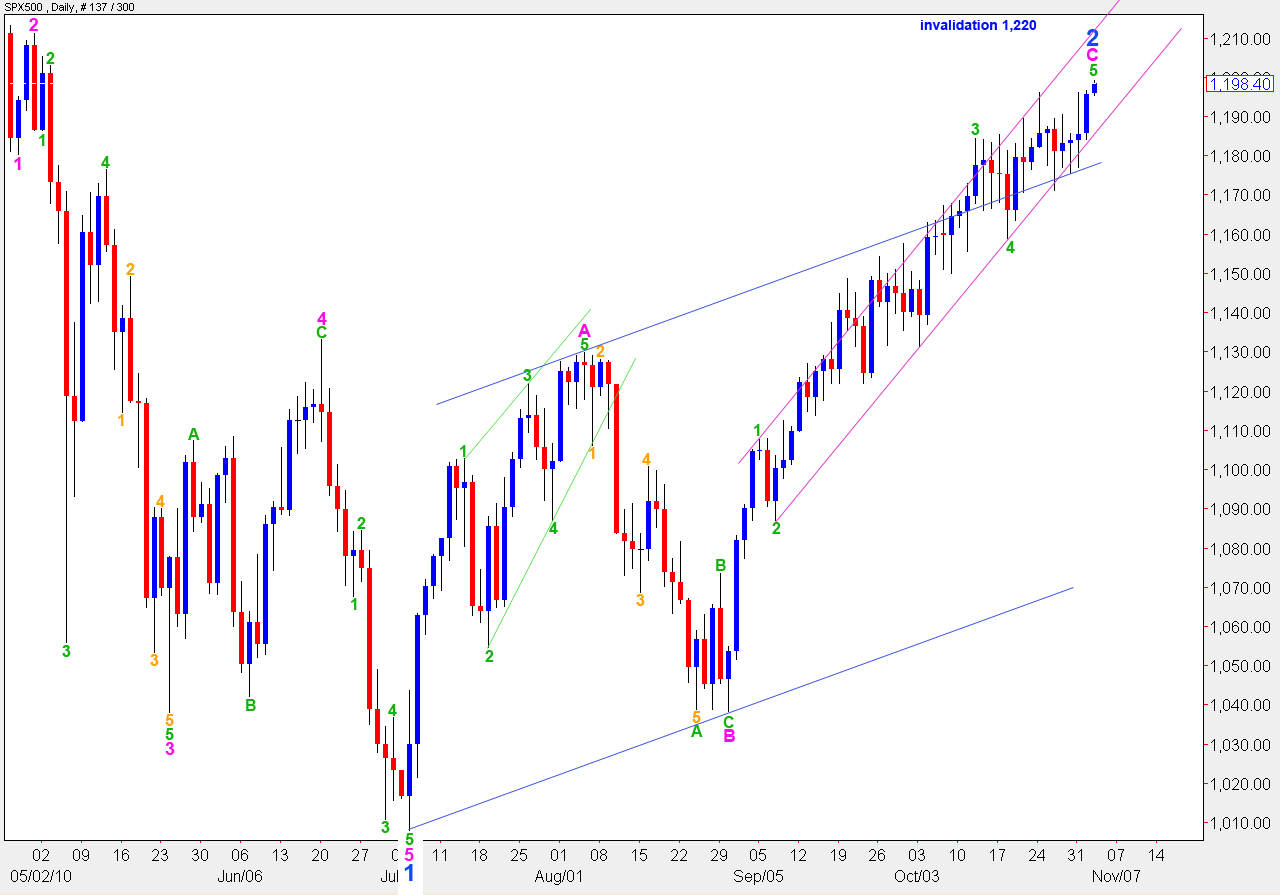
Upwards movement, which saw a high in place, invalidated the main wave count.
It is still possible that upwards movement was over at this new high of 1,199.1. We still need to see confirmation of a trend change, however, with a breach of the smaller pink parallel channel drawn here on the daily chart using Elliott’s technique. When we have a full candlestick outside the lower edge of the channel we may expect the trend has changed from up to down.
Wave 2 blue may not move beyond the start of wave 1 blue. Therefore, this wave count is invalidated with movement above 1,220.
This wave count does not have a good overall look for this fifth wave at green degree, but it is technically possible.
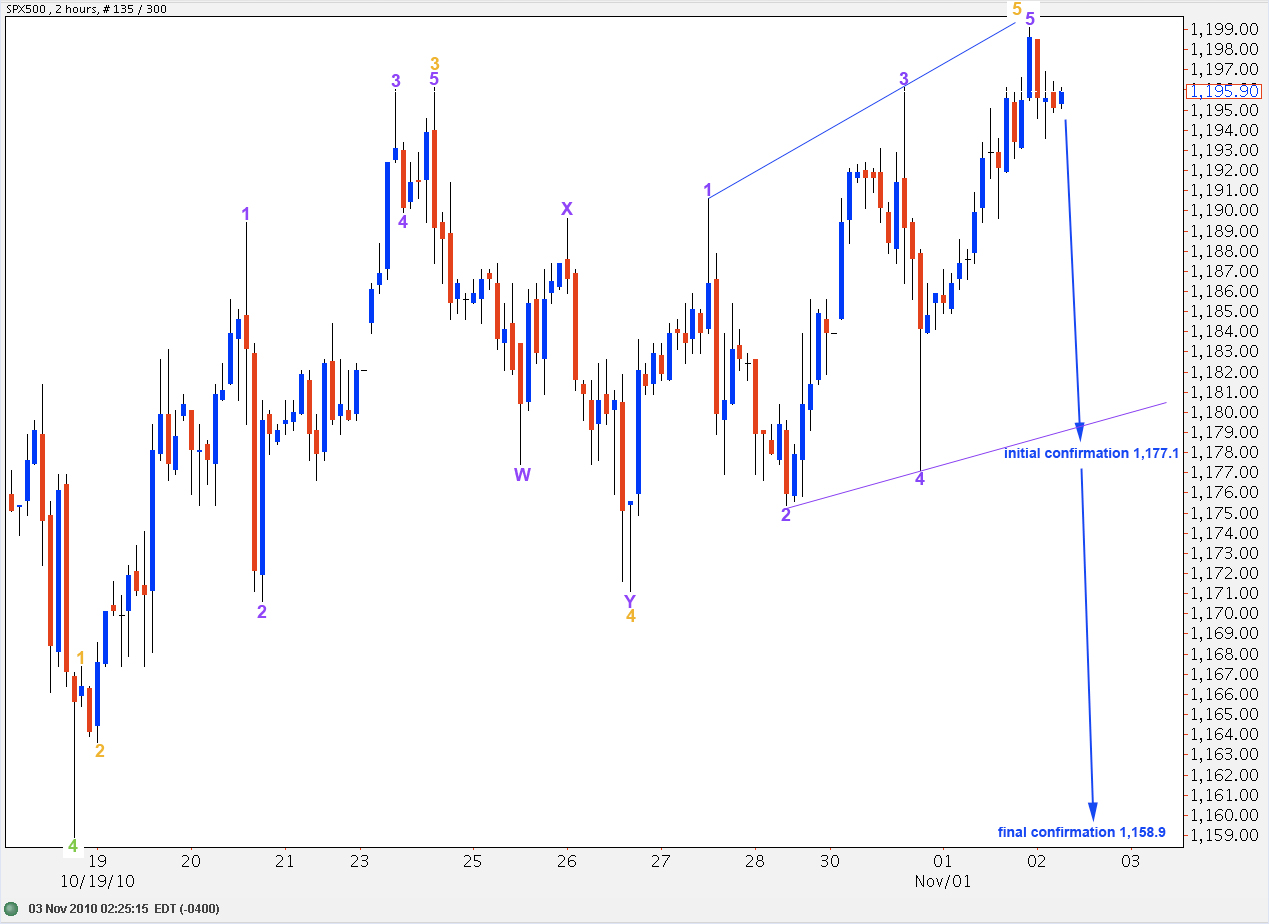
Wave 5 orange is an expanding ending diagonal which is most likely over. It has a corrective count of 11 on an hourly chart. Therefore, the zigzag may be complete.
We will have initial confirmation of this wave count if price moves below 1,177.1. We will only have final confirmation of a trend change with price movement below 1,158.9.
Alternate Wave Count
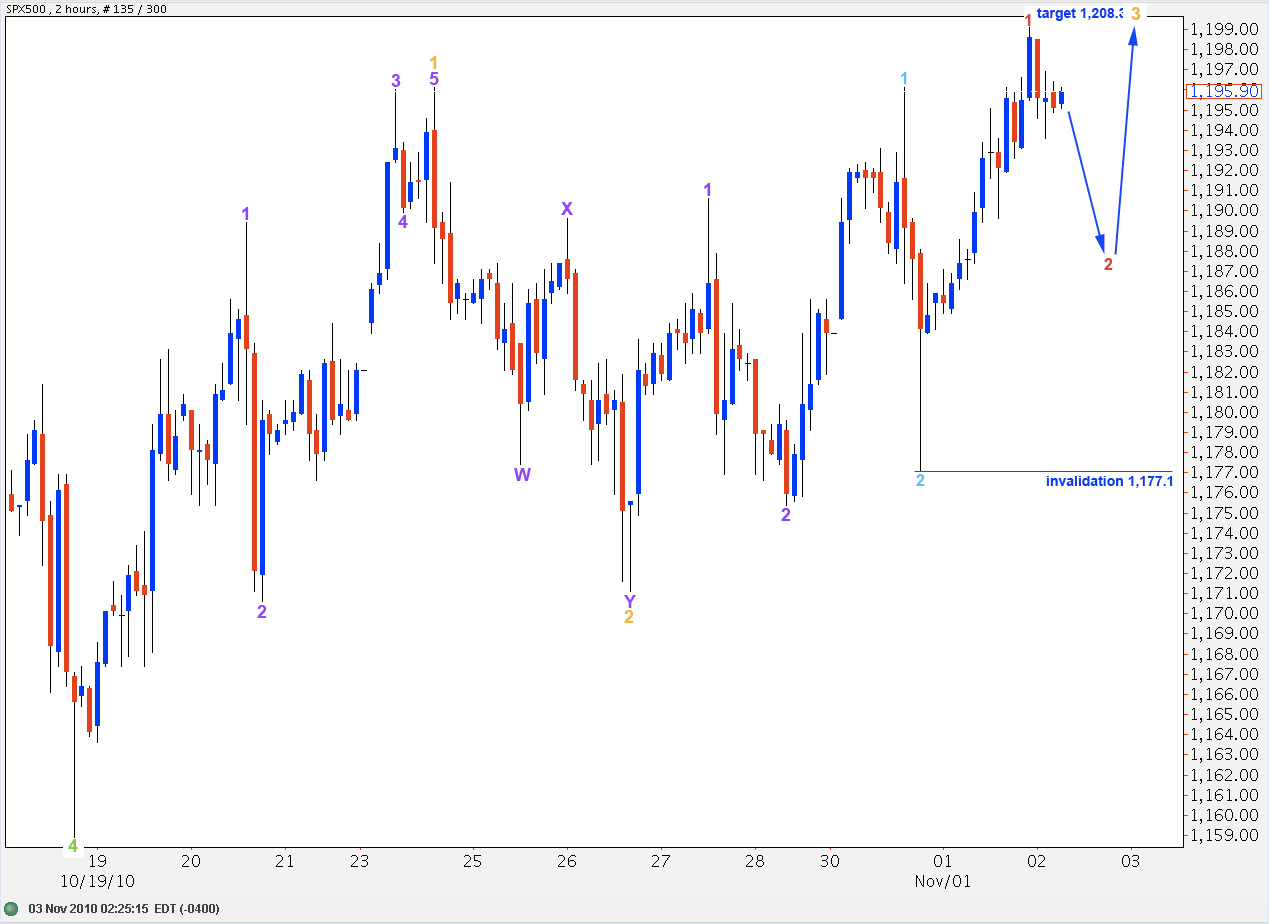
This wave count requires significant further upwards movement to complete it. If wave 4 orange is a very shallow correction then this wave count may be possible. However, it looks fairly unlikely.
Recent upwards movement for this wave count is labeled as a series of first and second waves. This wave count expects very strong upwards movement and with the upwards trend waning this seems unlikely.