Elliott Wave chart analysis for the SPX500 for 29th October, 2010. Please click on the charts below to enlarge.
Main Wave Count.
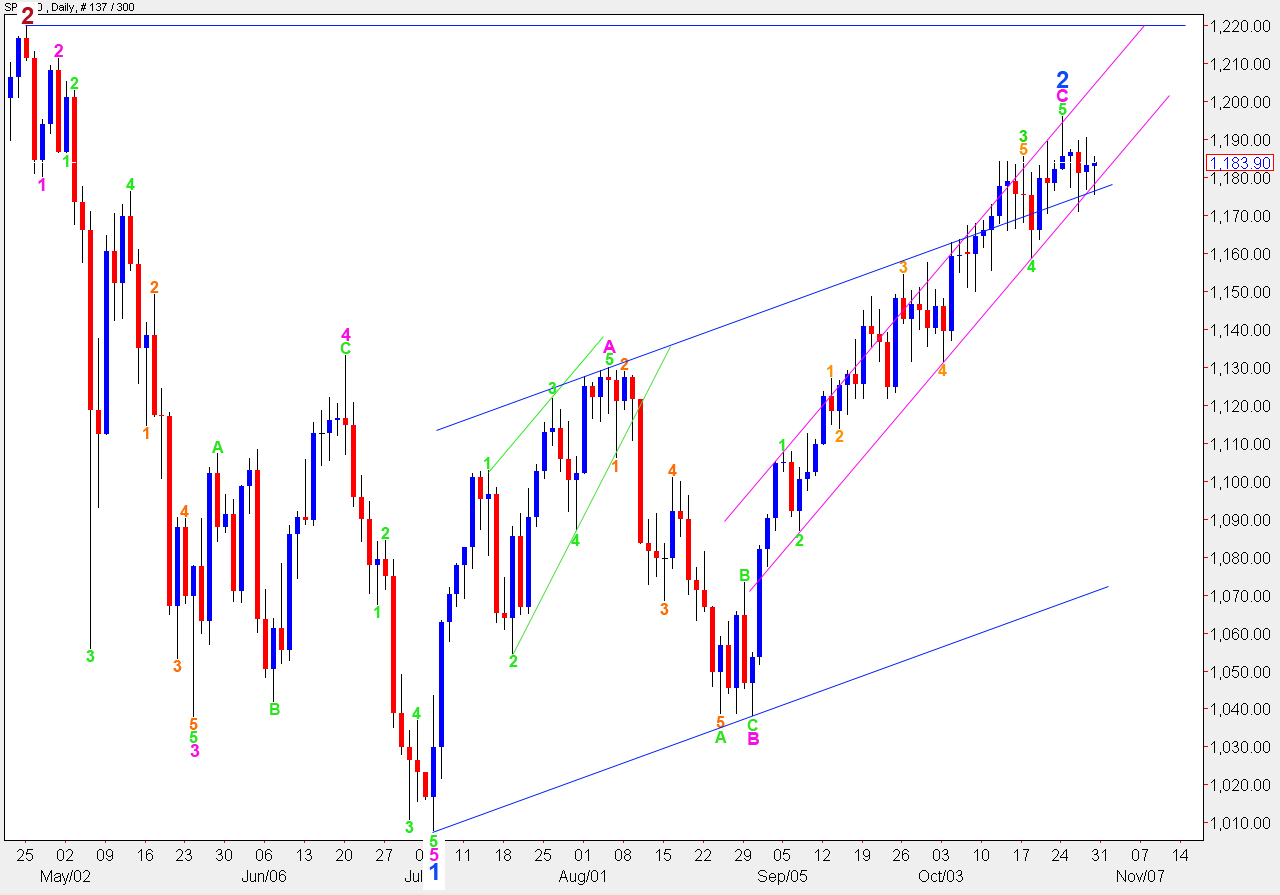
The S&P has moved mostly sideways all week and we do not have confirmation yet of a high in place.
I have redrawn the trend channel around wave C pink today to be more conservative. First draw a trend line from the low of 2 green to 4 green then place a parallel copy on the high of 1 green. This sees a slight overshoot for the end of wave 3 green and a very small overshoot for the end of wave 5 green.
When we can see a full candlestick closed and below the lower edge of this parallel channel then we shall have confirmation that the trend has changed from up to down.
Ratios within wave C pink are: wave 3 green is 13.7 points short of 1.618 the length of wave 1 green and wave 5 green is just 0.4 points short of 0.382 the length of wave 3 green.
Any further upwards movement cannot move above 1,220 as wave 2 blue cannot move beyond the start of wave 1 blue.
When the trend change is confirmed then it will be appropriate to calculate targets for the third wave to the downside. It is premature to do so today.
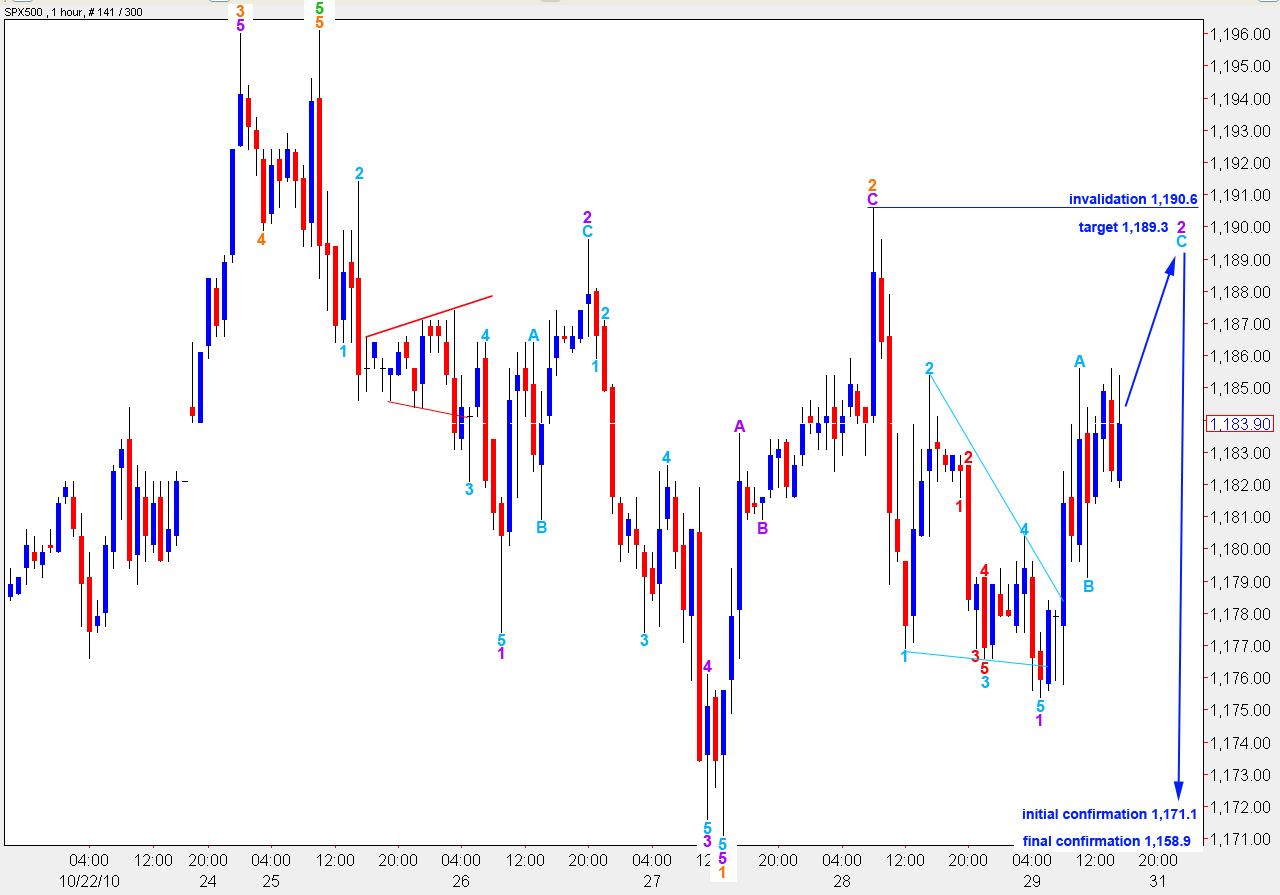
If we have a high in place then the subdivisions of downwards waves fit very well indeed.
Wave 1 purple to start wave 3 orange is a leading contracting diagonal. Wave 2 purple is a simple zigzag. Wave C aqua will reach equality with wave A aqua at 1,189.3.
Wave 2 purple cannot move above the start of wave 1 purple. Therefore, this wave count is invalidated with movement above 1,190.6.
Wave 3 orange must move beyond the end of wave 1 orange. Therefore, this wave count is confirmed with movement below 1,171.1.
When price moves below 1,158.9 then other (less likely) alternate wave counts which allow for more upwards movement will be invalidated. At this stage we may consider we have confirmation of a trend change.
Alternate Wave Count
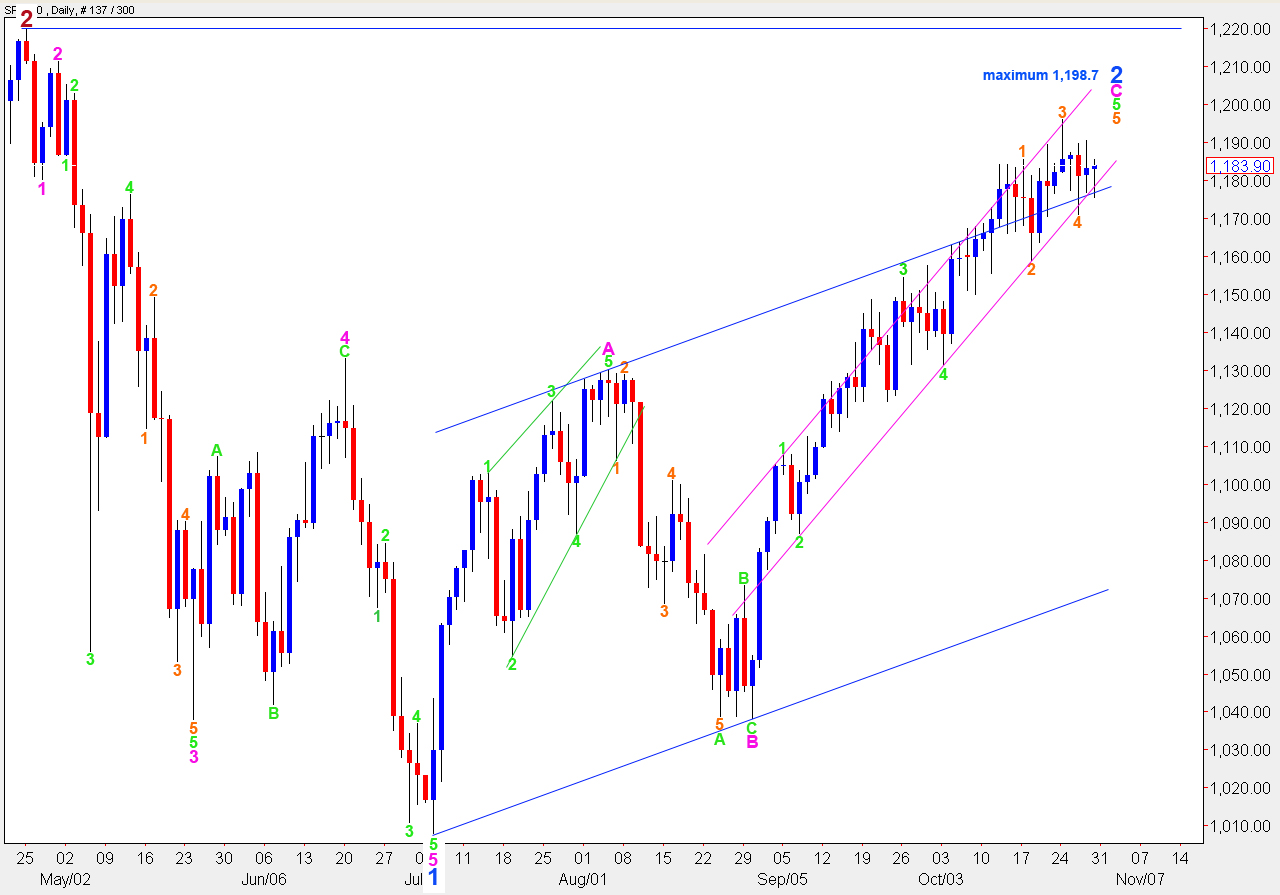
It is possible that the S&P is completing an ending contracting diagonal for wave 5 green.
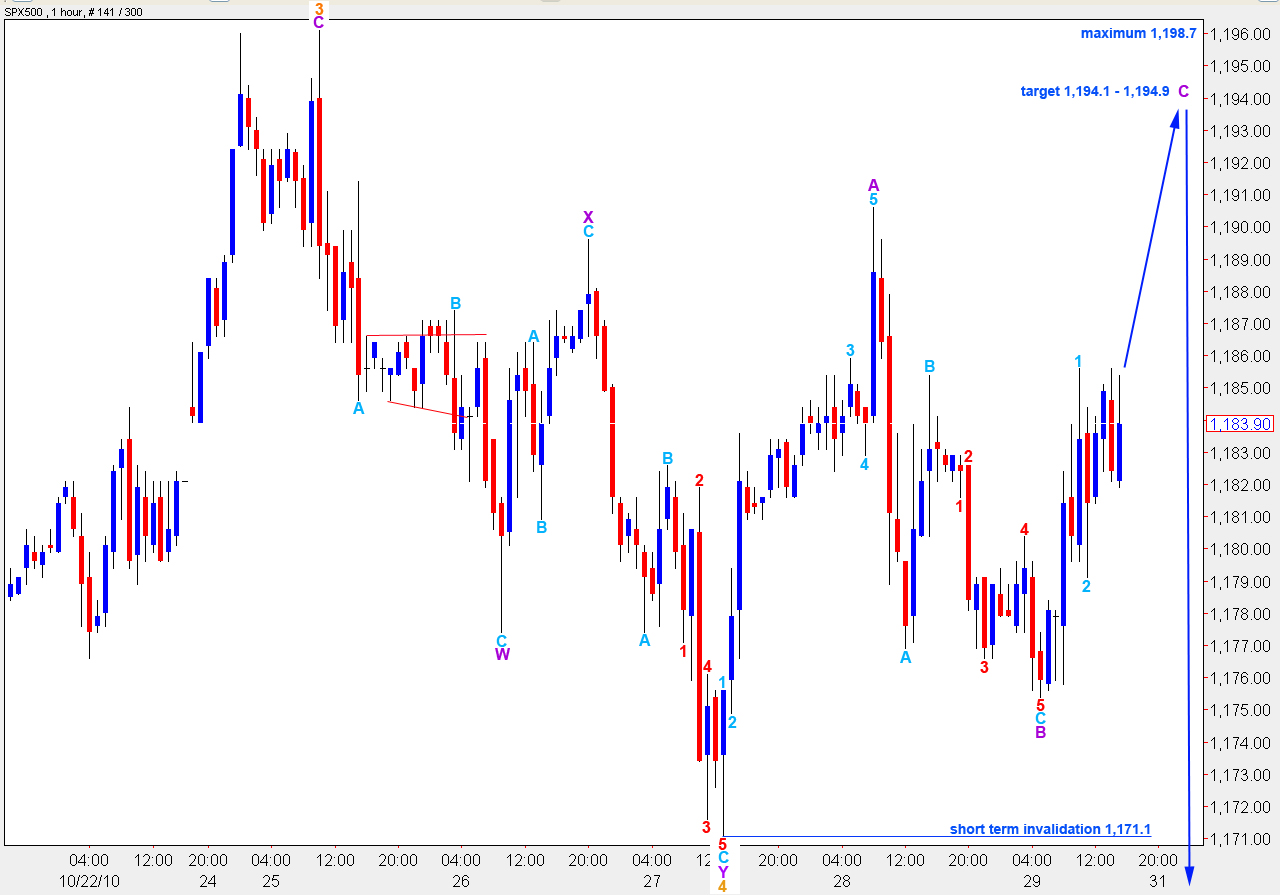
This wave count allows for higher highs. However, wave 3 green with this wave count is 1.9 points shorter than wave 1 green. Therefore, wave 5 green cannot be longer than wave 3 green as wave 3 cannot be the shortest. This allows for maximum upwards movement to 1,198.7.
The subdivisions do not work quite as well for this wave count; it seems a little forced. However, it is technically possible.
If this wave count is correct we are most likely to see upwards movement from the S&P to begin next week’s trading.
At 1,194.1 wave 5 purple will reach 0.618 the length of wave 3 purple. This would see wave 5 purple truncated.


