
Elliott Wave chart analysis for the SPX500 for 25th October, 2010. Please click on the charts below to enlarge.
Again, we have two wave counts. Although I like less the subdivisions for recent movement on the 15 minute chart, for the alternate wave count, the Dow has most likely just seen a high in place (unless it is about to invalidate its wave count at primary degree) so it is also likely that the S&P has also.
Main Wave Count.
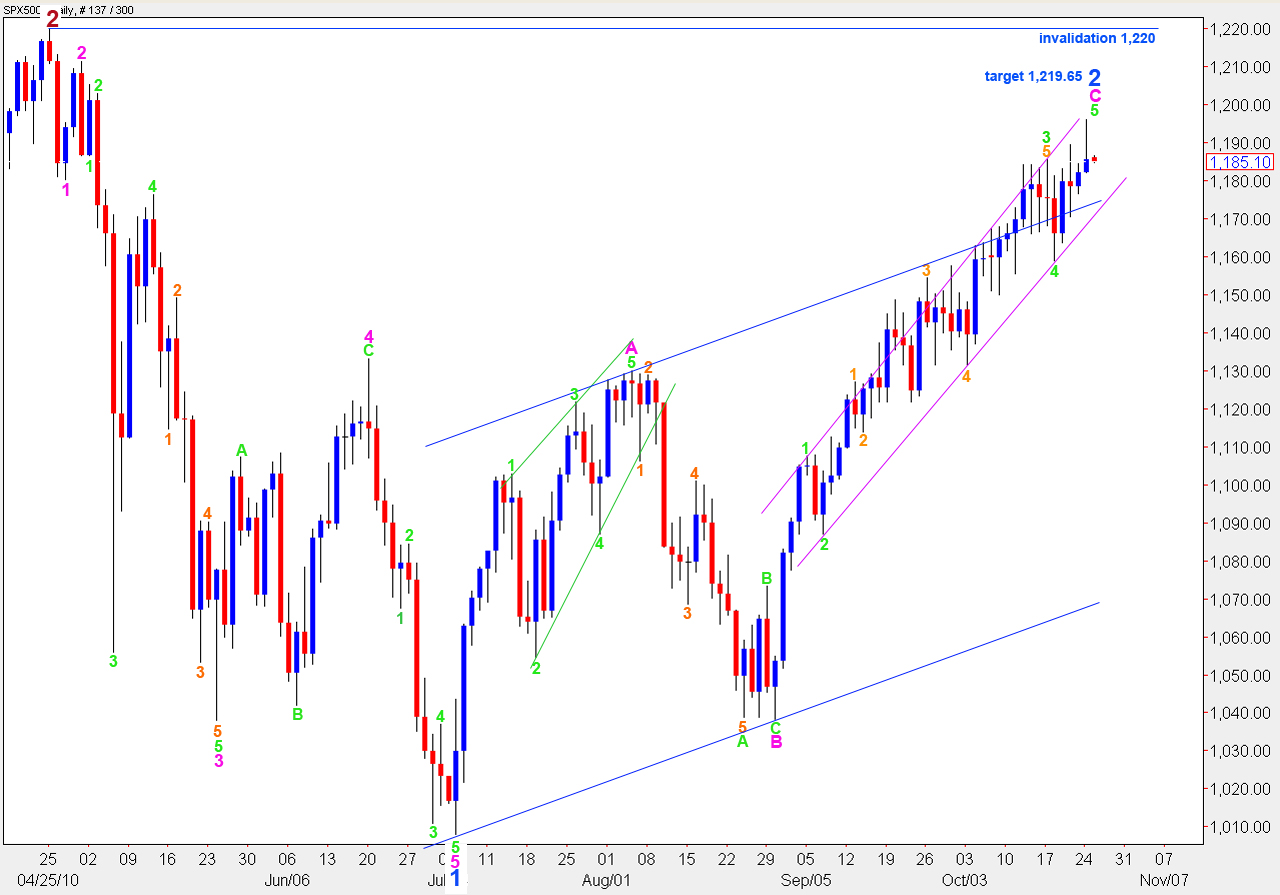
The main wave count expected upwards movement. We have not reached targets yet and this structure still needs further upwards to go to complete it.
At 1,219.65 green wave 5 will reach 0.382 the length of green wave 3.
We should not see price movement above 1,220 as blue wave 2 cannot move beyond the start of blue wave 1. If this invalidation point is breached then upwards movement may be seen as a continuation of primary wave 2. That would, therefore, see downwards movement labeled 1 blue as a B wave and wave 2 blue would be wave C, which would most likely require another 2 waves to complete it. It seems extremely unlikely that the strong downwards volatile movement labeled 1 blue is a B wave. Such an alternate wave count is not supported by wave behaviour.
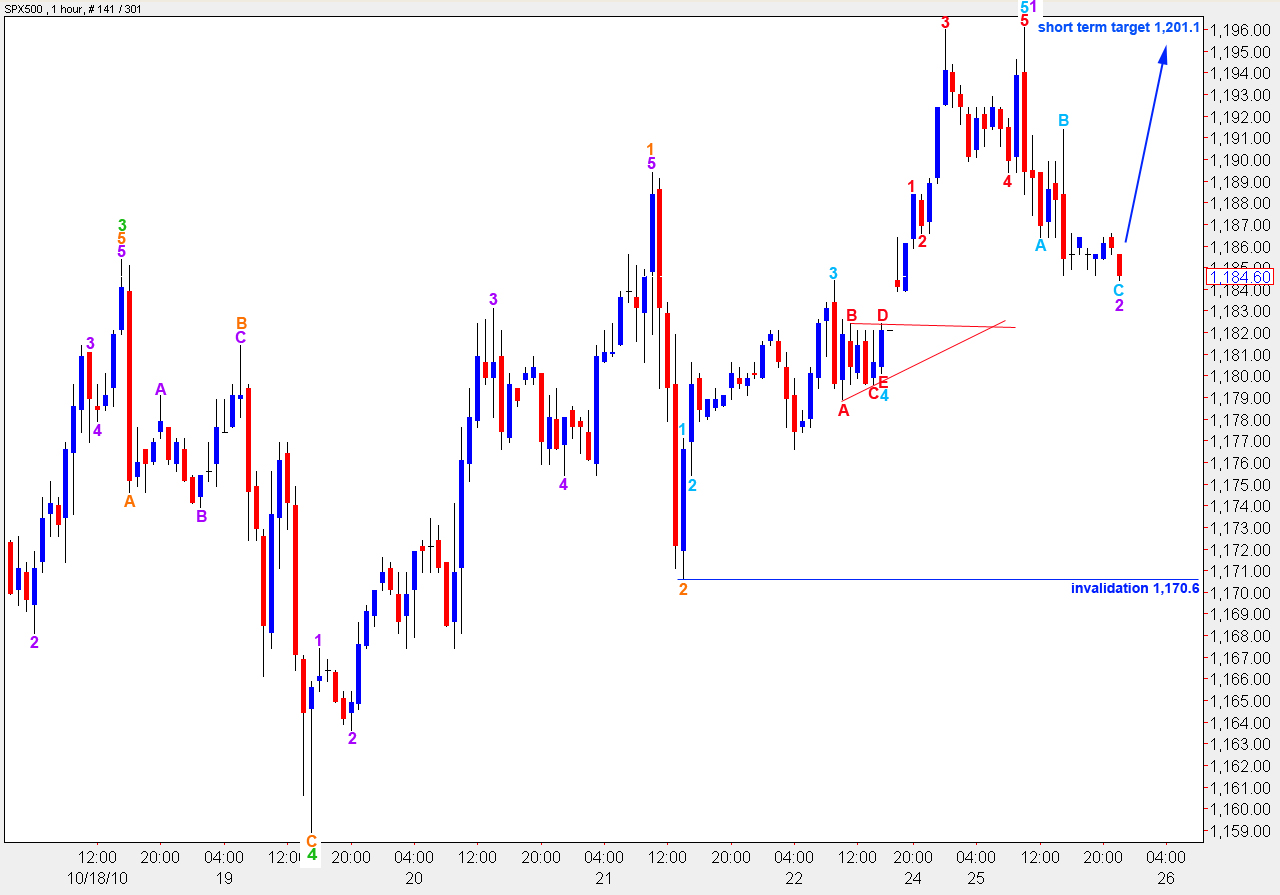
Monday’s session saw a new high. Upwards movement can be nicely subdivided into a complete impulse.
Ratios within wave 1 purple are: wave 3 aqua is just 2 points longer than equality with wave 1 aqua and wave 5 aqua is 2.3 points short of 2.618 the length of wave 1 aqua.
Ratios within wave 5 aqua are: wave 3 red is 1.1 point longer than equality with wave 1 red and wave 5 red is just 1 point longer than 0.618 the length of wave 3 red.
Ratios within wave 2 purple are: wave C aqua is 1 point short of 0.618 the length of wave A aqua.
Any further extension of wave 2 purple cannot move below 1,170.6 as wave 2 cannot move beyond the start of wave 1.
This wave count will be confirmed with a new high above 1,196.1 as wave 3 purple must move beyond the end of wave 1 purple.
At 1,201 wave 3 orange will reach equality with wave 1 orange. Thereafter, a fourth wave down must unfold which cannot move below 1,189.4 as wave 4 orange cannot move into wave 1 orange price territory.
Thereafter, a final fifth wave up to the target on the daily chart at 1,219.65 should end upwards movement.
If we see movement below 1,170.6 then we should use the alternate chart presented below.
Alternate Wave Count.
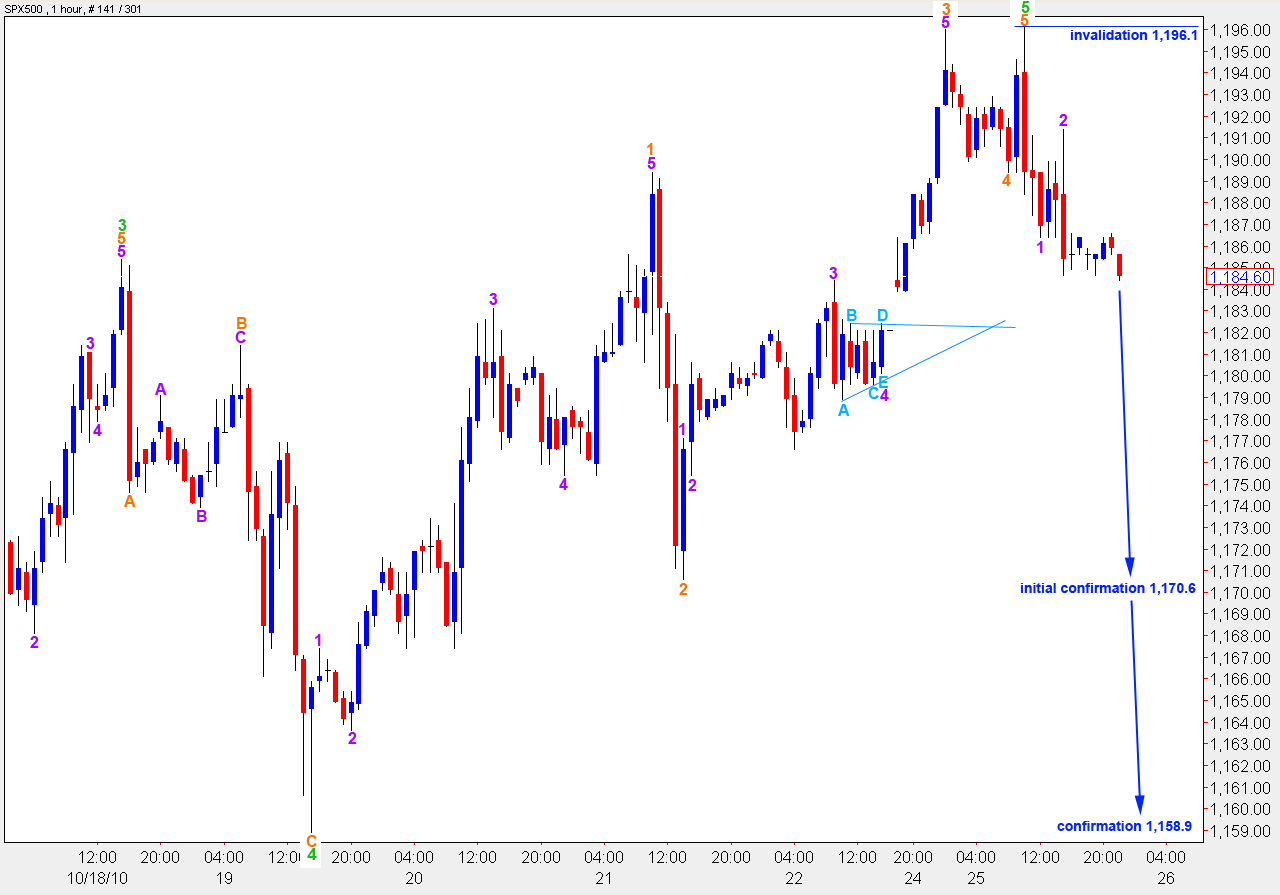
Because the downwards movement labeled here 4 orange touches the high of wave 1 orange, this may have been the fourth wave. However, the subdivisions within wave 5 purple when viewed on a 15 minute chart are not as satisfactory as the main wave count.
If we see movement above 1,196.1 this wave count is immediately invalidated. We should then expect further upwards movement towards our targets.
If price moves below 1,170.6 then this wave count will look more likely. However, to confirm a trend change we will still need to see a full candlestick closed and outside the lower edge of the pink parallel trend channel drawn on the daily chart.