
Elliott Wave chart analysis for the SPX500 for 21st October, 2010. Please click on the charts below to enlarge.
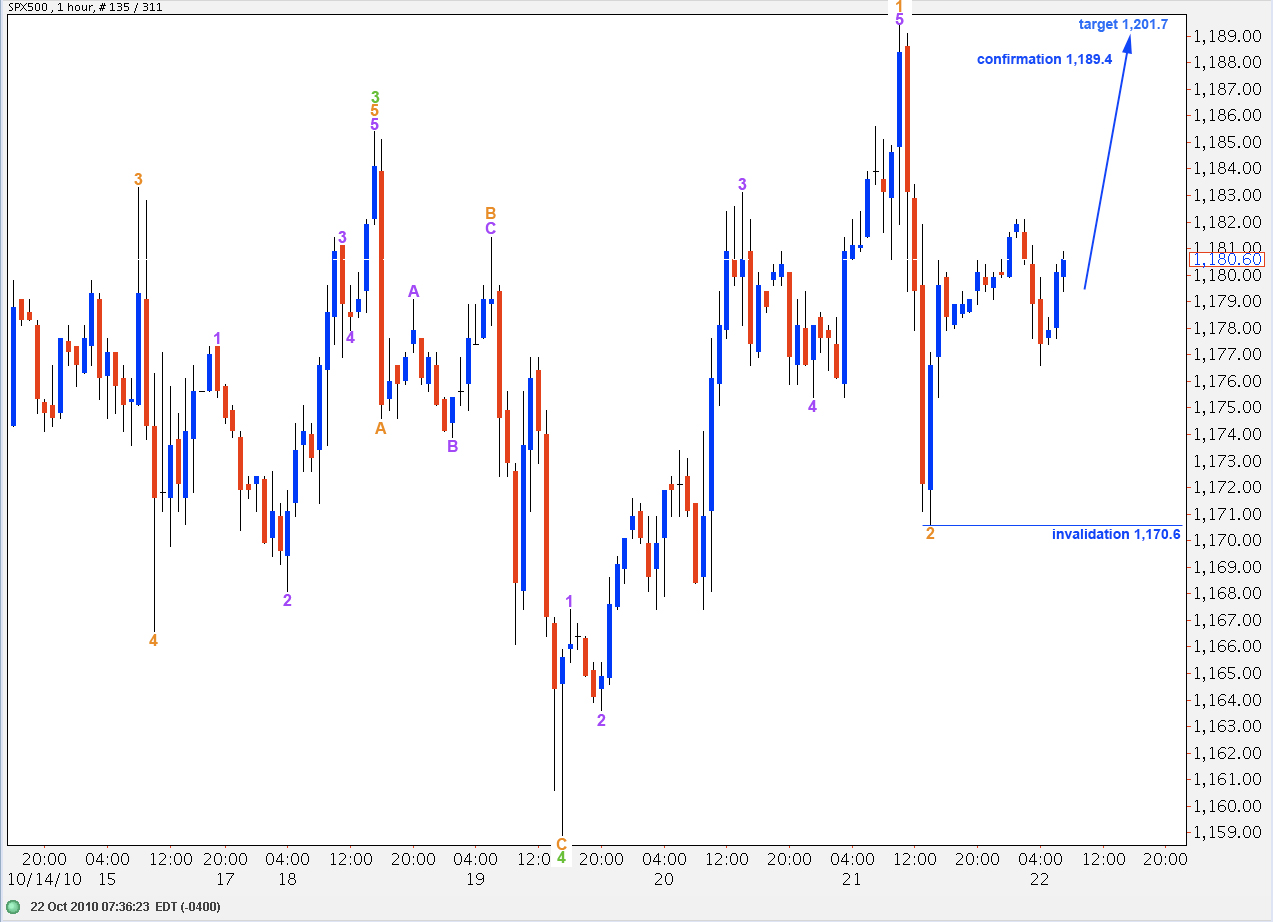
I have two wave counts again for you today. We should use confirmation and invalidation points to work with these today. I expect the S&P is still in an upwards trend because the strong fall from the last high at 1,189.4 has a strong corrective wave count on a 15 minute chart. Therefore, no matter what wave count I have, the upwards movement remains impulsive and downwards movement is corrective. Therefore, we should see new highs.
Main Wave count
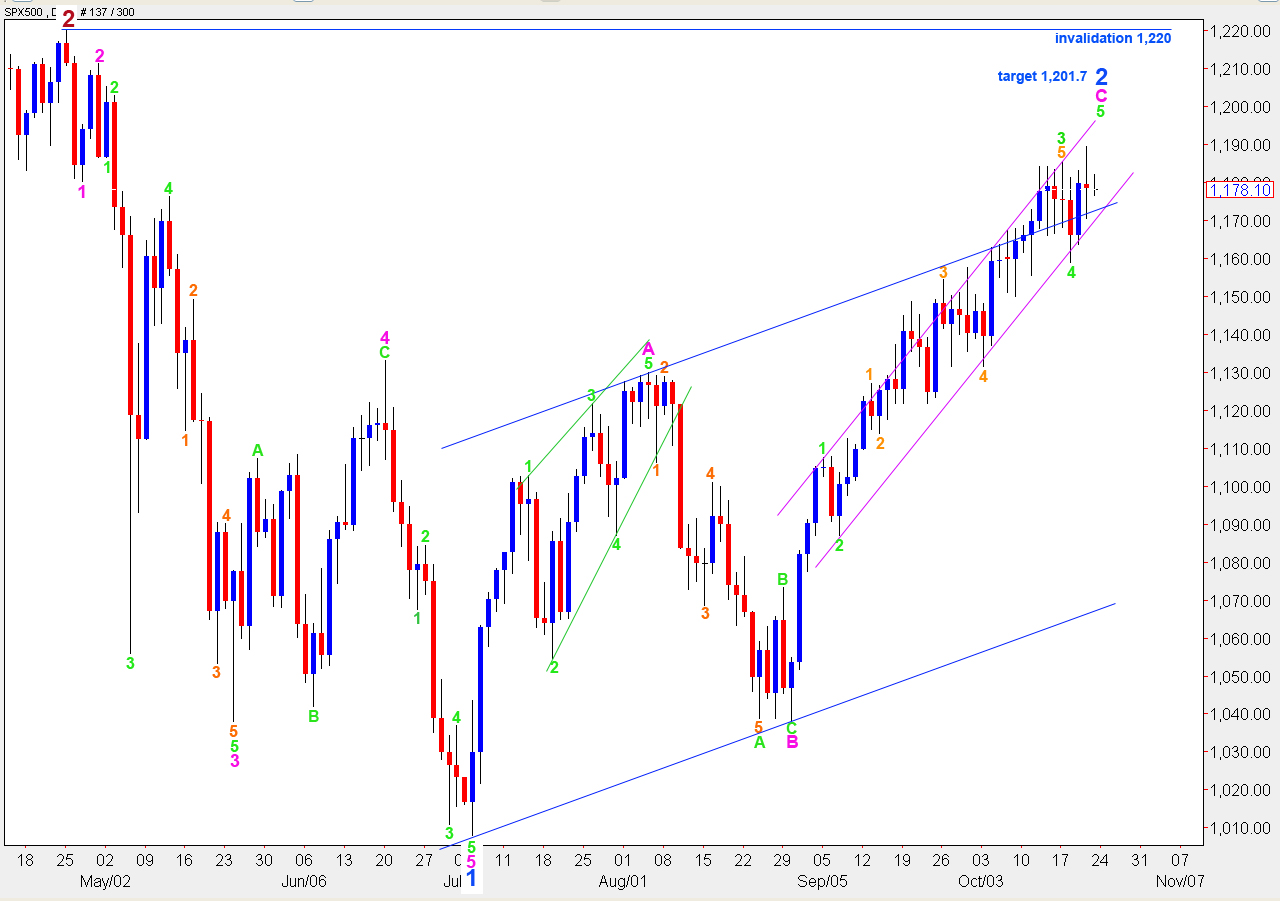
We may move green waves 3 and 4 up higher and see that we can then have a wave count which requires further upwards movement.
This wave count, however, does not have good fibonacci ratios. Ratios within wave C pink are: green 3 is 13.7 points short of 1.618 the length of green wave 1.
If green wave 5 reaches 0.618 the length of green wave 1 price will reach up to 1,201.7.
Ratios within green wave 3 are: orange wave 3 is just 0.5 points longer than equality with wave 1 and orange wave 5 has no fibonacci ratio to either 1 or 3.
Upwards movement cannot move above 1,220 as blue wave 2 cannot move beyond the start of blue wave 1.
Ratios within wave 1 orange are: wave 3 purple is just 2.75 points short of 2.618 the length of purple wave 1 and purple wave 5 is just 0.25 points short of 1.618 the length of purple wave 1.
Downwards movement for wave 2 orange on a 15 minute chart has a strong corrective wave count; it is a zigzag. For this reason I have labeled the last high orange wave 1 rather than the end of upwards movement with a green 5 label. We should expect further upwards movement.
If this wave count is correct price should not move below 1,170.6 as any second wave correction within the next upwards wave cannot move beyond the start of the first.
The target is the same as calculated for the daily chart to end upwards movement.
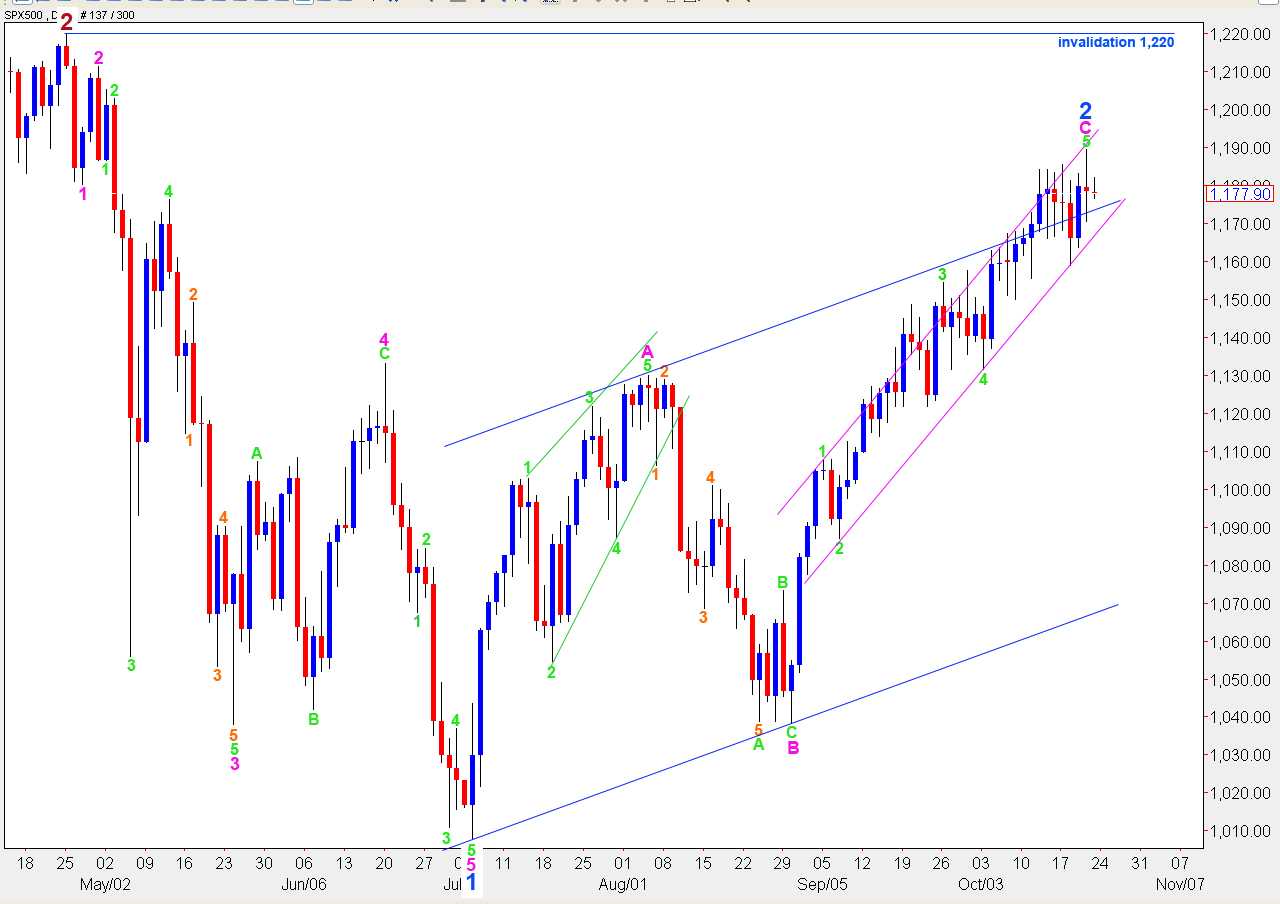
Alternate Wave count
This wave count follows on from the one we have been using for some time. It has a maximum upwards limit of 1,198.7 as wave 3 green cannot be the shortest.
This wave count sees upwards movement as most likely over here because green wave 5 now has a complete structure.
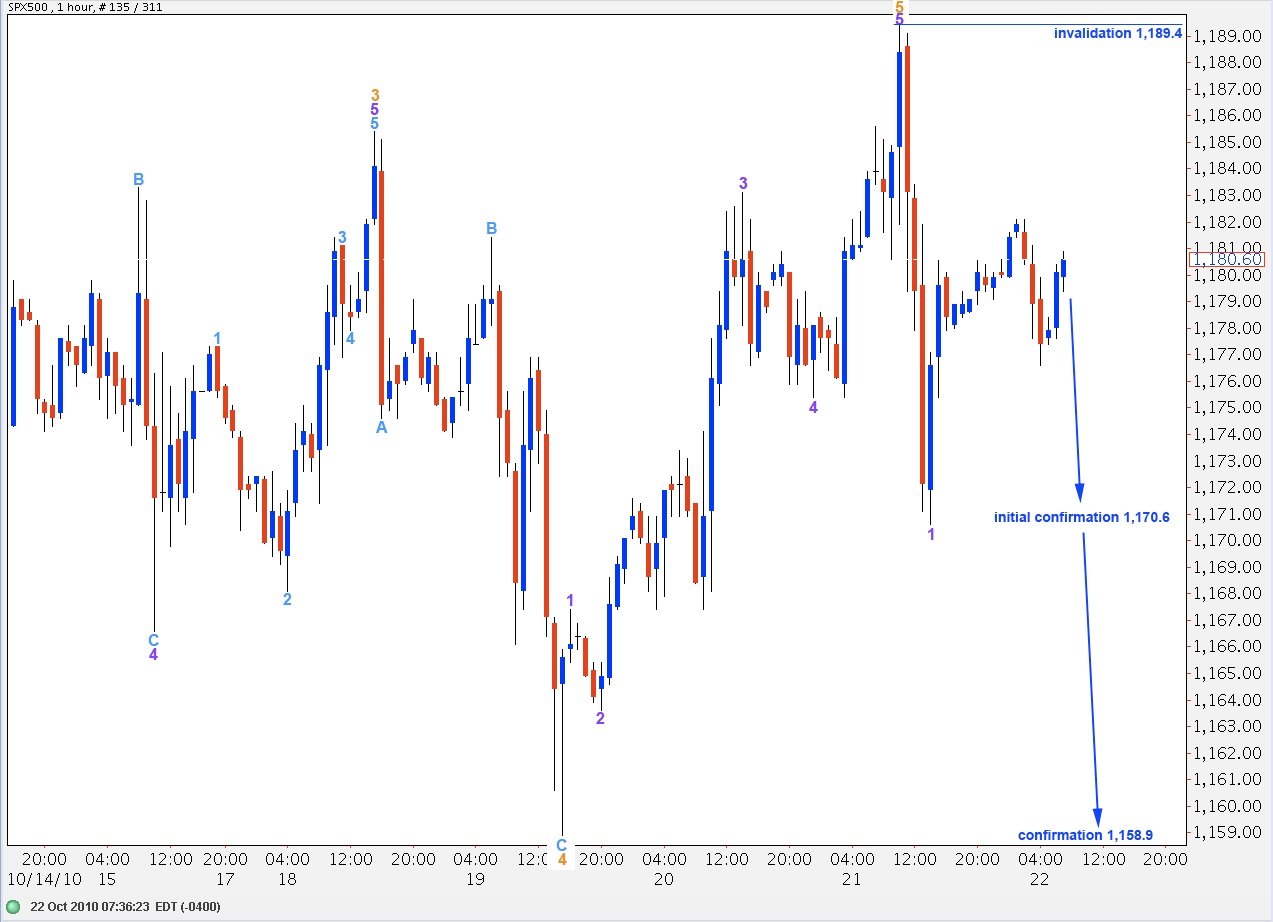
This wave expects upwards movement is over. The last impulse was the final push up.
If this wave count is correct then the downwards movement labeled here wave 1 purple should subdivide on a 15 minute chart into an impulse, and it does not. For this reason I have little confidence today in this wave count. However, we shall have initial confirmation with movement below 1,170.6.
With movement below 1,158.9 price will move outside of this pink parallel channel on the daily chart. This will also remove any alternate which saw the last upwards push as a first wave and following downwards movement as a second wave, as wave 2 cannot move beyond the start of wave 1.
We still need to see a full candlestick outside the lower edge of the parallel channel on the daily chart for final confirmation of a trend change.