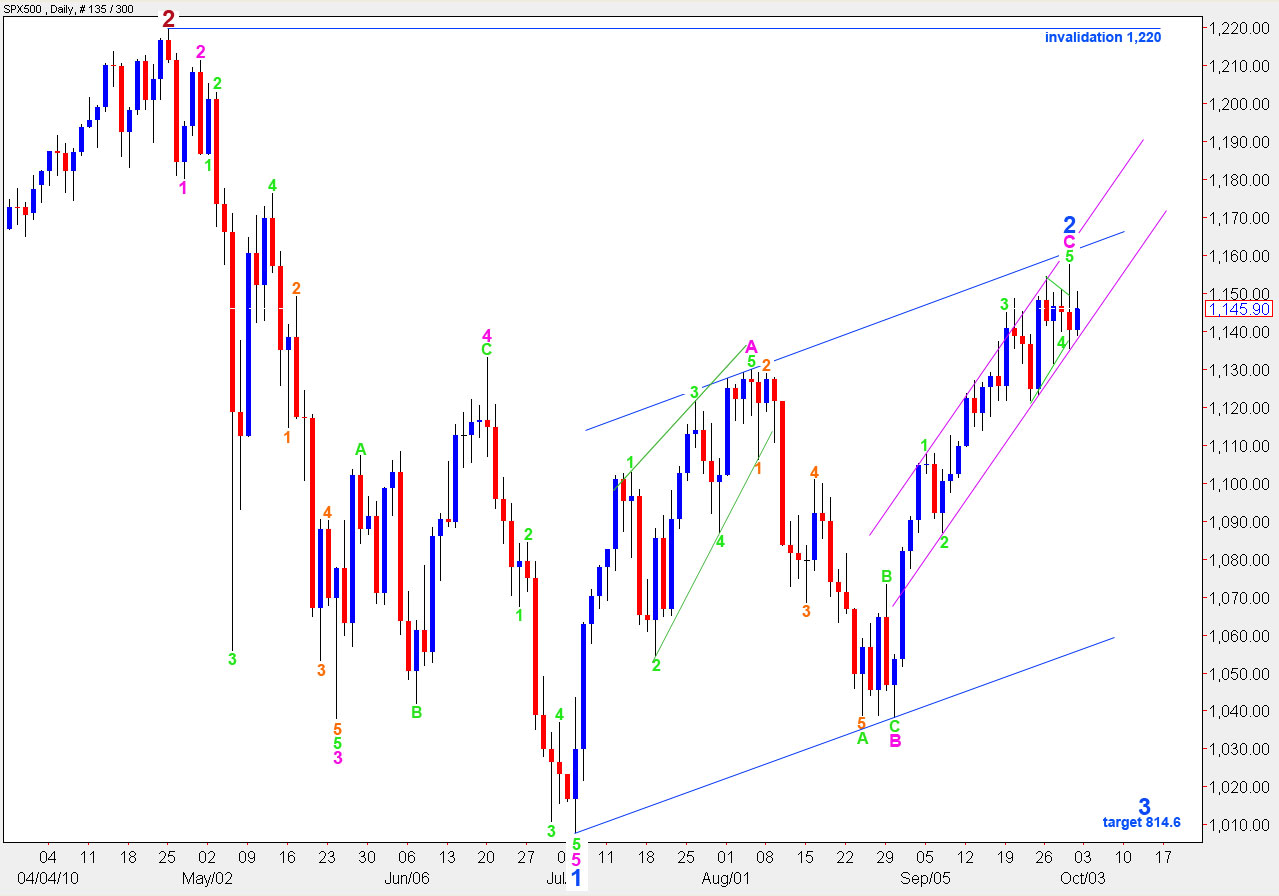
Elliott Wave chart analysis for the SPX500 for 1st October, 2010. Please click on the charts below to enlarge.
The S&P moved mostly sideways during Friday’s session so the situation is pretty much unchanged since last analysis.
It is entirely possible that we have a high in place on the 30th of September at 1,157.6. If this is the case then upwards movement was 2.7 points short of our target zone.
If this wave count is correct we should see increasing strong downwards movement from the S&P during the first part of next week.
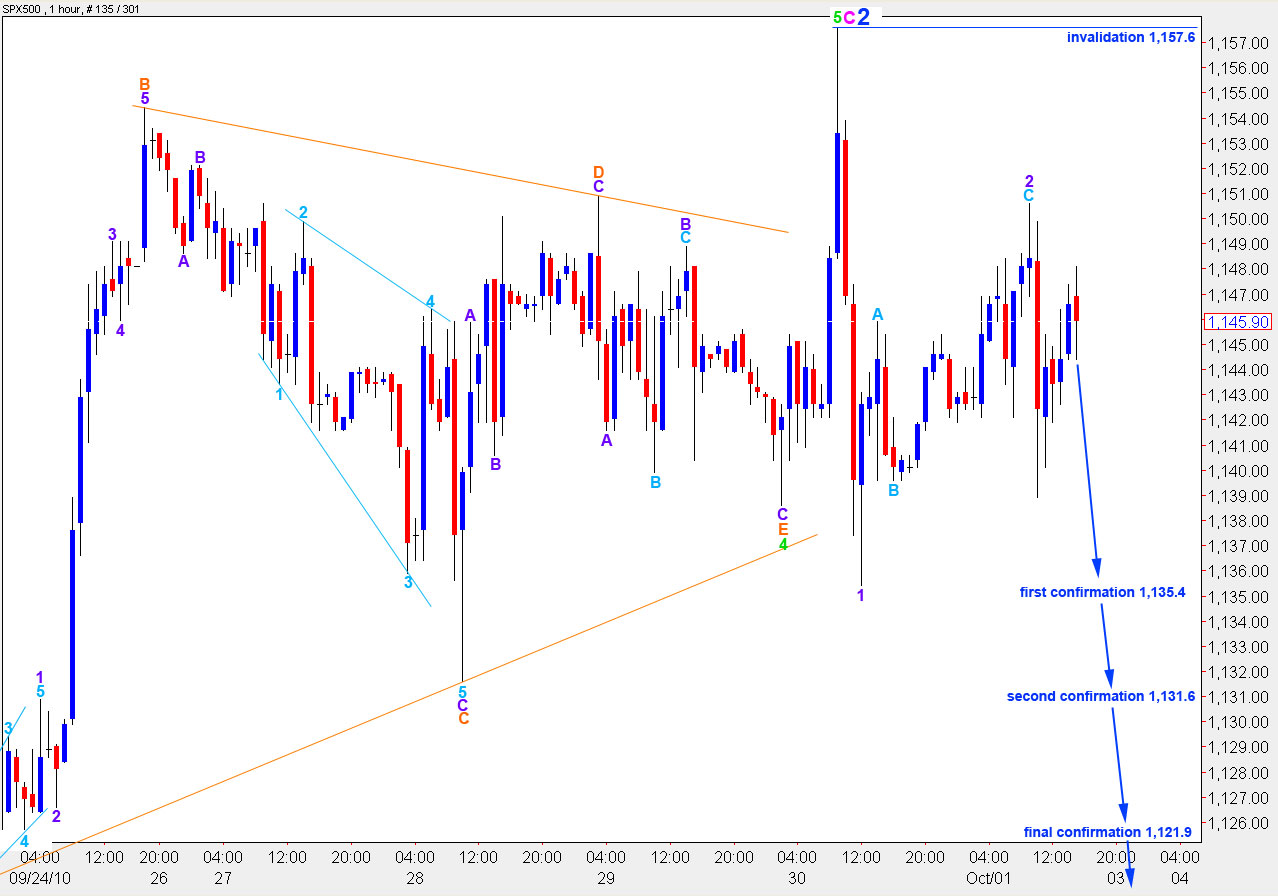
There is a slim outlying possibility that wave 5 green has not ended and is unfolding as an ending diagonal. Movement below 1,131.6 would eliminate that possibility. Therefore, it would be prudent to wait for price to move below this point, at least, before entering any short positions.
Movement below the lower limit of wave 4 green at 1,121.9 would eliminate any alternate that saw wave 5 green unfolding as an exaggerated ending diagonal because any second wave within it cannot move beyond the start of the first. Waiting for price to move below this point would be the safest and most prudent approach to this market.
If this wave count is correct we should see downwards movement to start the new trading week. When we see movement to a low below the end of wave 1 purple at 1,135.4 then we are likely seeing a third wave at purple degree.
If wave 3 purple reaches 1.618 the length of wave 1 purple then a short term target is at 1,114.68.
We need to see each confirmation point breached to the downside to confirm this wave count. Until that happens the possibility of new highs will remain.
I will not present an alternate wave count again to end the trading week as each alternate I can envisage has significant problems to it in the breakdown of some of the waves.
This wave count presented for this end of week analysis seems to be the most likely scenario. It has the best fit.
Ratios within wave C pink are: wave 3 green is 7.7 points short of equality with wave 1 green and wave 5 green is just 4.5 points short of 0.382 the length of wave 3 green.
Wave C pink is just 2.7 points short of equality with wave A pink.
If this wave count is invalidated with movement above 1,157.6 then wave 5 green is unfolding as an ending diagonal and there should be only one more push to a new high before upwards movement is over.


