
Last Friday’s analysis expected the new week to begin with upwards movement that was reasonably likely to make a new high above 2,848.03. A high today at 2,853.21 fits the expectation.
Summary: Some weakness in upwards movement suggests another small pullback may begin about here. The Elliott wave main count expects a new low slightly below 2,796.34 but not below 2,791.47.
A new low below 2,791.47 would indicate a deeper pullback may continue. The target for it to end would then be about 2,770.
If my expectations are wrong for another small pullback, then my error may be in expecting a pullback which may not come. Price may simply continue strongly higher.
The bigger picture remains extremely bullish.
The next target is about 2,915, where another consolidation to last about two weeks may be expected.
The invalidation point remains at 2,743.26.
The mid to longer term target is at 2,922 (Elliott wave) or 3,045 (classic analysis). Another multi week to multi month correction is expected at one of these targets.
The final target for this bull market to end remains at 3,616.
Always practice good risk management. Always trade with stops and invest only 1-5% of equity on any one trade.
New updates to this analysis are in bold.
The biggest picture, Grand Super Cycle analysis, is here.
Last historic analysis with monthly charts is here, video is here.
ELLIOTT WAVE COUNT
WEEKLY CHART
Click chart to enlarge.
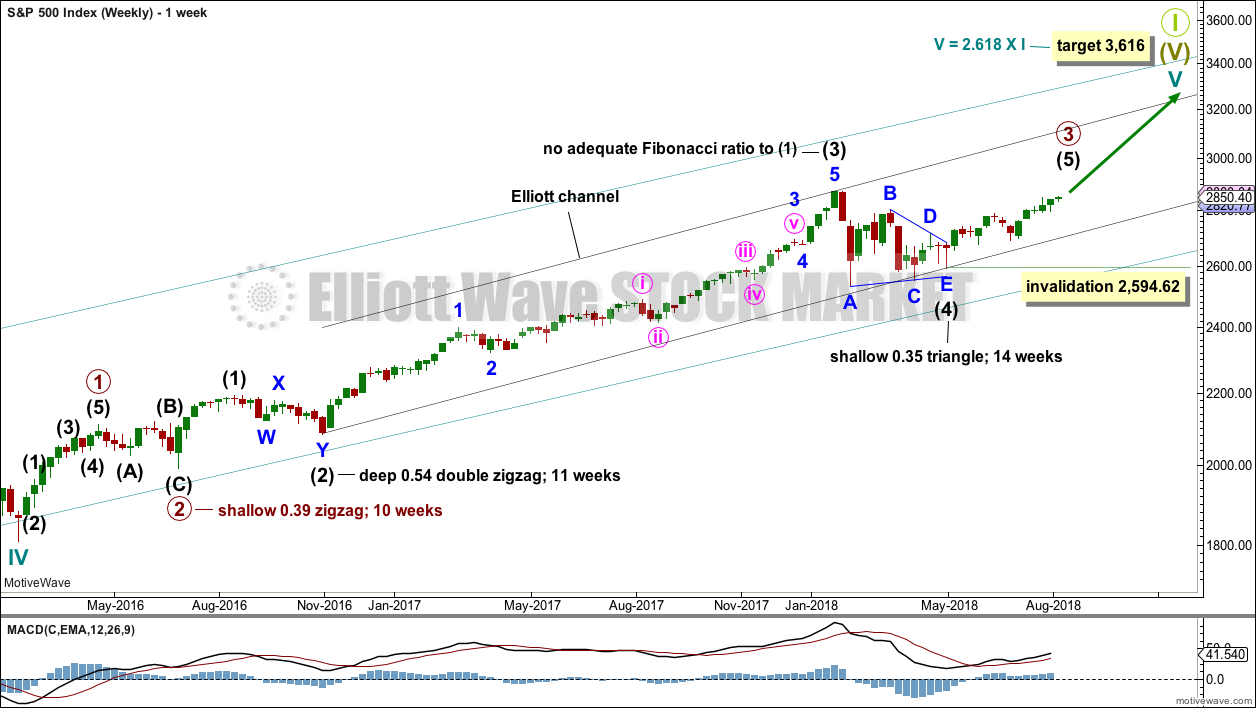
Cycle wave V must complete as a five structure, which should look clear at the weekly chart level and also now at the monthly chart level. It may only be an impulse or ending diagonal. At this stage, it is clear it is an impulse.
Within cycle wave V, the third waves at all degrees may only subdivide as impulses.
Intermediate wave (4) has breached an Elliott channel drawn using Elliott’s first technique. The channel is redrawn using Elliott’s second technique: the first trend line from the ends of intermediate waves (2) to (4), then a parallel copy on the end of intermediate wave (3). Intermediate wave (5) may end either midway within the channel, or about the upper edge.
Intermediate wave (4) may now be a complete regular contracting triangle lasting fourteen weeks, one longer than a Fibonacci thirteen. There is perfect alternation and excellent proportion between intermediate waves (2) and (4).
Within intermediate wave (5), no second wave correction may move beyond the start of its first wave below 2,594.62. However, the lower edge of the black Elliott channel drawn across the ends of intermediate degree waves should provide very strong support for any deeper pullbacks, holding price well above the invalidation point while intermediate wave (5) unfolds.
At this stage, the expectation is for the final target to me met in October 2019.
A multi week to multi month consolidation for primary wave 4 is expected on the way up to the final target.
The last bullish fifth wave of minor wave 5 to end intermediate wave (3) exhibited commodity like behaviour. It was strong and sustained. It is possible that the upcoming wave of minor wave 5 to end intermediate wave (5) to end primary wave 3 may exhibit similar behaviour, so we should be on the lookout for this possibility.
DAILY CHART
Click chart to enlarge.
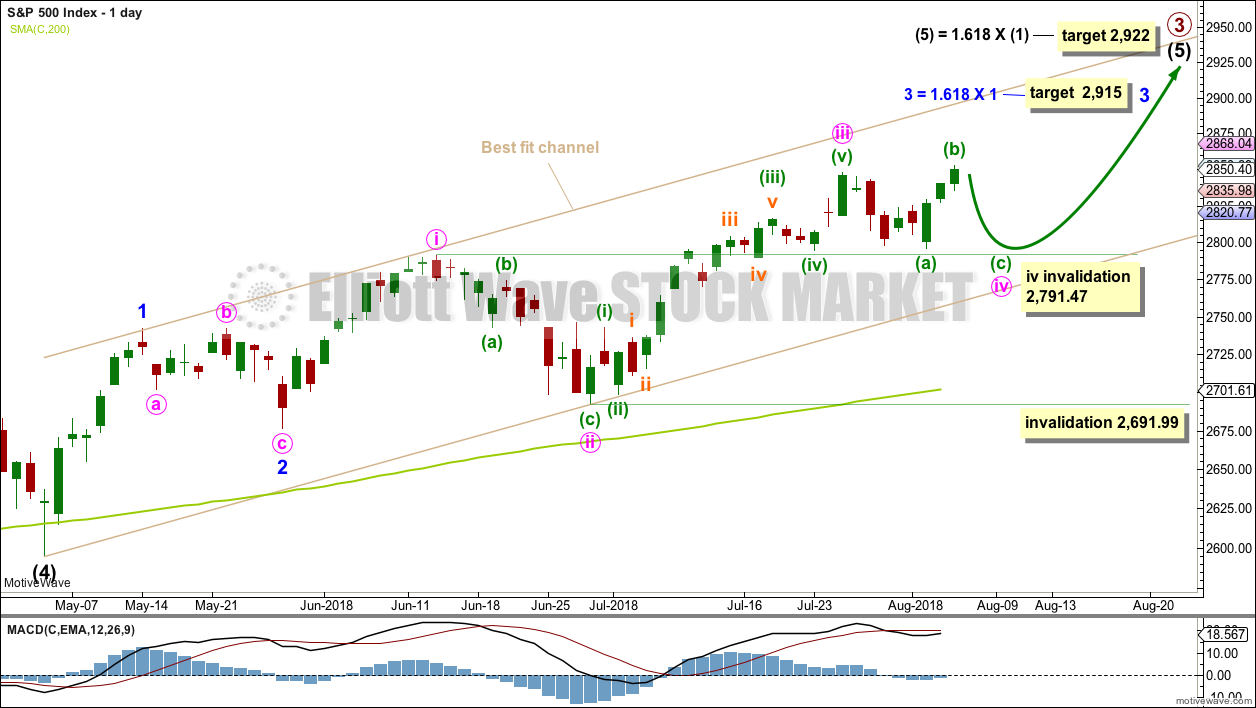
Intermediate wave (5) would be very likely to make at least a slight new high above the end of intermediate wave (3) at 2,872.87 to avoid a truncation.
Intermediate wave (3) exhibits no Fibonacci ratio to intermediate wave (1). It is more likely then that intermediate wave (5) may exhibit a Fibonacci ratio to either of intermediate waves (1) or (3). The most common Fibonacci ratio would be equality in length with intermediate wave (1), but in this instance that would expect a truncation. The next common Fibonacci ratio is used to calculate a target for intermediate wave (5) to end.
It is possible that minute wave iii could be over; if it is complete, it would not exhibit a Fibonacci ratio to minute wave i. Minute wave iv must be very shallow to remain above minute wave i price territory at 2,791.47.
At this stage, it is possible that minute wave iv was over at last week’s low, or that it may continue sideways for a few days as a flat. A flat correction now requires a short wave down to end below 2,796.34 but not below 2,791.47. The main hourly wave count expects this.
If downwards movement continues below 2,791.47, then the best alternate idea would be to move the degree of labelling within minute wave iii all down one degree and see only minuette wave (i) within minute wave iii complete at the last high. Downwards movement would then be labelled minuette wave (ii), which may not move beyond the start of minuette wave (i) below 2,691.99. However, downwards movement should find support reasonably above the invalidation point at support about the lower edge of the best fit channel.
A target is calculated for minor wave 3 to end, which expects to see the most common Fibonacci ratio to minor wave 1. Minor wave 3 may last several weeks in total and should look like an impulse at the daily chart level. When it is complete, then minor wave 4 may last about one to two weeks in order for it to exhibit reasonable proportion to minor wave 2. Minor wave 4 must remain above minor wave 1 price territory.
A best fit channel is added in taupe to this chart. It contains all of intermediate wave (5) so far. The lower edge may provide support for any deeper pullbacks. The upper edge may provide resistance.
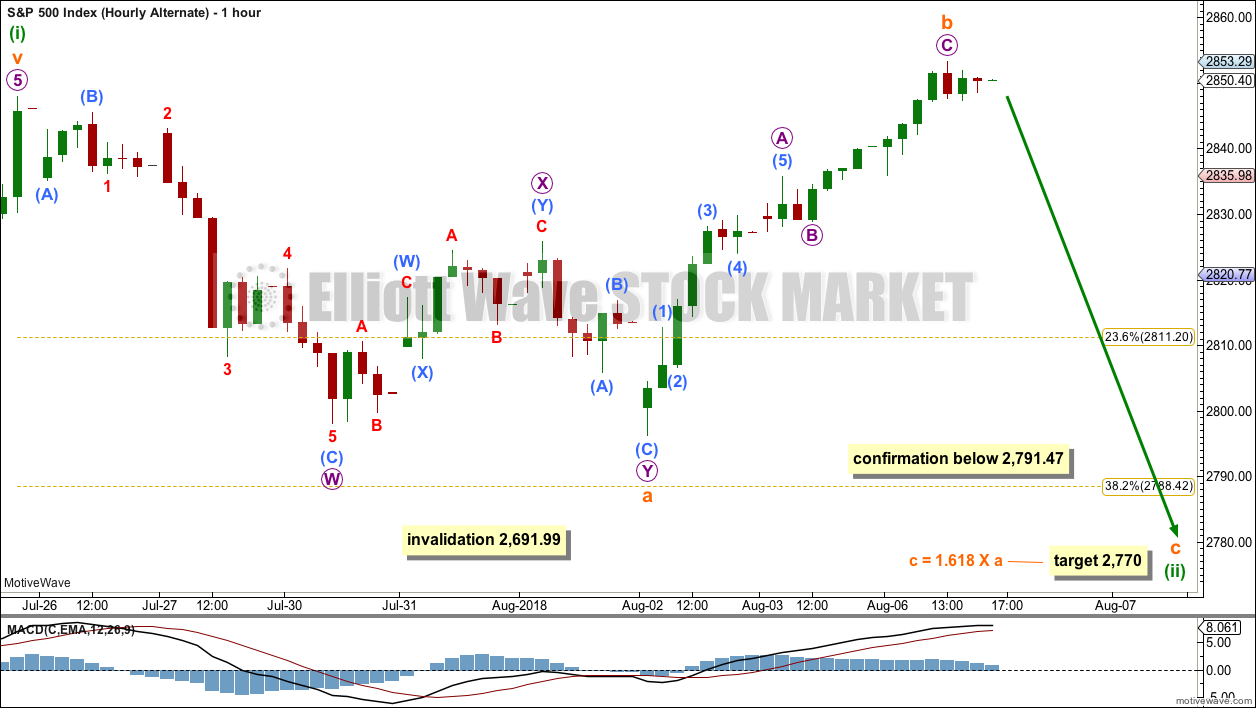
MAIN HOURLY CHART
Click chart to enlarge.
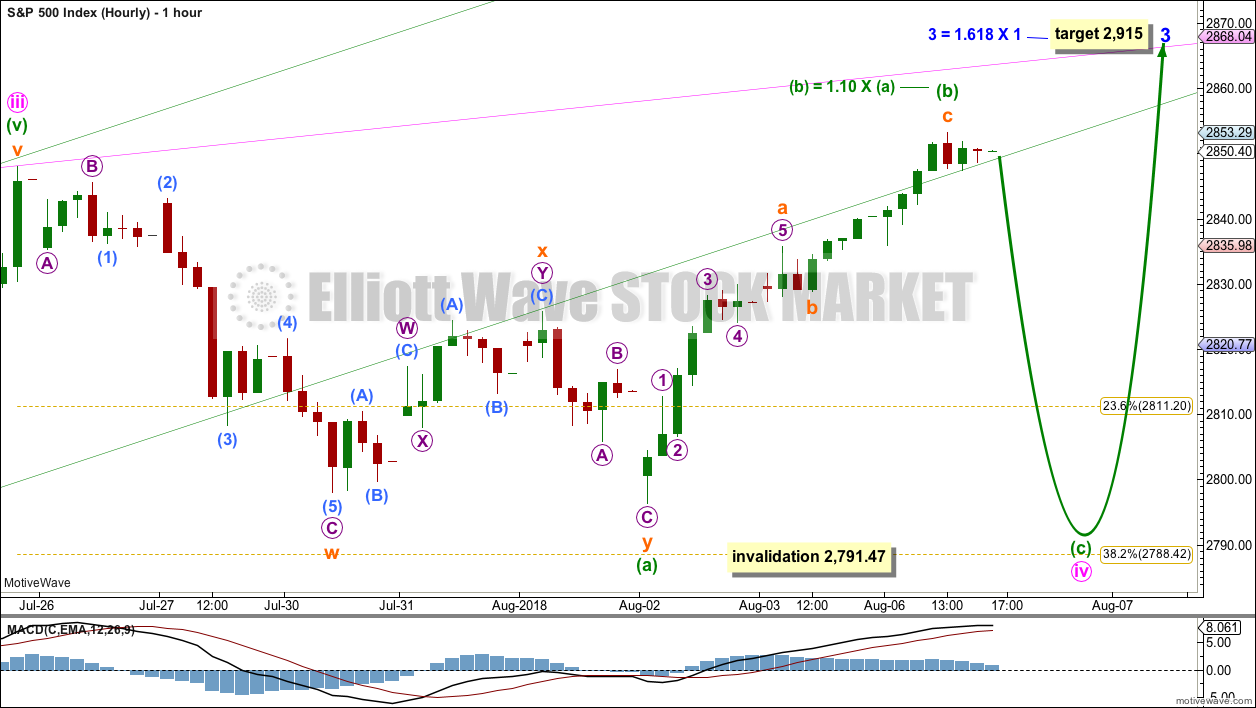
If minute wave iii was over at the last high, then there are reasonable Fibonacci ratios within it.
Minute wave ii was a very deep 0.87 single zigzag lasting 11 sessions. Minute wave iv would most likely be shallow, and most likely exhibit alternation in structure with minute wave ii as a flat, combination or triangle.
At this stage, if minute wave iv is continuing, then the structural possibilities may be narrowed down to a flat correction. Rules for triangles or combinations are at this stage not met.
Within the flat correction, minuette wave (a) subdivides as a three, a double zigzag. Minuette wave (b) may also subdivide as a three, a single zigzag. Minuette wave (b) has reached the minimum requirement of 0.9 the length of minuette wave a, and is within the most common range of 1 to 1.38 times the length of minuette wave (a).
Minuette wave (c) would be very likely to make at least a slight new low below the end of minuette wave (a) at 2,796.34 to avoid a truncation and a very rare running flat.
Minute wave iv may not move into minute wave i price territory below 2,791.47.
Today there is enough weakness within this upwards movement on the classic technical analysis chart to judge this wave count to have a reasonable probability.
SECOND HOURLY CHART
Click chart to enlarge.
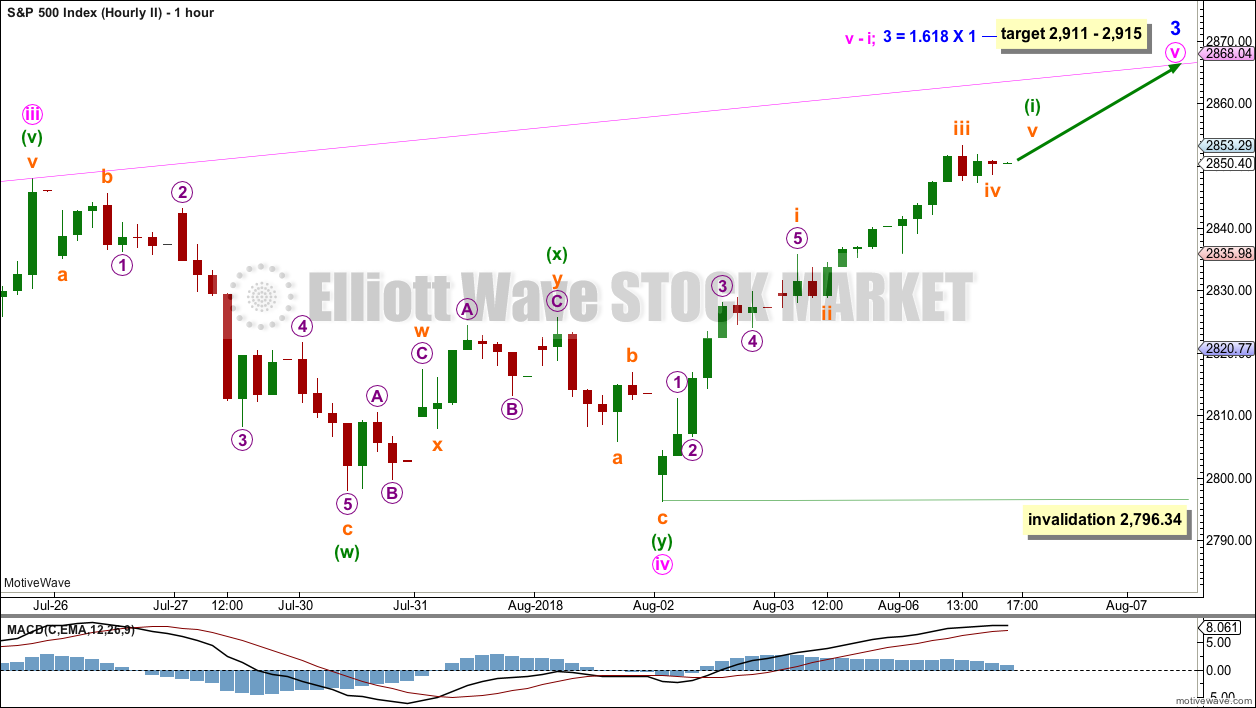
By simply moving the degree of labelling within the correction all up one degree, it is possible that minute wave iv could again be over as a shallow double zigzag.
However, it would be very brief and so disproportionate to minute wave ii. Minute wave ii lasted 11 sessions. Minute wave iv would have lasted only six sessions.
There would be a little alternation in structure as minute wave ii was a single zigzag and minute wave iv may be a double zigzag. Alternation is a guideline, not a rule, and alternation in structure does not always occur.
There would be excellent alternation in depth: minute wave ii was very deep and minute wave iv would be very shallow.
Within minute wave v, no second wave correction may move beyond the start of its first wave below 2,796.34.
Today there is enough weakness in upwards movement and a new high to consider this second hourly wave count as having a lower probability than the main hourly wave count.
ALTERNATE HOURLY CHART
Click chart to enlarge.
This alternate wave count moves the degree of labelling within minute wave iii all down one degree.
If minuette wave (i) was over at the last high, then following movement of the last six sessions may be the start of minuette wave (ii).
Subdivisions of minuette wave (ii) are now seen in exactly the same way as subdivisions for minute wave iv on the main hourly chart. Only the degree of labelling is different. Minuette wave (ii) may be an expanded flat correction. A target is calculated for subminuette wave c to end; this may see price find support about the lower edge of the best fit taupe channel (drawn on the daily chart).
Minuette wave (ii) may not move beyond the start of minuette wave (i) below 2,691.99.
TECHNICAL ANALYSIS
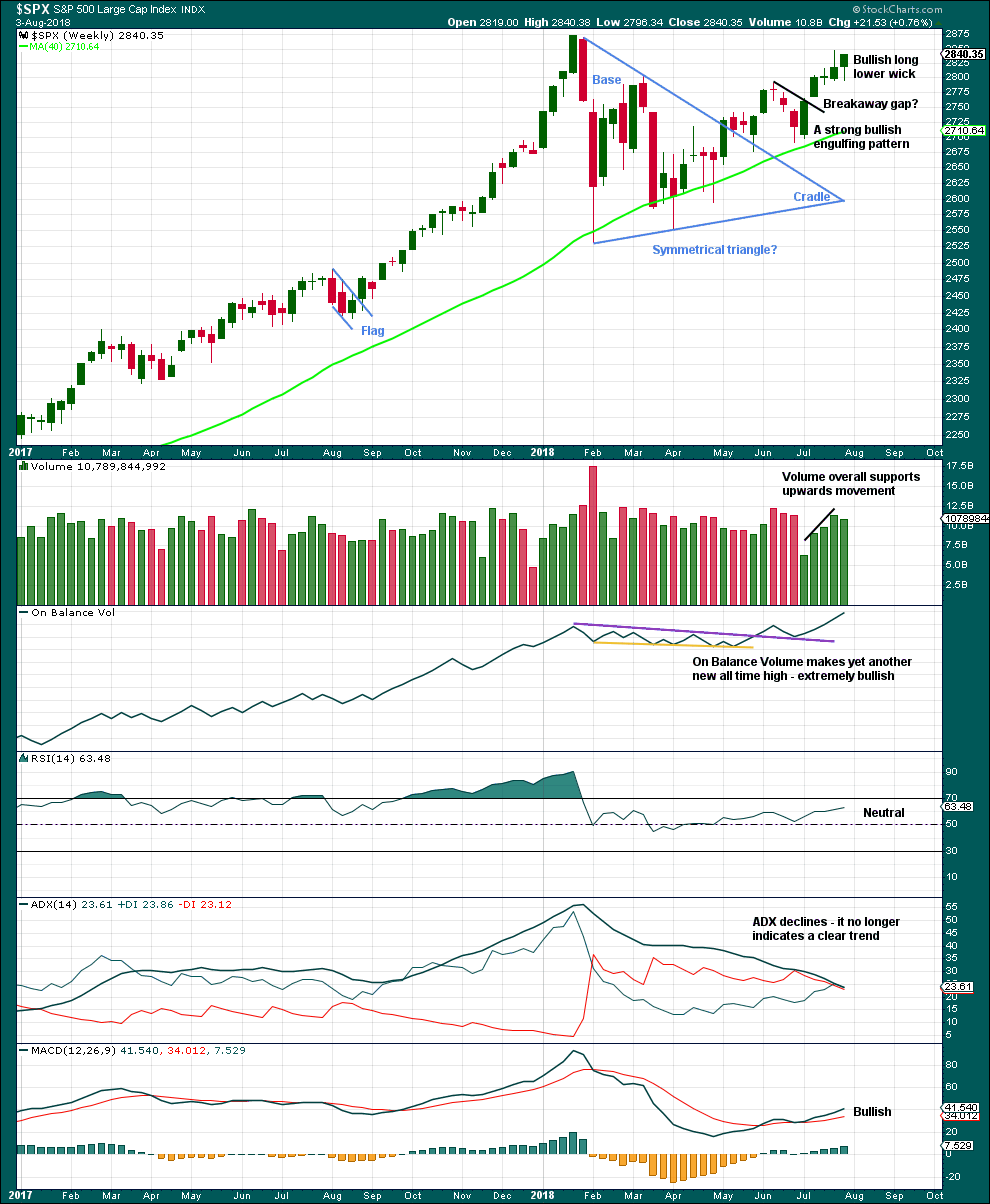
WEEKLY CHART
Click chart to enlarge. Chart courtesy of StockCharts.com.
Another new high for On Balance Volume remains very bullish indeed, but that does not preclude another small pullback within this developing upwards trend. It is still expected that price is very likely to make new all time highs, but it will not move in a straight line.
Last week’s candlestick is bullish with a long lower wick. But it lacks support from volume, which may suggest a B wave.
DAILY CHART

Click chart to enlarge. Chart courtesy of StockCharts.com.
The symmetrical triangle may now be complete. The base distance is 340.18. Added to the breakout point of 2,704.54 this gives a target at 3,044.72. This is above the Elliott wave target at 2,922, so the Elliott wave target may be inadequate.
Since the low on the 2nd of April, 2018, price has made a series of higher highs and higher lows. This is the definition of an upwards trend. But trends do not move in perfectly straight lines; there are pullbacks and bounces along the way.
This bull run now has some support from volume and strong support from On Balance Volume making new all time highs.
The new high today above the prior swing high comes with weak volume and bearish divergence with all of On Balance Volume, Stochastics and RSI. This looks so far like a possible B wave.
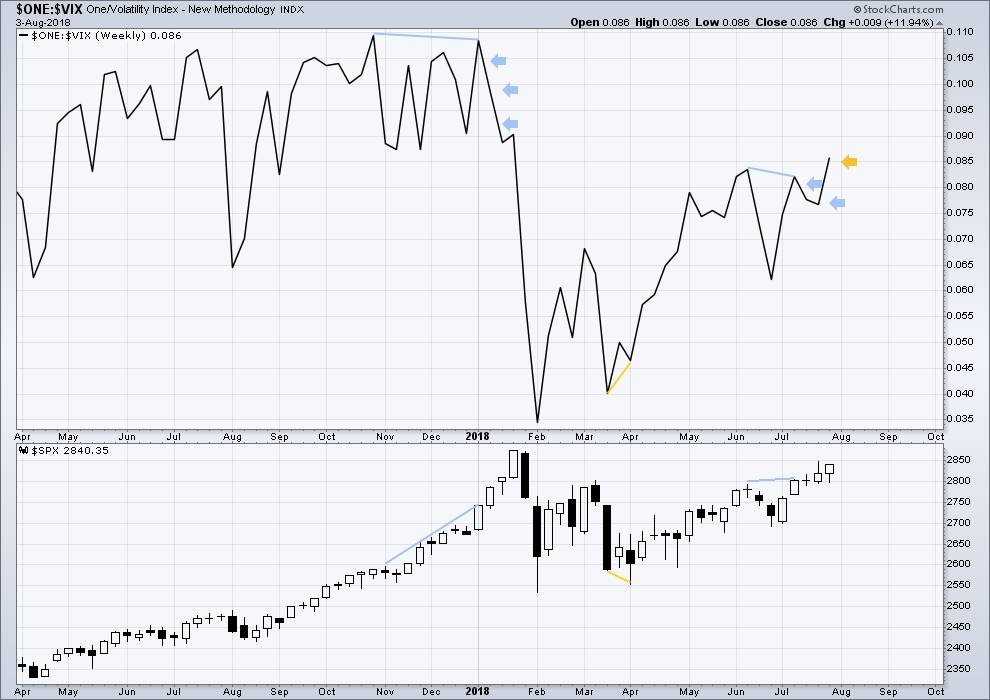
VOLATILITY – INVERTED VIX CHART
WEEKLY CHART
Click chart to enlarge. Chart courtesy of StockCharts.com. So that colour blind members are included, bearish signals
will be noted with blue and bullish signals with yellow.
To keep an eye on the all time high for inverted VIX a weekly chart is required at this time.
Notice how inverted VIX has very strong bearish signals four weeks in a row just before the start of the last large fall in price. At the weekly chart level, this indicator may be useful again in warning of the end of primary wave 3.
Last week completes an inside week that closed green, and the balance of volume was upwards.
Upwards movement last week has support from declining market volatility. Inverted VIX has made a new short term high, but price has not yet; this short term divergence is bullish.
Inverted VIX is still some way off from making a new all time high.
DAILY CHART
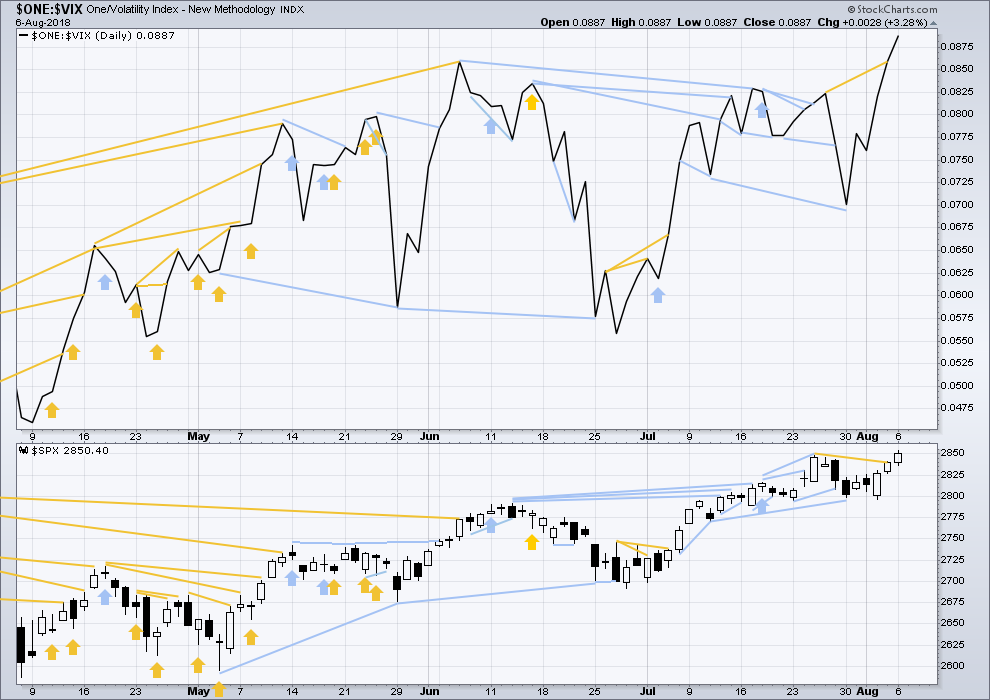
Click chart to enlarge. Chart courtesy of StockCharts.com. So that colour blind members are included, bearish signals
will be noted with blue and bullish signals with yellow.
Normally, volatility should decline as price moves higher and increase as price moves lower. This means that normally inverted VIX should move in the same direction as price.
Last noted mid term bearish divergence has not been followed yet by more downwards movement. It may still indicate downwards movement ahead as there is now a cluster of bearish signals from inverted VIX.
Bullish divergence noted in last analysis has been followed by a new high. This may now be resolved.
BREADTH – AD LINE
WEEKLY CHART
Click chart to enlarge. Chart courtesy of StockCharts.com.
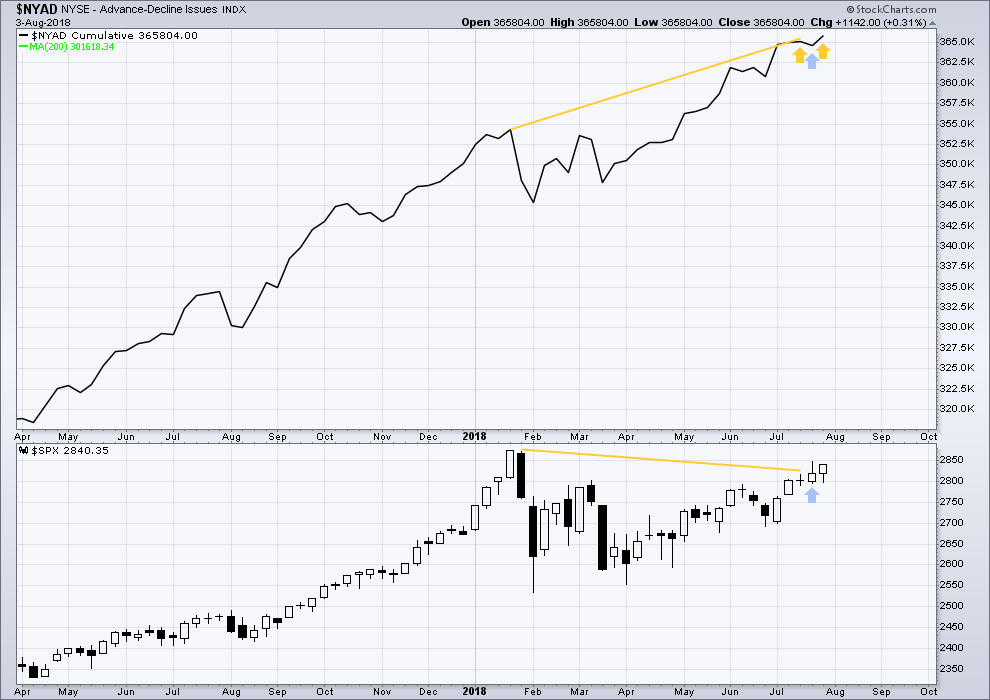
When primary wave 3 comes to an end, it may be valuable to watch the AD line at the weekly time frame as well as the daily.
At this stage, there is very strong bullish divergence between price and the AD line at the weekly time frame. With the AD line making new all time highs, expect price to follow through with new all time highs in coming weeks.
Price this week completed an inside week with the balance of volume upwards. Upwards movement has support from rising market breadth. Another new all time high this week from the AD line is bullish.
DAILY CHART
Click chart to enlarge. Chart courtesy of StockCharts.com.
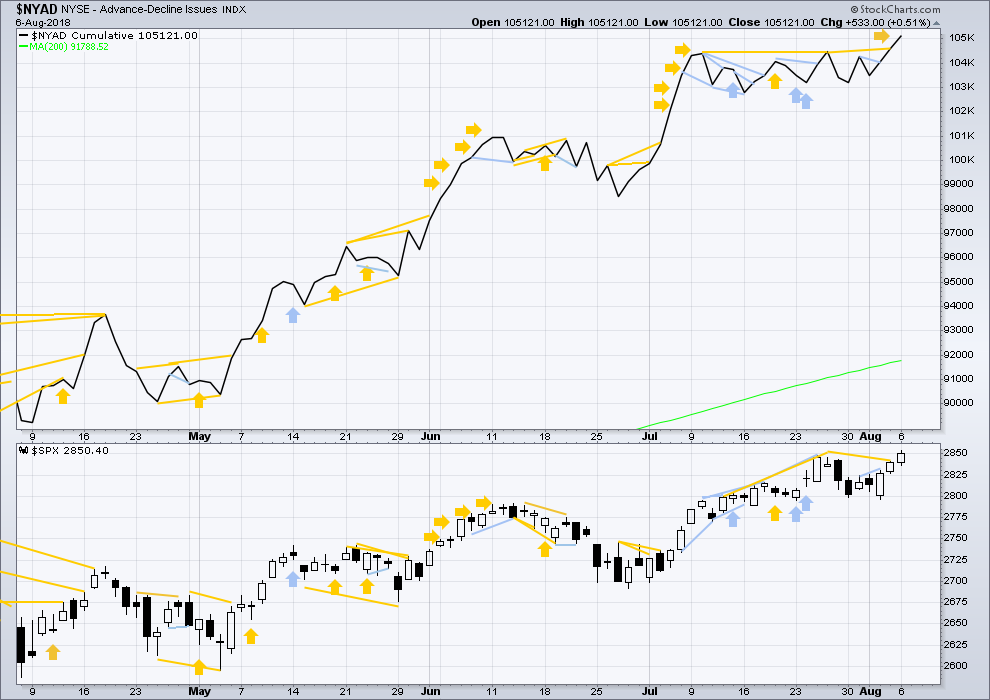
There is normally 4-6 months divergence between price and market breadth prior to a full fledged bear market. This has been so for all major bear markets within the last 90 odd years. With no longer term divergence yet at this point, any decline in price should be expected to be a pullback within an ongoing bull market and not necessarily the start of a bear market. New all time highs from the AD line means that any bear market may now be an absolute minimum of 4 months away. It may of course be a lot longer than that. My next expectation for the end of this bull market may now be October 2019.
Breadth should be read as a leading indicator.
The AD line today makes another new all time high (on the daily chart), which is extremely bullish.
Small caps have made another slight new all time on the 27th of July. Mid caps made a new all time high on the 10th of July. Only large caps have to follow through; they do usually lag in the latter stages of a bull market.
DOW THEORY
The following lows need to be exceeded for Dow Theory to confirm the end of the bull market and a change to a bear market:
DJIA: 23,360.29.
DJT: 9,806.79.
S&P500: 2,532.69.
Nasdaq: 6,630.67.
Only Nasdaq at this stage is making new all time highs, with another new all time high on Friday of last week. DJIA and DJT need to make new all time highs for the ongoing bull market to be confirmed.
Charts showing each prior major swing low used for Dow Theory may be seen at the end of this analysis here.
Published @ 09:43 p.m. EST.
this is still valid, b is still within the most common range of 1 – 1.38 X a.
the second hourly wave count remains valid too
if I see reasonable strength has developed in today’s upwards move then this may become the main count
for now it’s the second, less likely
notice how price is right at the upper edge of the channel, that may provide resistance here
a note: if that second count is correct with the degree of labelling (I moved it up within minute v) then minuette (iii) is shorter than minuette (i), limiting minuette (v) to no longer than equality with minuette (iii) at 2,892.22
I just haven’t finished up the chart yet
My! This is getting exciting! Great heads up on the technical implications of the relative wave lengths.
It sure is looking like we could end up with new moon strength this lunar cycle as a third wave high would fall within the +- three day window. VIX umder 11 on a closing basis yet again! Yowza!! 🙂
It sure looked like yet another triangle today so I like the alternate…onward and upward!
I got ten bucks riding on a new ATH! Gidyap lil’ pony!
Trendline overthrow tomorrow perhaps?
If we go higher tomorrow it will the first time I maxed out my long trades by sticking with the price target Yipee!! 🙂
TLT has broken the 62% to the down side, very encouraging for my short positions. If it can crack the 78%, then quickly extending to the 127% at 117.6 is extremely likely and down to the 162% at 117 is possible.
I have been noticing that futures ramp are only happening when US traders are awake. Unlike past bull runs where overnight future ramps were common, we only see the ramps in the morning few hours ahead of pre market. Could this mean less of international money in US markets and more internal…
It is also August. A time to play away from the markets for many. August is often light volume. Verne pointed out earlier that August has issued in volatility several past Augusts. With light volume, the market makers can push one way or the other with greater ease. They see the stops like mine and try to fill them just before taking it the other way.
Yes indeed!
Very interested in short retail (XRT). However, it’s in a long running squeeze on the daily, so I have to respect the potential of a break out of the top of the wide range it’s been in.
I will wait for a turn and short trigger at the hourly around that upper channel line.
On the other hand…if it starts to run out the top, I may take it long, anticipating some real momentum as the squeeze comes off. It’s the “take it away” strategy. Either direction! Because either way, it’s going to “go away” from that top of channel price at 51!
SPX went up right to that 127% extension at 2862 and has sat on it since. A very likely price for some consolidation underneath…which is a bit overdue after 5 days of consistently upward movement.
if we get a retrace here, where’s it likely to stop/turn vs. keep going? SPY volume shows a volume node at 2847, and another larger at 2832 (and larger below that).
Time for the retrace fibo’s. If price enters this morning’s gap (<2856), I will be adding a tactical short, expecting a retrace to at least the 23%, probably the 38%, and who nose, the 62% wouldn't surprise me at all.
On the other hand if SPX gets back to new highs here after 2pm EST, the ATH may well be hit/exceeded today! Air pocket above.
I’ve set my stop loss order just below the bottom of this morning’s gap up.
Homebuilder’s showing life. Here’s LEN breaking it’s down trend line on the daily, and it’s already polarity reversed to “up”. Others (PHM for example) are similar.
Funny, ain’t it?
What a bunch of clowns! 🙂
Watch them mount a furious onslaught to keep VIX from clearing 11.25 he!he! 🙂
VIX impulse up…2nd wave correction underway?
OpEx tomorrow could delay the upside break-away.
I just really enjoy watching these volatility shenanigans. They are fighting tooth and claw to contain an explosive gap higher…hyuk! Kinda like holding an inflated ball under water…
Time to short AAPL? Finally a tiny little bit of topping action. I bought a few OTM puts for late this month. WTH.
Kevin,
You might be right on AAPL timing but waiting on the Lunar cycle to show itself before going short on AAPL.
Yes indeed! This lunar cycle is going to quite fasinating. The inversion high last full moon could be pointing to a humdinger low this August 26.
Hi Kevin i was doing the same thing with AAPL
what level do you think it goes down to?
Thank you
XOM has finally completed a swing bottom and turned back up in it’s rather larger range (79.5 – 84.5). I have a bull put spread covering this range, October expiry (would prefer Sept at this point but it is what it is now.)
I was expecting upwards movement all this week. A green VIX print today might prompt a reconsideration.
Gold (GLD) hasn’t broken it’s several months long down trend line on the daily chart yet. I suspect an awful lot of money has been lost by folks trying to guess a gold bottom. Okay, I’ll admit I have an underwater long position too; I was looking for a turn off that 61.8% at 115.6. Not to be.
ALL TRENDS EVENTUALLY END. Even this one. Though until that trend line breaks…more down coming!
I have been out of my long gold positions , NUGT, for quite a long time now. I will not try to catch that falling knife. On Balance Volume for Gold is very, very bearish. I think it may have a long way to go to the downside with some upward corrections along the way. The trend is your friend and right now the trend in precious metals is down.
What has been of interest to me is how well GDX has held up under this continual falling gold price. Right now it is at an 18 month old support line. If it breaks significantly below 21, GDX could be on its way to 18.50. If that doesn’t hold, we could be facing 12.50. That would be a time to try to catch the falling knife imho.
Yep. It has been quite a grind. I kinda suspected we might see this and rolled out positions to November. Glad I did!
This is a classic thrust from a fourth wave.
The move up is terminal.
Yes. But the $69M question is where shall it terminate. We have TA weakness showing now. Looking for more negative divergences. Jesse Livermore opined that one of the biggest mistake traders / investors make is taking profits too early. You and I know that it hurts equally as much to watch profits dissipate as the market turns against our profitable positions. Not easy decisions.
For several months now, Lara’s summary comments have been indicating a TA target of 3045 SPX for the triangle breakout thrust. Will it make it without any significant corrections between now and then? Price is saying, “Yes” as of now. Some other indicators are saying, “No”, as of now, “It will correct.”
Lara’s EW analysis is calling for a multi week or multi month correction between now, 2860, and the ultimate target of 3045. That will be my guide and plan with tight stops on longs and shorts.
Nothing of much size re: corrections is coming along until the primary 4. THAT will be a freak out monster (pundits everywhere will declare the bull market over), and bring price back into the range of the intermediate 4 (i.e, back to “here” or to 2600 or deeper). Certainly no one wants to ride that down with investment type positions. But that’s still a ways out, per the count.
Quite true. I have learned to trust Lara’s targets after repeatedly leaving lots of moolah on the table. As an options trader, it is often helpful to get positioned before the actual turn to get ahead of exploding premiums. I will probably exit long positions at the close if I see a green VIX print today. 🙂
This move is part of a minor 3 up, almost certainly incomplete. When it finishes, there will be a minor 4 down…then a minor 5 to yet MORE new highs. Then a REAL pullback, a primary 4 I believe. That one is off in the distance quite a ways still. Maybe Sept, maybe Oct. Maybe even later, I haven’t actually tried to measure that (yet).
Follow the wave count, Luke. (And Rodney.)
2861.7 is the next key resistance fibo (derived), a 1.27 extension.
After that, it’s up to the 2873 ATH.
As I said, a lot more up is likely.
The new highs are coming with steep negative momentum divergences, steeper than I have seen for quite some time on hourly, daily, and weekly time frames. While I am expecting new highs all this week to co-incide with new moon strength, some chart indicators are warning of a possible substantial decline. August typically brings seasonal market weakness. We just might get an early warning with series downside gaps. If that happens, you know what to expect. Time to hedge and keep stops tight methinks…
BTW, VIX had a rare close below BBs today. Most of you kmow what to look for! 🙂
Not only that, but I know you see the extreme tightening of the BBands. Raising to full position. Kudos to Lara’s excellent analysis! Everyone should be using this 3rd wave to exit, raise stop, bank gains, etc. What’s coming is not worth stressing the remaining 3-4% of upside in the indexes. Good luck everyone, I’m setting my positions at open then jumping on a plane for 16 days of surfing in Indonesia. High probability of at least a 5% pull back while I’m gone as the FED taps my phone.
Cheers!
Roger that Chris!
You had me in stiches dude! 🙂
I agree Chris. The tightening of the VIX BBs has given me some concern of late. I did note that they were quite constricted just before the Jan-Feb 2018 SPX plunge. However, they had been constricted for several months, Oct 2017 thru Jan 2018, before the plunge began. So I am not certain we will see the correction you are looking for before you return from your surfing trip. Have a great time Chris and come back safely.
That being said, my plan all along has been to lighten up or exit my long positions as we cross the SPX 2900 mark. I certainly will be tightening the stops for all the profitable long positions. In addition, I am thinking the TA triangle breakout of Intermediate 4 gives a target of 3000+ on the SPX. That may be my final exit and time to go short.
Thanks for the heads up and your thoughts. It is good to be concerned rather than complacent. Again, have a great trip.
Oh wow! I wish you a fabulous surf trip. May you get many many barrels.
Looking at all the recent price swings on the daily chart and projecting them from the recent low, you can see that this up swing in price should be far from over. The smallest equivalent swing would take price to 2911, close to Lara’s projection for the top of minor wave 3. Other swings would take price much high. While I’ll stay alert, I will not be surprised at all to see price just generally continuing to motor higher here, without any pullback down to the 2800 or lower level. Recent history strongly indicates price will keep climbing the ladder here. We’ll see!!
Here’s the broader view, so you can see the swings these projections are taken from.