
A very short range inside day does not change the Elliott wave count. Price remains within the channel and above the short term invalidation point.
At the end of the week, on the weekly time period, new signals from On Balance Volume and the AD line give confidence in the larger picture for the Elliott wave count.
Summary: The bigger picture is that this bull market is ageing, but there is not yet enough technical evidence that it is fully mature. The Elliott wave count is also incomplete.
On Balance Volume and the AD line this week both make new all time highs. This is extremely bullish. Expect upwards movement as very likely next week.
Use the new best fit channel on the daily chart for possible support for any deeper pullbacks. Pullbacks are an opportunity to join the trend.
The next short term target is about 2,878; a consolidation lasting about one to two weeks may be expected at about this target. Following that, another consolidation lasting about two weeks may be expected about 2,915.
The invalidation point may now be moved up to 2,743.26.
The mid to longer term target is at 2,922 (Elliott wave) or 3,045 (classic analysis). Another multi week to multi month correction is expected at one of these targets.
The final target for this bull market to end remains at 3,616.
Always practice good risk management. Always trade with stops and invest only 1-5% of equity on any one trade.
New updates to this analysis are in bold.
The biggest picture, Grand Super Cycle analysis, is here.
Last historic analysis with monthly charts is here, video is here.
ELLIOTT WAVE COUNT
WEEKLY CHART
Click chart to enlarge.
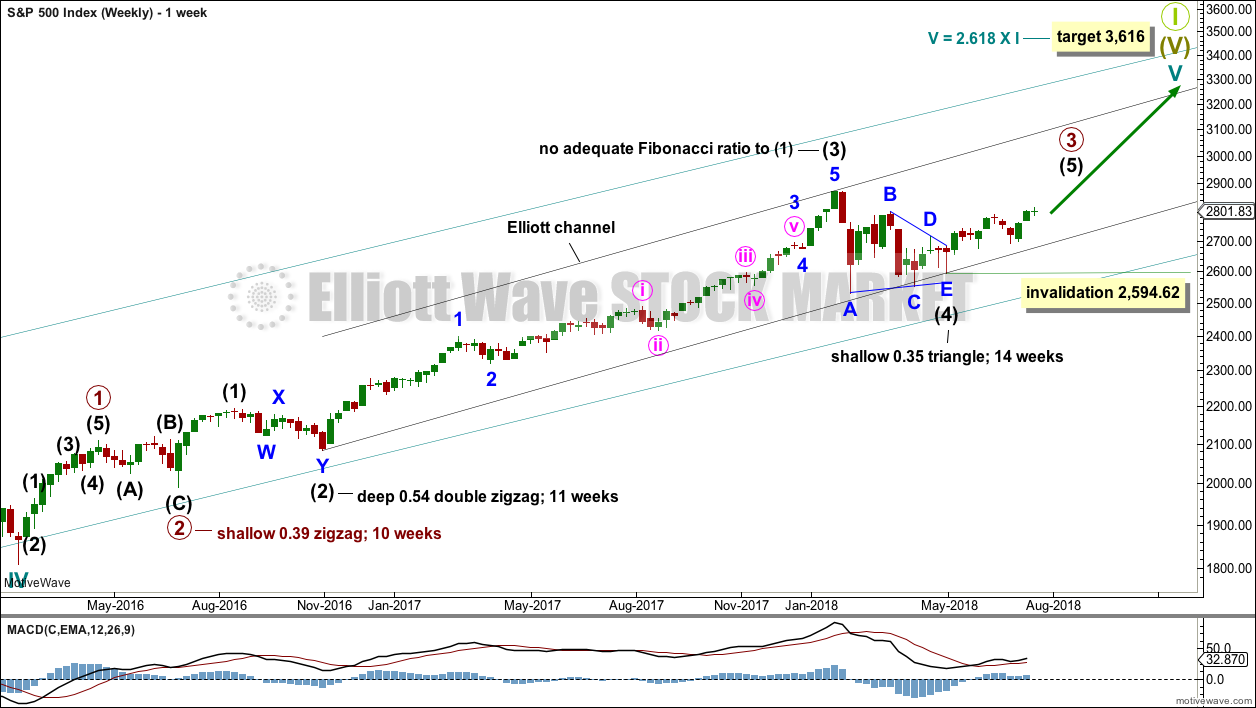
Cycle wave V must complete as a five structure, which should look clear at the weekly chart level and also now at the monthly chart level. It may only be an impulse or ending diagonal. At this stage, it is clear it is an impulse.
Within cycle wave V, the third waves at all degrees may only subdivide as impulses.
Intermediate wave (4) has breached an Elliott channel drawn using Elliott’s first technique. The channel is redrawn using Elliott’s second technique: the first trend line from the ends of intermediate waves (2) to (4), then a parallel copy on the end of intermediate wave (3). Intermediate wave (5) may end either midway within the channel, or about the upper edge.
Intermediate wave (4) may now be a complete regular contracting triangle lasting fourteen weeks, one longer than a Fibonacci thirteen. There is perfect alternation and excellent proportion between intermediate waves (2) and (4).
Within intermediate wave (5), no second wave correction may move beyond the start of its first wave below 2,594.62. However, the lower edge of the black Elliott channel drawn across the ends of intermediate degree waves should provide very strong support for any deeper pullbacks, holding price well above the invalidation point while intermediate wave (5) unfolds.
At this stage, the expectation is for the final target to me met in October 2019.
A multi week to multi month consolidation for primary wave 4 is expected on the way up to the final target.
The last bullish fifth wave of minor wave 5 to end intermediate wave (3) exhibited commodity like behaviour. It was strong and sustained. It is possible that the upcoming wave of minor wave 5 to end intermediate wave (5) to end primary wave 3 may exhibit similar behaviour, so we should be on the lookout for this possibility.
DAILY CHART
Click chart to enlarge.
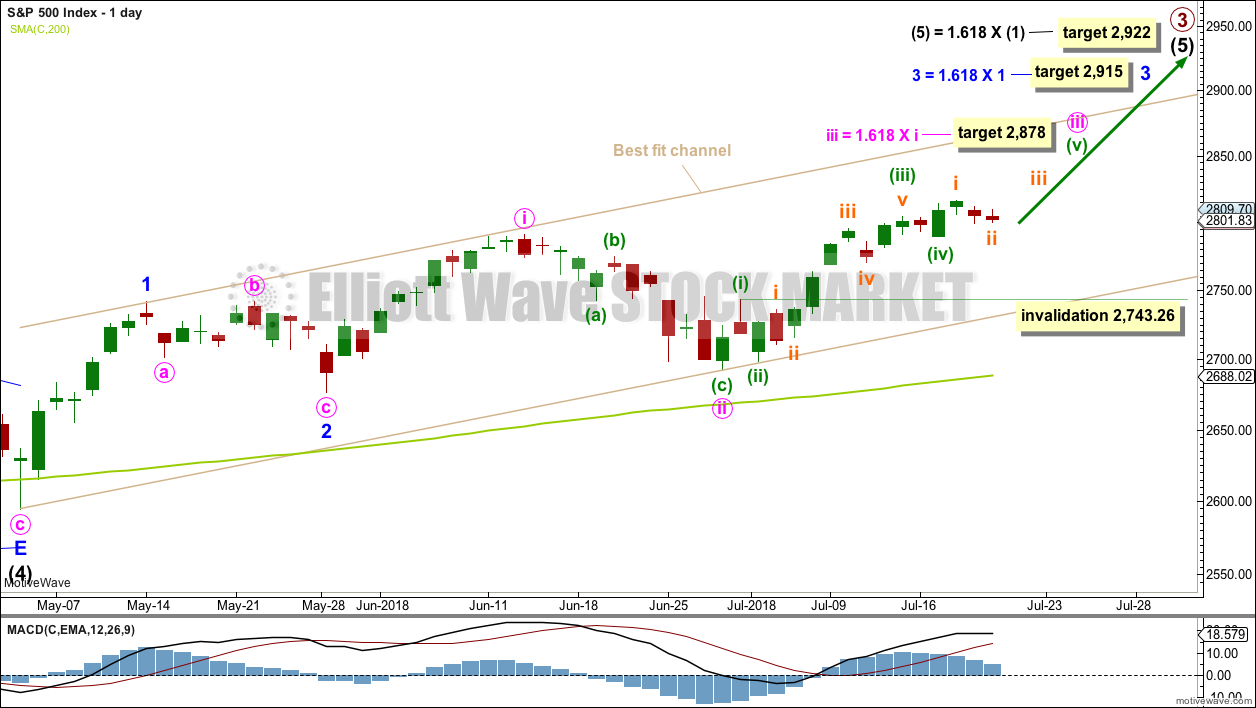
Intermediate wave (5) would be very likely to make at least a slight new high above the end of intermediate wave (3) at 2,872.87 to avoid a truncation.
Intermediate wave (3) exhibits no Fibonacci ratio to intermediate wave (1). It is more likely then that intermediate wave (5) may exhibit a Fibonacci ratio to either of intermediate waves (1) or (3). The most common Fibonacci ratio would be equality in length with intermediate wave (1), but in this instance that would expect a truncation. The next common Fibonacci ratio is used to calculate a target for intermediate wave (5) to end.
A target is now calculated for minute wave iii to end, which expects to see the most common Fibonacci ratio to minute wave i. Minute wave iii may last a few weeks. When it is complete, then minute wave iv may last about one to two weeks in order for it to exhibit reasonable proportion to minute wave ii. Minute wave iv must remain above minute wave i price territory.
Minute wave iii may have passed its middle strongest portion last week. Although the structure could possibly be seen as complete at Wednesday’s high, it has still not moved far enough above the end of minute wave i yet to allow room for minute wave iv to unfold and remain above minute wave i price territory. For that to happen it looks like minuette wave (v) may be a relatively long extension, so that minute wave iii moves higher.
A target is calculated for minor wave 3 to end, which expects to see the most common Fibonacci ratio to minor wave 1. Minor wave 3 may last several weeks in total and should look like an impulse at the daily chart level. When it is complete, then minor wave 4 may last about one to two weeks in order for it to exhibit reasonable proportion to minor wave 2. Minor wave 4 must remain above minor wave 1 price territory.
Within minute wave iii, minuette wave (i) is complete as labelled. Minuette wave (iv), if it continues lower, may not move into minuette wave (i) price territory below 2,743.26.
A best fit channel is added in taupe to this chart. It contains all of intermediate wave (5) so far. The lower edge may provide support for any deeper pullbacks. The upper edge may provide resistance.
HOURLY CHART
Click chart to enlarge.
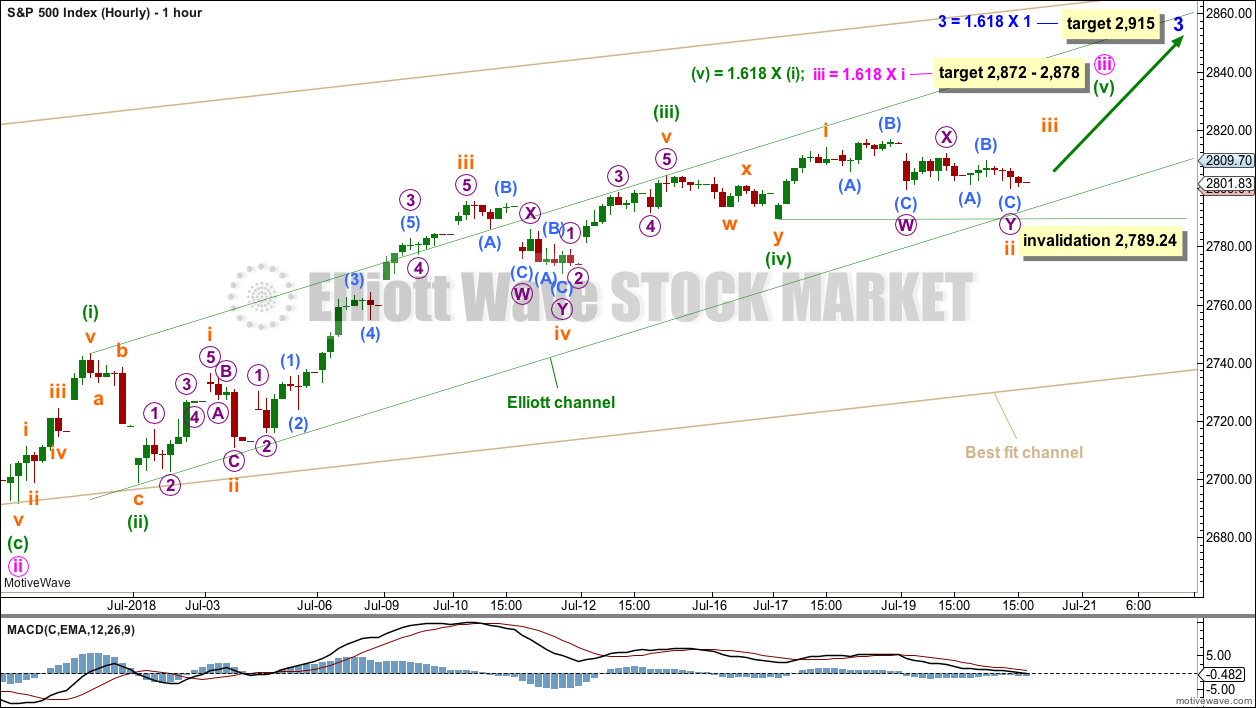
The target for minute wave iii to end is now widened to a rather large 6 point zone, now calculated at two degrees. Favour the lower edge of the target zone as it is calculated at a lower degree.
When subminuette waves i, ii, iii and iv within minuette wave (v) are complete, then the target may be calculated at a third degree. At that stage, it may be refined to a smaller range.
The target for minute wave iii to end would see it move far enough above the end of minute wave i to allow room for minute wave iv to unfold and remain above minute wave i price territory.
Minuette wave (v) may end about the upper edge of the green Elliott channel. If it behaves like a commodity, then it is possible it could overshoot the upper edge of the channel.
Within minuette wave (v), subminuette wave ii may not move beyond the start subminuette wave i below 2,789.24.
Subminuette wave ii now fits as a double combination: expanded flat – X – zigzag. If sub-micro wave (C) of micro wave Y continues any lower, then it may not move beyond the start of subminuette wave i below 2,789.24.
This wave count so far still fits with MACD: the strongest middle portion as the third wave within a third wave has the strongest momentum.
TECHNICAL ANALYSIS
WEEKLY CHART
Click chart to enlarge. Chart courtesy of StockCharts.com.
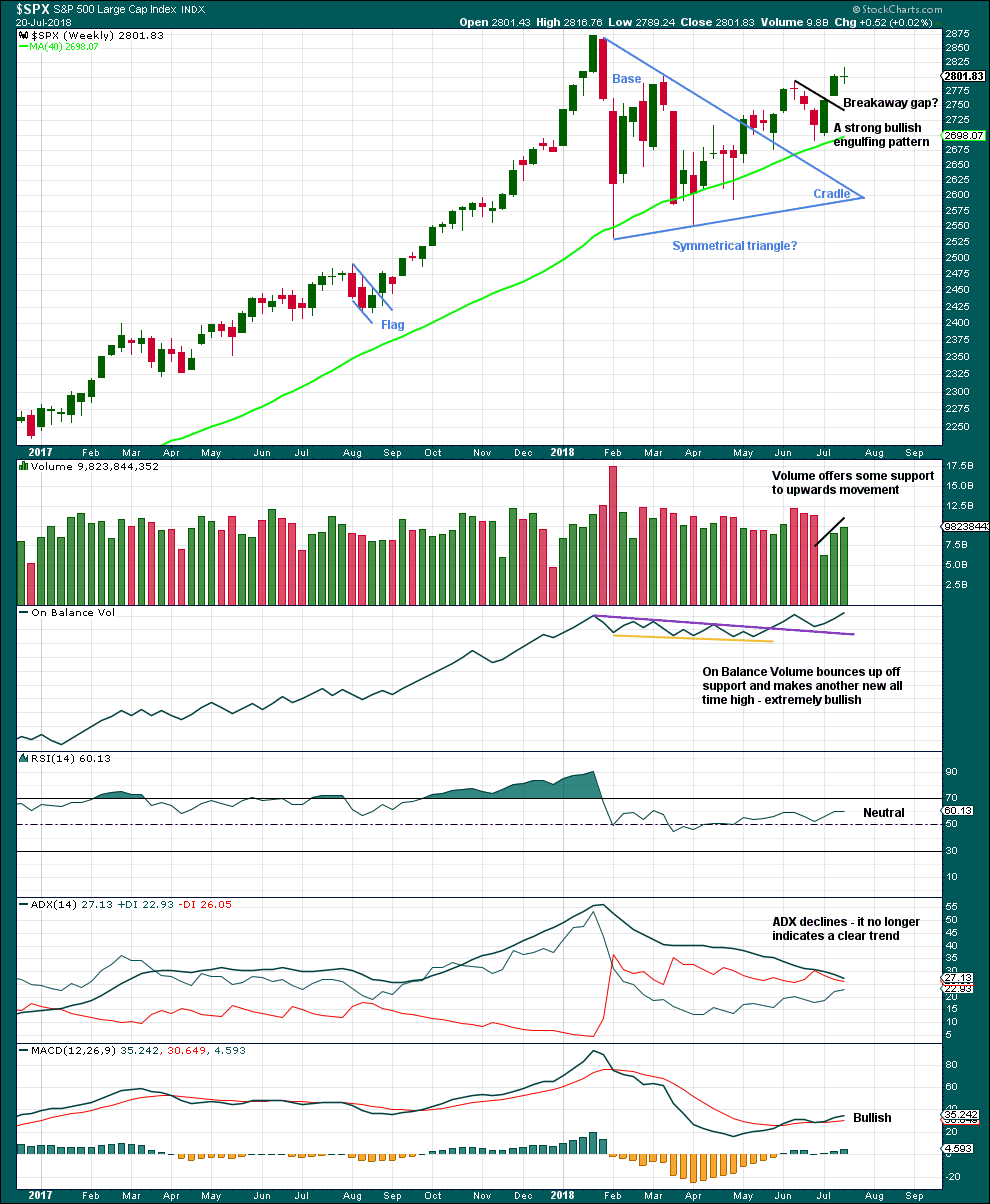
Much weight will be given in this analysis to the new all time high from On Balance Volume. Price usually follows where On Balance Volume leads. It is very reasonable here to expect a new all time high from price in coming weeks.
With volume also supporting another upwards week, this chart is very bullish.
The doji candlestick this week on its own is not a reversal signal. Doji represent a pause and can occur within a trend. There are a few examples in the prior bull run of doji on the weekly chart which were followed by more upwards movement and no reasonable pullback.
DAILY CHART
Click chart to enlarge. Chart courtesy of StockCharts.com.
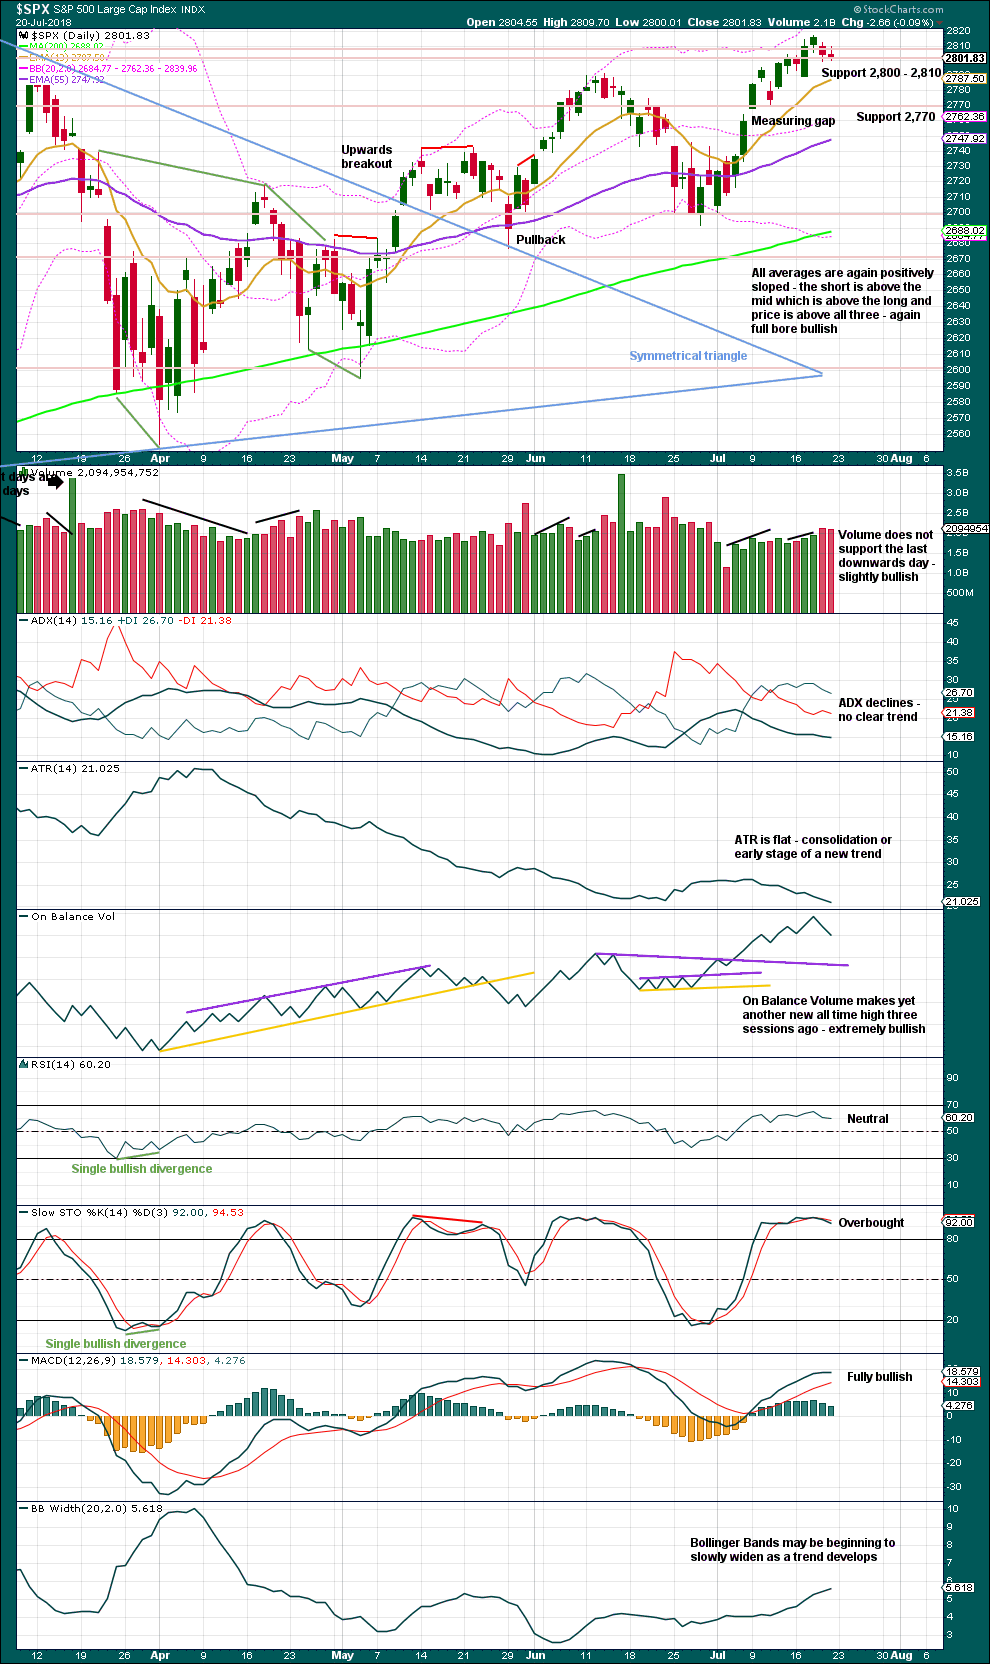
The symmetrical triangle may now be complete. The base distance is 340.18. Added to the breakout point of 2,704.54 this gives a target at 3,044.72. This is above the Elliott wave target at 2,922, so the Elliott wave target may be inadequate.
Since the low on the 2nd of April, 2018, price has made a series of higher highs and higher lows. This is the definition of an upwards trend. But trends do not move in perfectly straight lines; there are pullbacks and bounces along the way. A higher high this week adds some confidence to this trend.
The measuring gap gives a short term target at 2,838. The gap has offered support. It remains open, and the target remains valid.
There is room still for price to continue higher: On Balance Volume remains extremely bullish, and RSI is not yet overbought. When On Balance Volume makes new all time highs before price, expect it is very likely that price shall follow through.
Stochastics may remain overbought for long periods of time when this market has a strong bullish trend. Only when it reaches overbought and then exhibits clear divergence with price, then it may be useful as an indicator of a possible high in place. That is not the case yet.
The last two short range red daily candlesticks look unconvincing as the start of a new downwards trend. It looks like price has seen a small consolidation with good support about 2,800.
VOLATILITY – INVERTED VIX CHART
WEEKLY CHART
Click chart to enlarge. Chart courtesy of StockCharts.com. So that colour blind members are included, bearish signals
will be noted with blue and bullish signals with yellow.
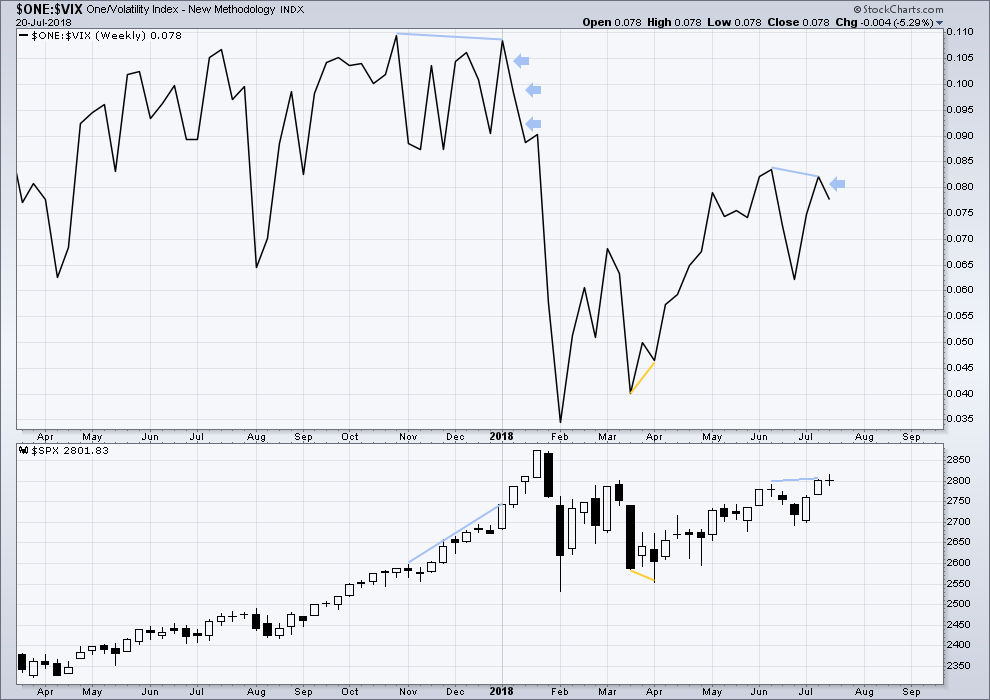
To keep an eye on the all time high for inverted VIX a weekly chart is required at this time.
Notice how inverted VIX has very strong bearish signals four weeks in a row just before the start of the last large fall in price. At the weekly chart level, this indicator may be useful again in warning of the end of primary wave 3.
Price moved higher this week, but inverted VIX moved lower. This divergence is bearish. A single week of this bearish divergence is not a very loud warning though.
DAILY CHART
Click chart to enlarge. Chart courtesy of StockCharts.com. So that colour blind members are included, bearish signals
will be noted with blue and bullish signals with yellow.
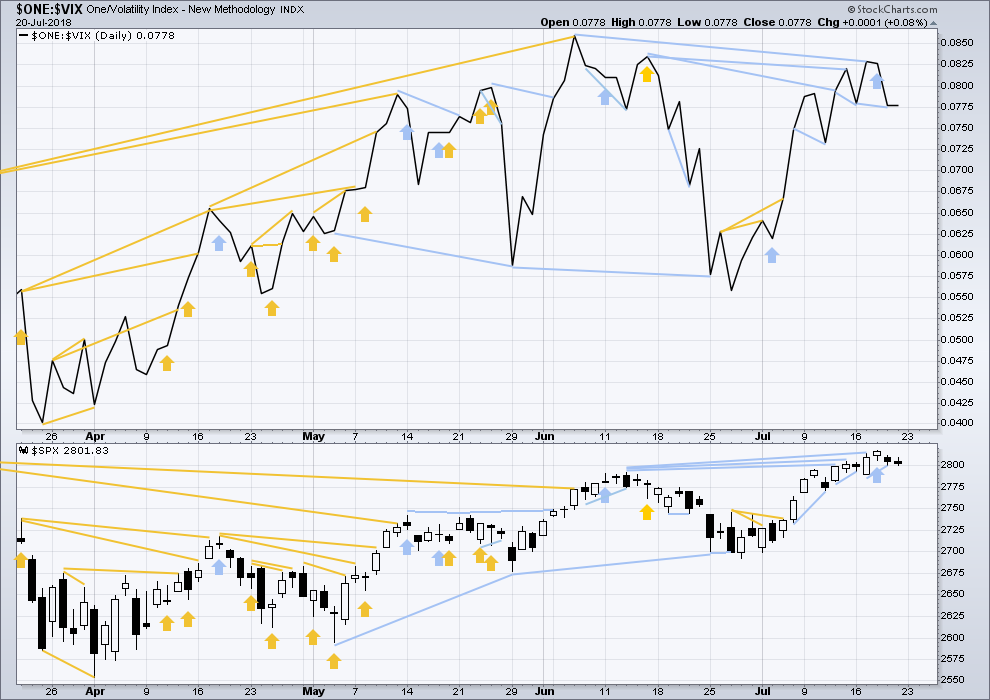
Normally, volatility should decline as price moves higher and increase as price moves lower. This means that normally inverted VIX should move in the same direction as price.
Short term bearish divergence noted in analysis this week may now be resolved by two red daily candlesticks. There is no new short term divergence for Friday’s session.
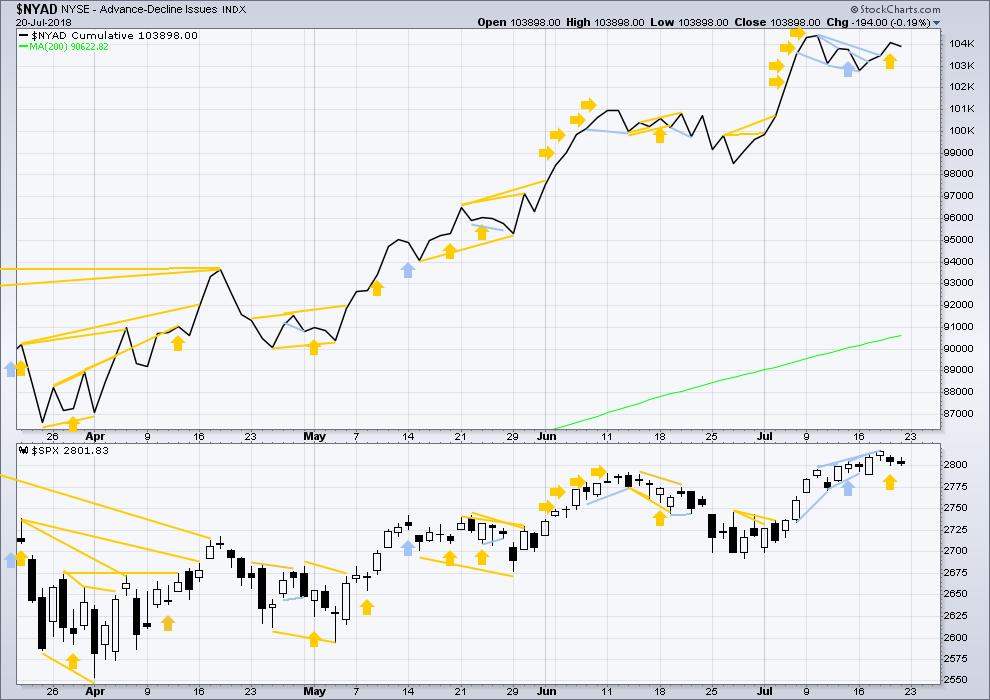
BREADTH – AD LINE
WEEKLY CHART
Click chart to enlarge. Chart courtesy of StockCharts.com.
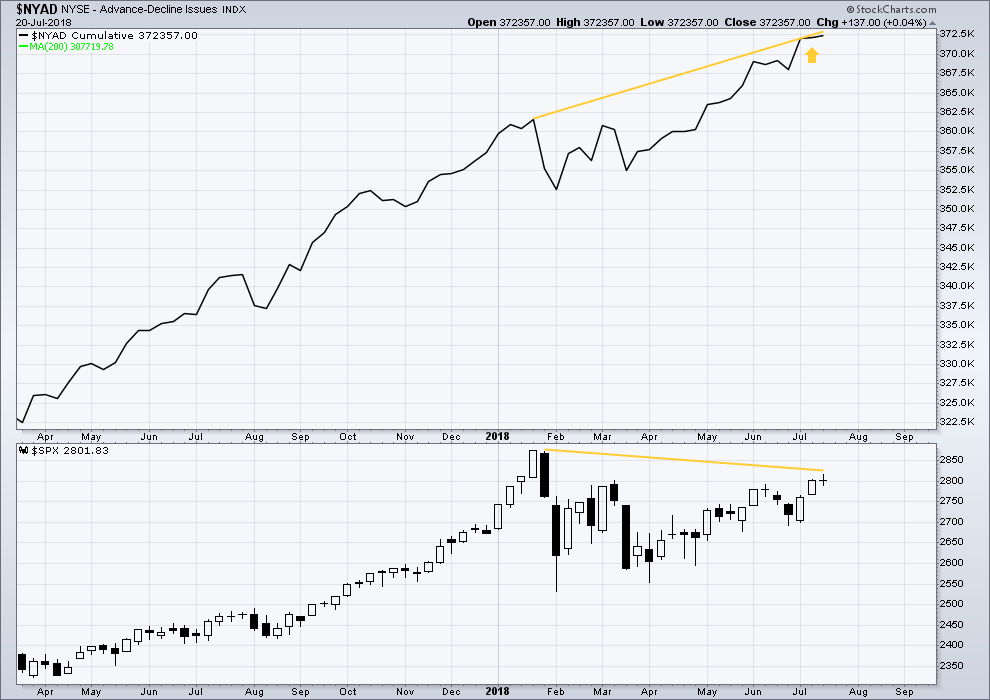
When primary wave 3 comes to an end, it may be valuable to watch the AD line at the weekly time frame as well as the daily.
At this stage, there is very strong bullish divergence between price and the AD line at the weekly time frame. With the AD line making new all time highs, expect price to follow through with new all time highs in coming weeks.
Yet another new all time high this week from the AD line is again extremely bullish.
DAILY CHART
Click chart to enlarge. Chart courtesy of StockCharts.com.
There is normally 4-6 months divergence between price and market breadth prior to a full fledged bear market. This has been so for all major bear markets within the last 90 odd years. With no longer term divergence yet at this point, any decline in price should be expected to be a pullback within an ongoing bull market and not necessarily the start of a bear market. New all time highs from the AD line means that any bear market may now be an absolute minimum of 4 months away. It may of course be a lot longer than that. My next expectation for the end of this bull market may now be October 2019.
Breadth should be read as a leading indicator.
Overall, recent new all time highs from the AD line remain extremely bullish for the longer term trend.
Price may reasonably be expected to follow through in coming weeks.
Two red daily candlesticks may now have resolved the last noted short term bearish divergence. The most recent divergence is bullish from Thursday; it may yet be followed by more upwards movement.
Small caps have made another new all time high this week. Mid caps made a new all time high last week. Only large caps have to follow through; they do usually lag in the latter stages of a bull market.
DOW THEORY
The following lows need to be exceeded for Dow Theory to confirm the end of the bull market and a change to a bear market:
DJIA: 23,360.29.
DJT: 9,806.79.
S&P500: 2,532.69.
Nasdaq: 6,630.67.
Only Nasdaq at this stage is making new all time highs, with another new all time high on Friday. DJIA and DJT need to make new all time highs for the ongoing bull market to be confirmed.
Charts showing each prior major swing low used for Dow Theory may be seen at the end of this analysis here.
Published @ 07:32 p.m. EST on 21st July, 2018.
Lara,
I know I keep going back to this, but is it possible that we are actually in Primary Wave 4, with the A wave of Intermediate wave 4 being W of Primary 4, and the rest of Intermediate Wave 4 being a long X wave to top soon, with a Y Wave if Primary 4 to follow.
Thanks,
Peter
hourly chart updated:
price remains within the channel. the structure of subminuette ii remains the same, with micro Y moving slightly lower at the start of this session
Yep. Looks that way. Trading it that way. Thank you, Lara!
The asymmetries of very short term SPY options arguably give one an edge without any directional bias at all. For example, you can buy a slightly in the money SPY call expiring today for about $30 with about $11 in intrinsic value. Most you can lose: $30. SPX goes to zero, you lose $30. SPX goes up by a single point and you make about $70-80. And more the more it goes up. Given reasonable volatility (expected move), this should give one an edge. Add in the ability to trade it with a trend and you’ve got something.
Yeah. The price of 279.50 puts expiring next Monday down 30% today. Calls of same strike and expiration have hardly budged. They are not expecting a full moon low on Friday, but apparently not expecting much upward movement either. Looks like more meandering ahead. Amaxing! A dead market!
If we get a lunar inversion, those calls are going to really pop. Apparently the Black-Scholes model does not consider lunar cycles.
A lunar inversion.
Hmmm. Maybe that explains the state of the country.
The difficult thing with short-dated options is executing the timing. The brunt of each major move always occurs within a single day or a couple of days at most. If you don’t catch it, you just get stuck bleeding theta.
Yep! A bruising market for options traders.
The sideways lov vol grind is the worst possible of trading environments.
This is looking more and more like some kind of fourth wave. I think we are going to see a sharp move up from this range but I have notion it could be brief…..
It was a subminuette ii per Lara’s hourly. Now price has launched a subminuette iii of a minuette v of a minute iii of a minor 3. But whose counting…
Ha!
Market just not trading like an impulse up.
VIX not trading like a third wave up.
I try to trade what I see, and not what I think.
Maybe we are seeing a slow start….
AG just about tagged that 61.8% at 6.29. The hourly squeeze broke to the downside. Now I wait for a trend change trigger off that level: some TL breaks and polarity inversion. If not…I see 5.7 down there, the 78.6% (derived) fibo.
It happens every time. Just before the real blast higher in PMs the banksters engineer a really vicious wash-out to shake out all the early birds. A lot of traders are onto this ploy and buy the spike down with a vengeance. We should be close to the “event.”
You can get quite a pop with options on fututres when they do it. I am surprised the banksters still do it as the resulting hammer shows massive buying at the spike lows. Same old, same old… 🙂
Yep… Kevin and that Fibonacci… See, I told you the technical’s work for AG!
RSI… has been way over sold for a few days now on the daily!
I will add the Fibonacci sequence to my AG technical list as I got back in too early. Thanks Kevin for proving out the Fib on AG.
Anyone know what Lara is currently saying on Silver & Gold?… this last move lower surprised me. My count is off on that right now. Should have signed up for her weekly on special!
next stop 240.66 for GS.
A clean and strong trend break to the upside is a pretty thing early in it’s lifecycle!
bread and butter for me are trades off 62% retraces, like this setup in XOM (hour tf), thank you for pointing it out Verne.
you can go either way, as it breaks away from 81.17, frankly. The 62% is that strong a price delimiter. Wait for sufficient data (“trigger”) to clarify the direction away. I like polarity inversion and trend line breaks, together, ideally.
Most welcome. Been watching that beast ever since Buffet bailed a few years back!
USO resumes slide today. Posse deploying August 10 14.50/15.50 bear call spread for credit of 0.12.
Buying August 10 14.00 strike puts for 0.24
We need a move to close the 2814.61 open gap from last Thursday. Until then we could be looking at a bull trap. This is a treacherous market…
The posse is long Bitcoin futures and also RIOT via 6.00 strike August 10 calls. We will roll calls forward a week from expiration to compound gains. Cost basis 0.45. Keep it quiet….
Holding DIA, SPY calls…. 🙂
Long BITCOIN?????
Wow.
It’s already gone up what, 20% in the last week? I have a tiny position, which was still able to go seriously under water over the last few months. Recovering but I was figuring it might be years to get my couple of $ back there. Now I’m hopeful maybe it’ll happen sooner! One thing for sure, I’m never going to add to that position, and once out, “me done bitcoin!”.
Again, keeping the big picture in mind, we recently completed a large fourth wave. If EW count is correct, this means new all time highs in the coming months. The daily gyrations are just noise you can ignore. 🙂
Lol!!! I’ve been pretty much ignoring that line on my portfolio for months, trust me!!
It’s crux time. SPX threatening to drop below the prior pivot high at 2790-ish, and in so doing break the up trend line. NDX has flashed a reversal candle off 7300 on the hourly; if that goes and price drops back under 7300, and SPX breaks below 2790, I’ll be cashing longs quickly with the view of reentry much cheaper in a few days, and perhaps adding some shorts.
XLE is in a crazy squeeze combo, about 12 days worth on the daily, about 15 hours worth on the hourly, and now about 45 minutes worth on the 5 minute. Which way it’s going out of these I don’t really know, but I’m long and watching very carefully too see if I add…or stop/reverse.
No question where XLE is going. After all, XOM is its biggest component and that tells you all you need to know! 🙂
I can see why you are bearish. However, at the monthly time frame, while there is a pattern of lower highs, there’s also now a higher low; a descending triangle type of structure. And my trend indicator at the monthly tf is showing neutral now, on rising bars, as is the weekly. The daily is now in day 2 of a squeeze, entered from above. We’ll see; it’ll be opportunity, either way.
Guten Morgen!
Futures suggesting my assumption that pivot battle was over and won by the bulls could have been rpre-mature. I have been alluding to mixed and even unreliable TA indicators in this market and this contimues to be a reason for caution. OpEx probably influenced price action as market makets kept price pinned to the round numbers. The long shadow on Friday’s candle while normally bullish, could be mitigated by this fact. Add to this the fact that we have a full moon on Friday, and that they have signaled major market turns of late, usually, but not always, off market lows, and my previously mentioned observation that we have consistently been seeing down-trends into each month’s end this year, and you have a very dicey market. To top it all off, we will get some market moving earnings reports this week from some big names. Trading vol will be fun! Heavy posse schedule trading earnings. I may post a few.
Have a great trading week!
Bonds in an uptrend someone said?
This MONTHLY chart disagrees with you. That said, if the well-defined downtrend line gets busted, I’ll be happy to go with it on the rise. And I’ll take this short if the TL holds.
Note it’s in month 3 of a squeeze. It’s a gonna blow soon.
The weekly IS in an uptrend. However, the trend line up was just smashed on a big bearish candle off that monthly TF trend line. I’m short here. That TL and the 122.5 area are my stops.
Note again the squeeze, at this TF for 8 weeks. The last squeeze went on and on and finally exited with a massive sell off, that initiated in a manner looking quite similar to this last week, as a matter of fact.
Keeping the big picture in mind can sometimes put you ahead of the chart! 🙂
Okay. Meanwhile, took incremental short profit this morning. Will reload on pullback up.
What a riot! Adding to my TBT puts to lower cost basis. Currently under water…for now… 🙂