
A strong upwards day exactly fits expectations from the Elliott wave count.
At the end of the week, there is strong support for the Elliott wave count from the AD line and On Balance Volume.
Summary: The AD line and On Balance Volume both make new all time highs. It looks like the pullback is over. Expect new highs next week.
The short term target is about 2,849 or 2,915; a consolidation lasting about two weeks may be expected at about this target.
The invalidation point may now be moved up to the last swing low at 2,691.99.
The mid to longer term target is at 2,922 (Elliott wave) or 3,045 (classic analysis). Another multi week to multi month correction is expected at one of these targets.
The final target for this bull market to end remains at 3,616.
Pullbacks are an opportunity to join the trend.
Always practice good risk management. Always trade with stops and invest only 1-5% of equity on any one trade.
New updates to this analysis are in bold.
The biggest picture, Grand Super Cycle analysis, is here.
Last historic analysis with monthly charts is here, video is here.
ELLIOTT WAVE COUNT
WEEKLY CHART
Click chart to enlarge.
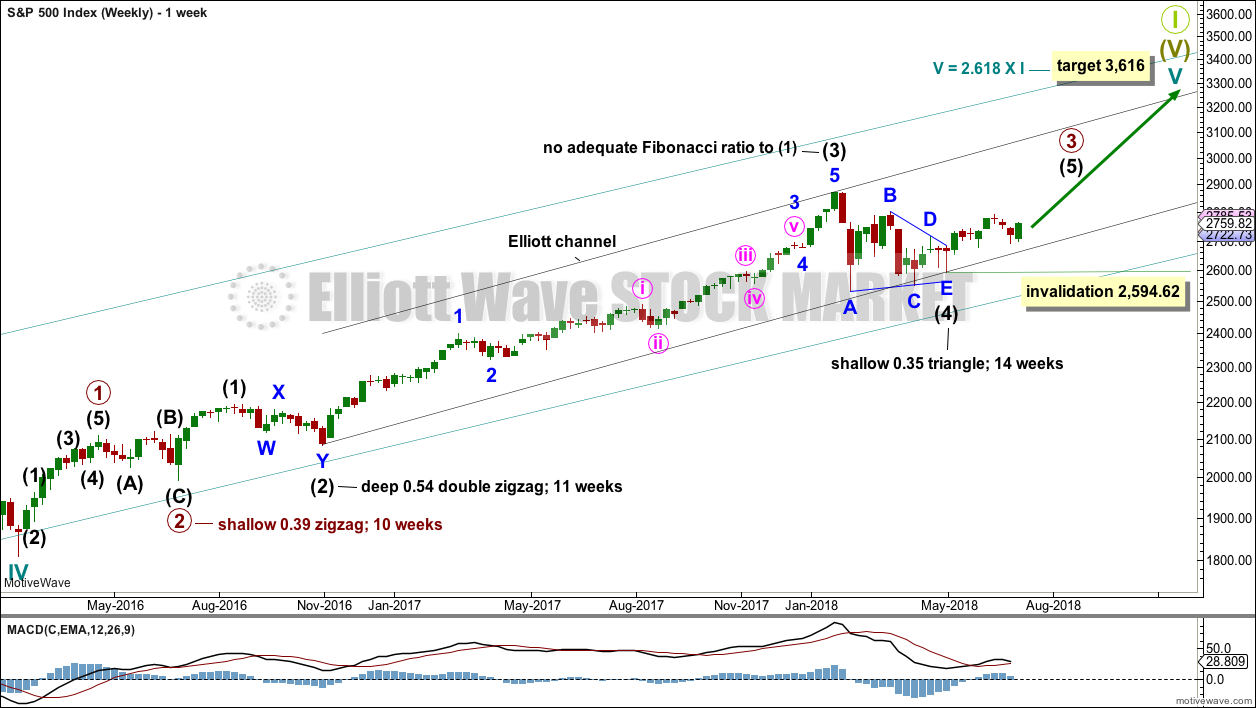
Cycle wave V must complete as a five structure, which should look clear at the weekly chart level and also now at the monthly chart level. It may only be an impulse or ending diagonal. At this stage, it is clear it is an impulse.
Within cycle wave V, the third waves at all degrees may only subdivide as impulses.
Intermediate wave (4) has breached an Elliott channel drawn using Elliott’s first technique. The channel is redrawn using Elliott’s second technique: the first trend line from the ends of intermediate waves (2) to (4), then a parallel copy on the end of intermediate wave (3). Intermediate wave (5) may end either midway within the channel, or about the upper edge.
Intermediate wave (4) may now be a complete regular contracting triangle lasting fourteen weeks, one longer than a Fibonacci thirteen. There is perfect alternation and excellent proportion between intermediate waves (2) and (4).
Within intermediate wave (5), no second wave correction may move beyond the start of its first wave below 2,594.62.
At this stage, the expectation is for the final target to me met in October 2019.
A multi week to multi month consolidation for primary wave 4 is expected on the way up to the final target.
DAILY CHART
Click chart to enlarge.
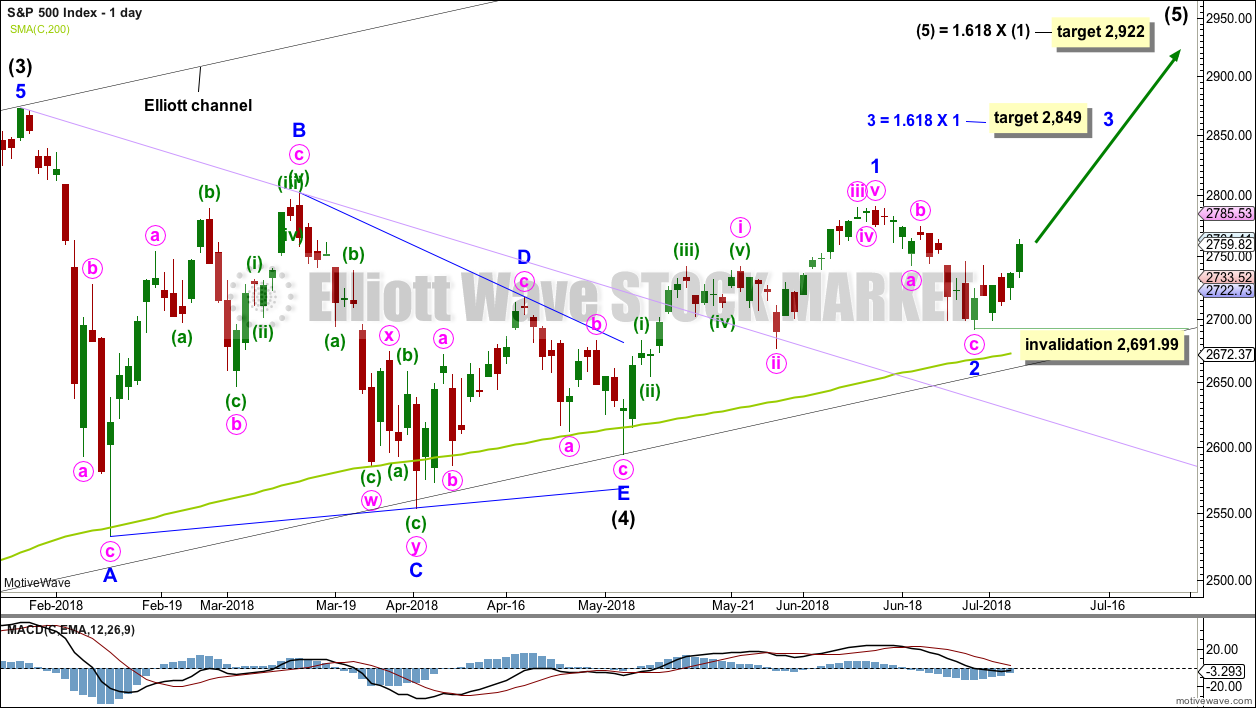
It is possible that intermediate wave (4) is a complete regular contracting triangle, the most common type of triangle. Minor wave E may have found support just below the 200 day moving average and ending reasonably short of the A-C trend line. This is the most common look for E waves of triangles.
Intermediate wave (3) exhibits no Fibonacci ratio to intermediate wave (1). It is more likely then that intermediate wave (5) may exhibit a Fibonacci ratio to either of intermediate waves (1) or (3). The most common Fibonacci ratio would be equality in length with intermediate wave (1), but in this instance that would expect a truncation. The next common Fibonacci ratio is used to calculate a target for intermediate wave (5) to end.
Price has clearly broken out above the upper triangle B-D trend line. This indicates that it should now be over if the triangle is correctly labelled.
A trend line in lilac is added to this chart. It is the same line as the upper edge of the symmetrical triangle on the daily technical analysis chart. Price found support about this line.
Minor wave 1 may have been over at the last high. Minor wave 1 will subdivide as a five wave impulse on the hourly chart; the disproportion between minute waves ii and iv gives it a three wave look at the daily chart time frame. The S&P does not always exhibit good proportions; this is an acceptable wave count for this market.
Minor wave 2 should now be over as a zigzag. Minor wave 3 upwards should have begun, and it should exhibit an increase in upwards momentum over the next week or so.
A target is calculated for minor wave 3 to end.
Within minor wave 3, no second wave correction may move beyond the start of its first wave below 2,691.99.
HOURLY CHART
Click chart to enlarge.
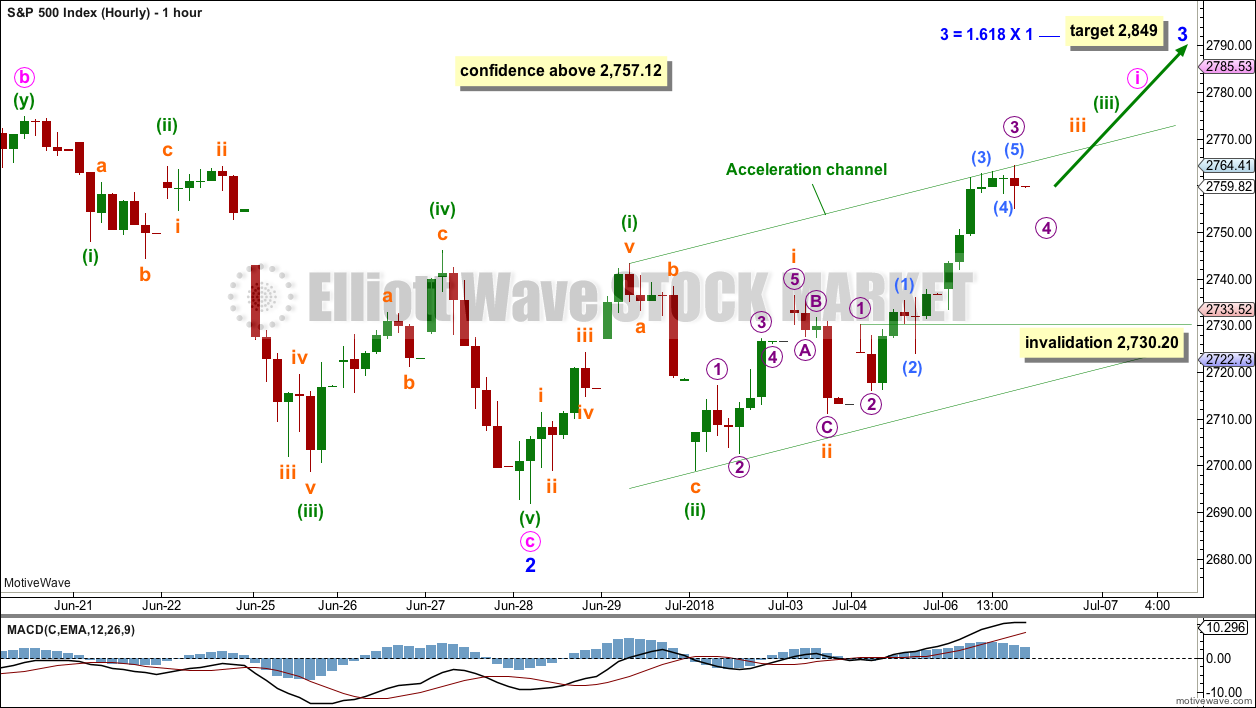
Minor wave 3 may only subdivide as an impulse, and within it minute wave i may be incomplete.
Minute wave i may b unfolding as an impulse, and within it minuette waves (i) and (ii) may be complete.
Minuette wave (iii) may only subdivide as an impulse, and within it subminuette waves i and ii may be complete, and subminuette wave iii may be close to completion. Within the impulse of subminuette wave iii, micro wave 4 may not move into micro wave 1 price territory below 2,730.20.
When price makes a new high, then subminuette wave iii may be complete. The invalidation point must then move up to the high of subminuette wave i at 2,736.58. Subminuette wave iv may not move into subminuette wave i price territory.
Draw an acceleration channel about this upwards movement. Draw the first trend line from the end of minuette wave (i) to the last high, then place a parallel copy on the low of minuette wave (ii). Keep redrawing the channel as price continues higher; the lower edge may show where pullbacks find support.
ALTERNATE DAILY CHART
Click chart to enlarge.
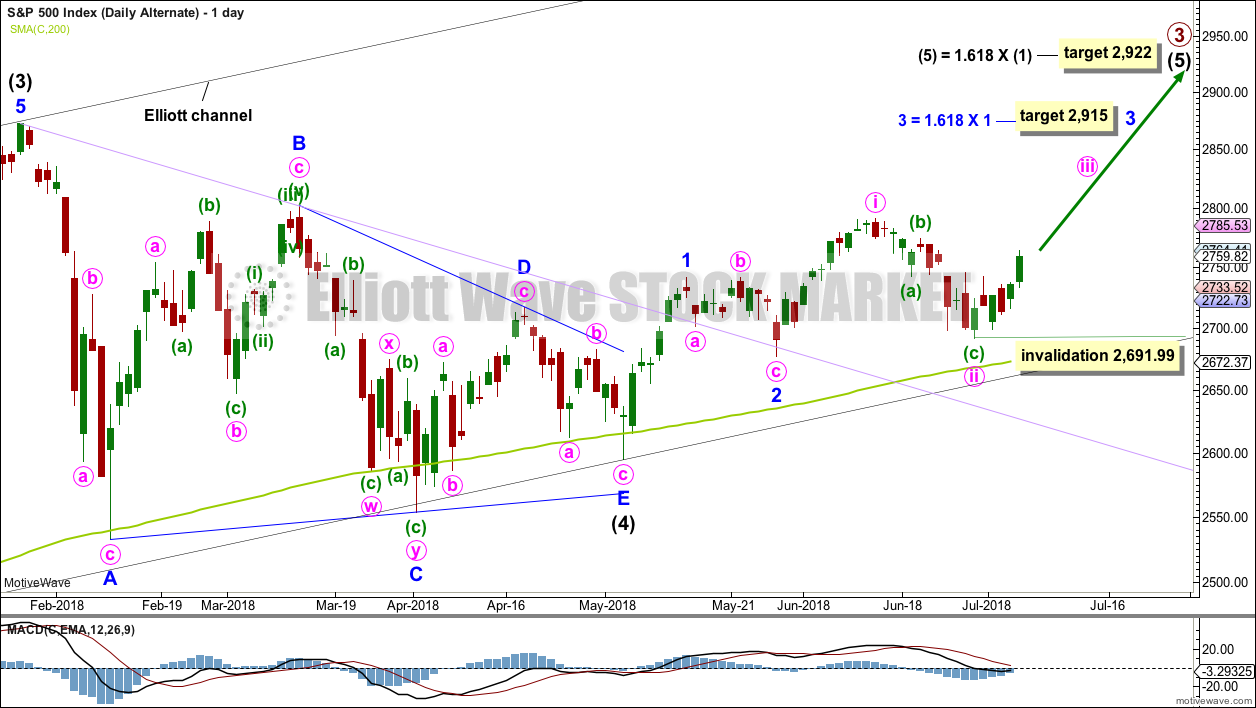
It is possible that minor waves 1 and 2 are already over. The last high may have been minute wave i. Minute wave ii may need one more low to be complete.
Minute wave ii may not move beyond the start of minute wave i below 2,676.81.
This alternate wave count resolves the problem of an odd looking minor wave 1 for the main wave count. The only problem with this alternate wave count is minute wave ii is not contained within a base channel which would be drawn about minor waves 1 and 2.
This wave count is very bullish. It expects to see a very strong upwards movement as the middle of a third wave begins here.
TECHNICAL ANALYSIS
WEEKLY CHART
Click chart to enlarge. Chart courtesy of StockCharts.com.
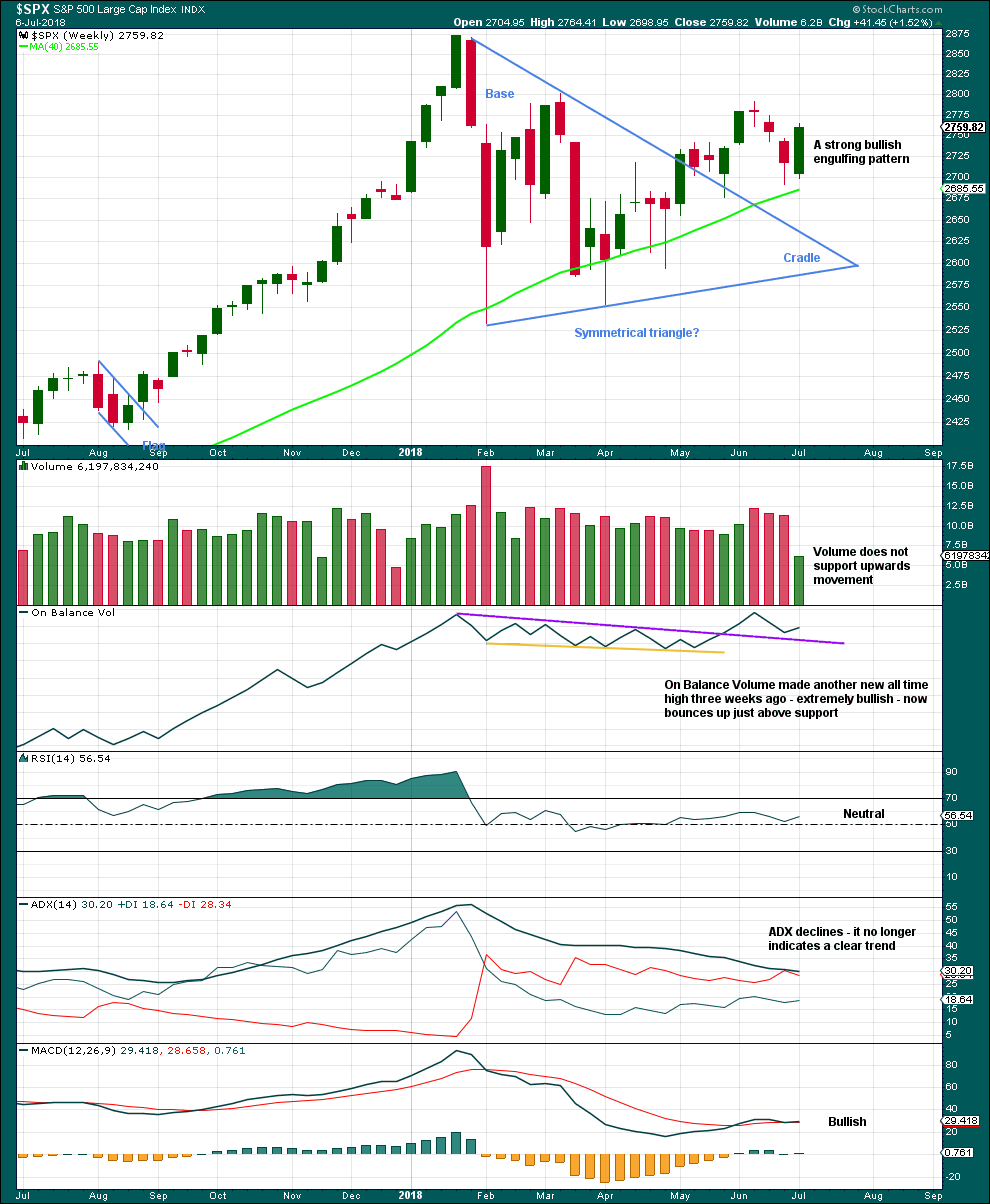
After two weeks of falling price, a strong candlestick reversal pattern on the weekly chart is very bullish.
The lack of volume this week is not of a concern, because this was a short week with one and a half days closed to trading for the 4th of July holiday. We have to look inside this week at daily volume bars to judge the short term volume profile.
DAILY CHART
Click chart to enlarge. Chart courtesy of StockCharts.com.
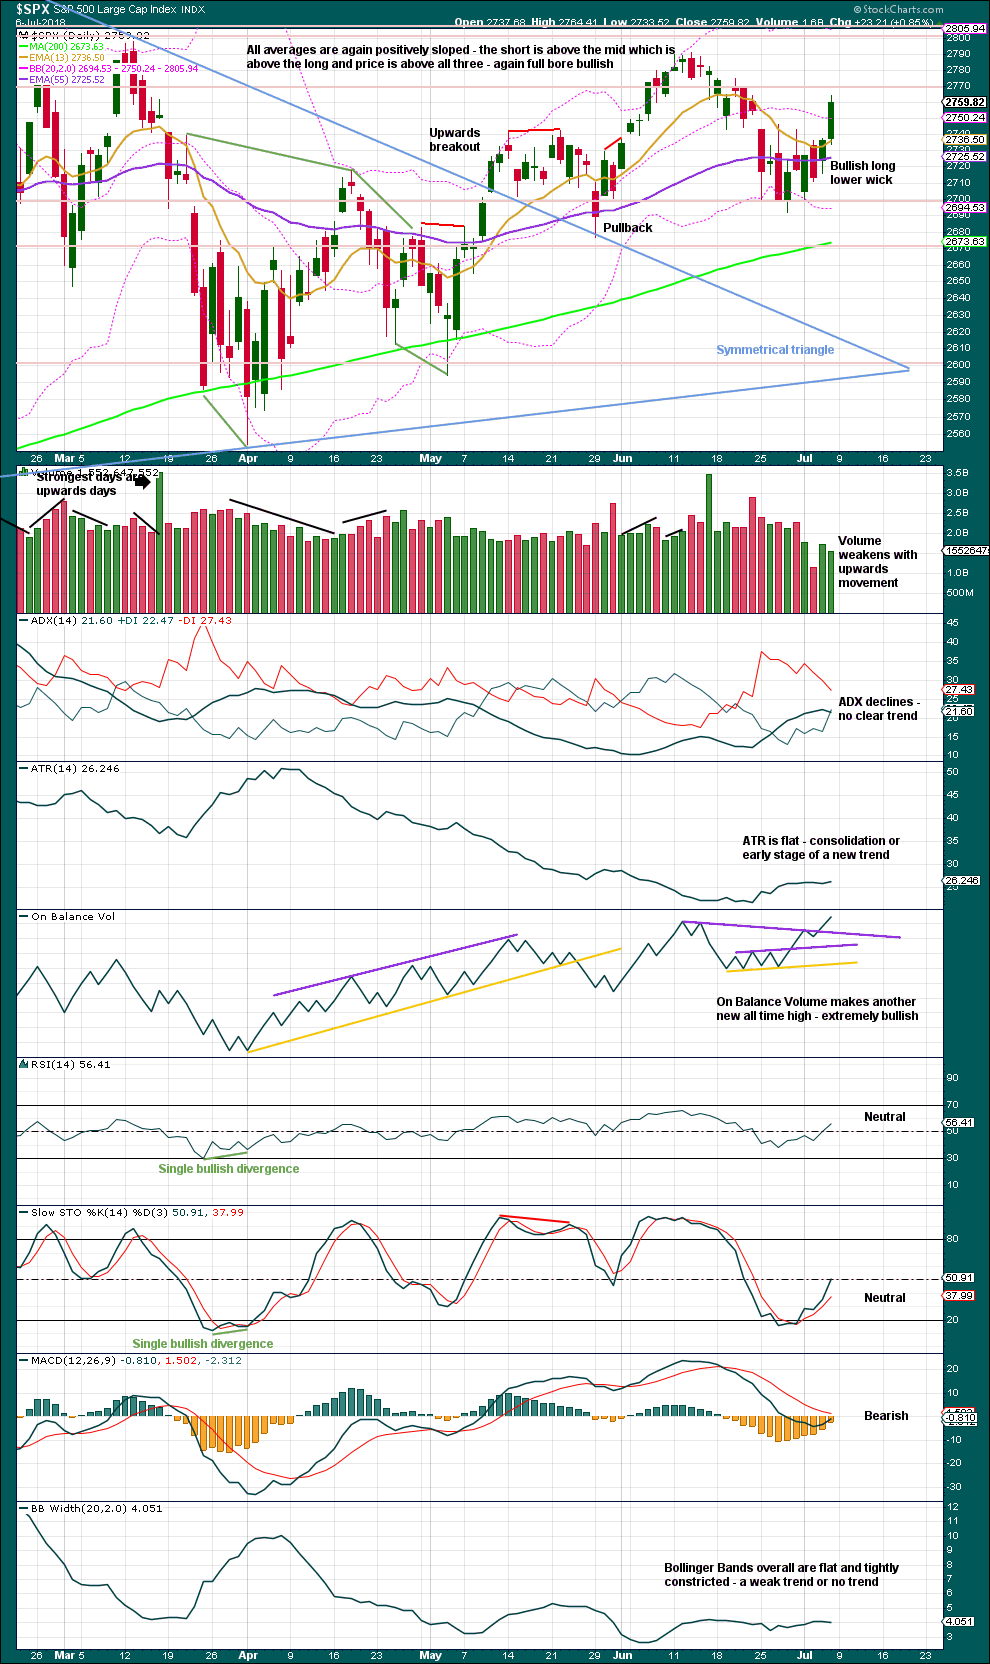
The symmetrical triangle may now be complete. The base distance is 340.18. Added to the breakout point of 2,704.54 this gives a target at 3,044.72. This is above the Elliott wave target at 2,922, so the Elliott wave target may be inadequate.
Since the low on the 2nd of April, 2018, price has made a series of higher highs and higher lows. This is the definition of an upwards trend. But trends do not move in perfectly straight lines; there are pullbacks and bounces along the way. While price has not made a lower low below the prior swing low of the 29th of May, the view of a possible upwards trend in place should remain.
Within the last four trading sessions for this short trading week, it is upwards days that have strongest volume. The short term volume profile is bullish.
A new all time high from On Balance Volume at the daily chart level is extremely bullish and should be given weight in this analysis. This adds confidence to the Elliott wave count.
VOLATILITY – INVERTED VIX CHART
Click chart to enlarge. Chart courtesy of StockCharts.com. So that colour blind members are included, bearish signals
will be noted with blue and bullish signals with yellow.
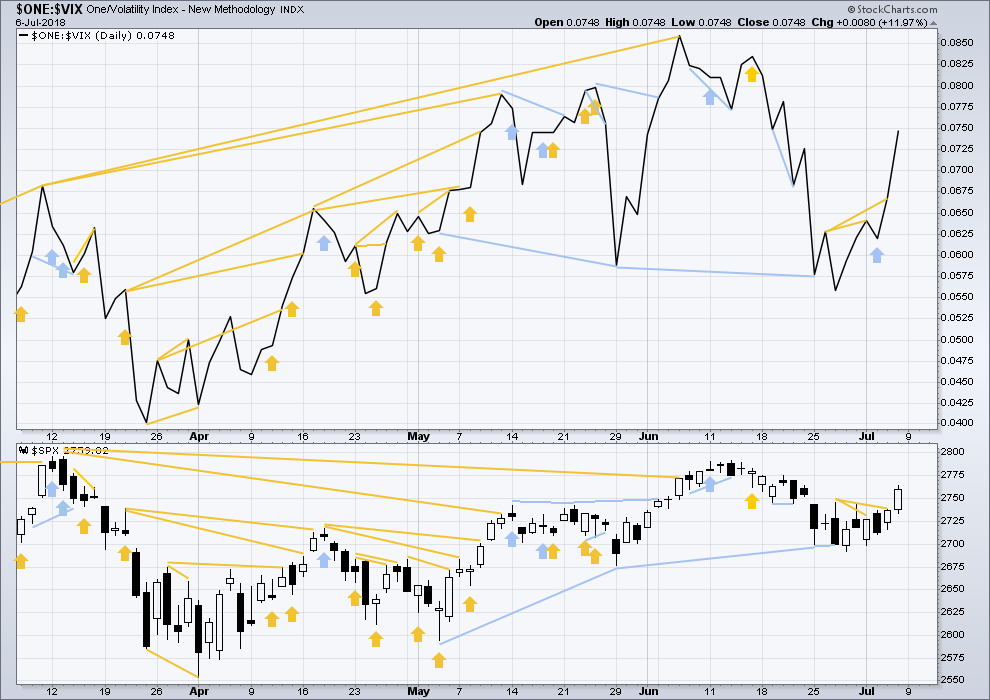
Normally, volatility should decline as price moves higher and increase as price moves lower. This means that normally inverted VIX should move in the same direction as price.
There is mid term bearish divergence between price and inverted VIX: inverted VIX has made a new swing low below the prior swing low of the 29th of May, but price has not. Downwards movement has strong support from increasing market volatility; this divergence is bearish. However, it must be noted that the last swing low of the 29th of May also came with bearish divergence between price and inverted VIX, yet price went on to make new highs.
This divergence may not be reliable. As it contradicts messages given by On Balance Volume and the AD line, it shall not be given much weight in this analysis.
Short term bullish divergence noted in last analysis has now been followed by upwards movement from price. It may be resolved here, or it may yet be followed by more upwards movement before it is resolved.
BREADTH – AD LINE
Click chart to enlarge. Chart courtesy of StockCharts.com.
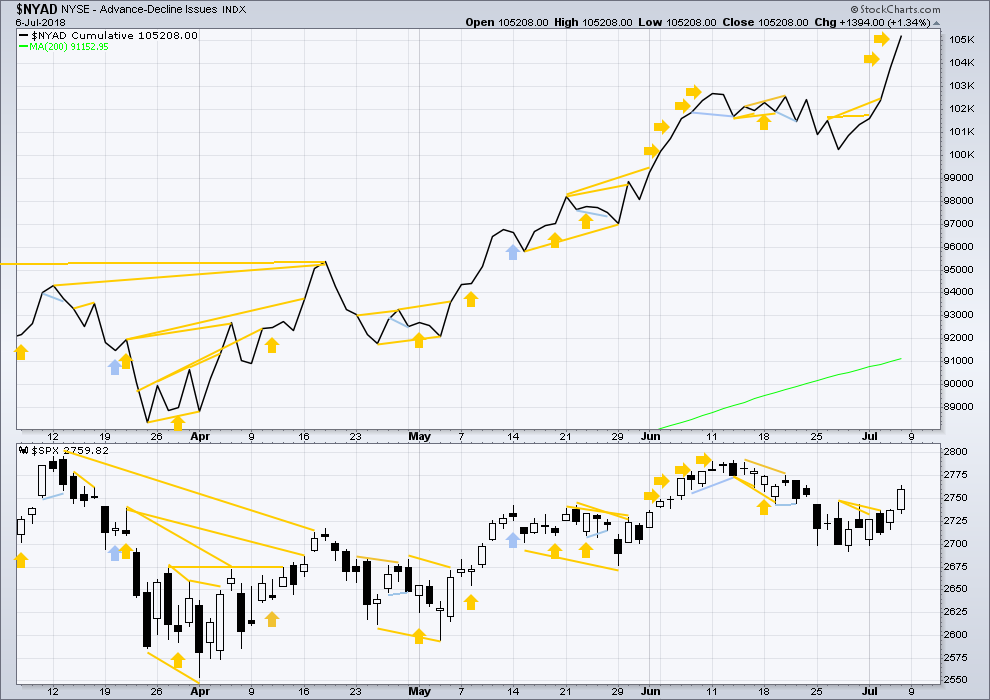
There is normally 4-6 months divergence between price and market breadth prior to a full fledged bear market. This has been so for all major bear markets within the last 90 odd years. With no longer term divergence yet at this point, any decline in price should be expected to be a pullback within an ongoing bull market and not necessarily the start of a bear market. New all time highs from the AD line means that any bear market may now be an absolute minimum of 4 months away. It may of course be a lot longer than that. My next expectation for the end of this bull market may now be October 2019.
All of small, mid and large caps have moved higher this week. Small caps have made new all time highs as recently as 20th of June. The small caps may be leading the market as they tend to in the latter stages of an ageing bull market.
Breadth should be read as a leading indicator.
The AD line today makes yet another new all time high. This is extremely bullish and strongly supports the main Elliott wave count at the daily and weekly chart levels.
Price may reasonably be expected to follow through in coming weeks.
DOW THEORY
The following lows need to be exceeded for Dow Theory to confirm the end of the bull market and a change to a bear market:
DJIA: 23,360.29.
DJT: 9,806.79.
S&P500: 2,532.69.
Nasdaq: 6,630.67.
Only Nasdaq at this stage is making new all time highs. DJIA and DJT need to make new all time highs for the ongoing bull market to be confirmed.
Charts showing each prior major swing low used for Dow Theory may be seen at the end of this analysis here.
Published @ 11:58 p.m. EST.
the sequence may now be up to subminuette iii. the invalidation point moves up to the end of subminuette i
however, this labelling would now see the middle of the third wave passed.
i may need to move it all down one degree
if my labelling is wrong, it may not be bullish enough.
I mentioned AMTD looked like it was bottoming last Friday. Up 2.6% today. Lots of room to rumble to the upside, assuming the overall market cooperates (which appears likely). Broken the steepest daily down trend line, and pushed against the last daily down trend line. The hourly has polarity inverted to “up”. Excellent set up.
Your suggestions work out more often than not Kevin. MTDR, AMTD, ABBV… and probably many others I might have missed…
Thanks for all your input on this forum.
Made a nice trade on GS I had opened yesterday…
XOP looks like it has tremendous room to move upward over the next few weeks/months. I’ve used a call ratio backspread for Sept to take advantage of the opportunity for a large move, with very limited risk.
Hi Kevin , can explain your call ratio backspread ?
What was your play ? Call spread ?
Sure Fred. I sold ONE sept 21 XOP call strike 43, and bought TWO sept 21 XOP calls strike 46. It’s an interesting profit/loss graph. Key is to avoid the “hole” in the middle; we want the underlying XOP price to move one way or another! If it stays or heads back to the “hole zone” and time is wasting, time to bail.
Got it . Thank you – I did look it up on investopedia . Was very interested in if you sold in the money call . It does look about to break to the upside after some back-filling of the 40 to 44 zone . Thank you Kevin
Just a curious question: Lara’s oil count is suggesting US oil to correct down to low 60’s in an intermediate 4 correction… but a long term target well into triple digits.
And oil seems to be at a high resistance point now near 75…
Wouldn’t this correction (if it happens) also make XOP correct a little bit… I know they’re separate markets and the stocks/ETF’s may lead the actual commodity price…
But what’s your opinion on oil itself Kevin? Thanks in advance…
It’s the first up day in finance in what, 10,000 years? Something like that. XLF showing up 1.5%. GS at 226 and up over 2% after four tags of a bottom at 218 over the last two weeks. Bonds falling just a little; if they turn back up, that could stop the finance train quickly. As I’ve said several times, SPX absolutely needs financial participation to really move to the upside.
XLF now up 2.25%, wow. I can use that….
there’s a big volume hole on the SPX/SPY hourly that price has entered (277-278). Next volume node up at 279. Don’t expect price stability in the 277-278 range…it’s going up and through or back down.
On the first try SPX/SPY hasn’t make it through this volume gap. Right to middle and now pausing and maybe (?) turning back down. So it may take another day and another try to get up pass it.
that’s an absolutely brilliant chart Kevin!
a great way to show resistance / support ahead
It’s the “volume profile” study in ToS. I like to look at the daily but really work with it at the hourly. It doesn’t work of course on indexes, you need actual volume associated with a traded instrument, but /ES and SPY both work fine. And any stock or ETF, of course. The center dark line is a “center of mass” and a kind of gravity point, which price migrates to and then away from. The outer lines represent (in total price range) the 60% (by default) of volume area. And pragmatically, it’s about as simple as “price doesn’t like being in the holes”!!!
thank you Kevin for the explanation.
Key decision levels and four possible turn zones in time and price.
Note there is a now a completed head&shoulders bottom on the SPX hourly. Looking lovely for the those long!
Hi Lara,
When do you think the main or the alternate daily counts will be “the count” if the market keeps going up thereby not approaching the invalidation points?
Thanks
Peter
Maybe I’ve answered my question by thinking the alternate should really start to take off soon in a strong 3 of 3 move ?
My thought is that the Alternate Daily will become the main count in time. My reasons are that:
1) The Alternate Daily count has a much better look. The current main daily count has that 3 wave look.
2) Classic TA indicates the breakout of the triangle (Intermediate Wave 4) will carry to slightly above 3000. The SPX may blast through 2800 this time around and shoot right towards 2900 leaving behind those who are not currently long. We could see the “fear of missing out” crowd come in and push the SPX up to 3000 just in time to end Primary 3.
Once Primary 3 ends around 3000, we will see the next large correction. It could go to about 2500-2800 which would be the next good buying long opportunity for the move to 3600.
These are my thoughts. Fantasy perhaps as some might say, especially the perennial bears. But Lara’s EW analysis seems to support such thoughts.
Have a great week all.
I agree with you both.
The alternate daily may well become the main count sooner rather than later.
I’ll swap them over now, and leave them to run side by side for maybe another week before price shows one to be so very unlikely.