
A new low below 2,742.24 at the start of the session indicated an alternate Elliott wave count was correct, which expected a deeper pullback to about 2,721. Price moved lower to reach down to 2,698.67.
Summary: It looks likely that price may bounce strongly from here. The short term target is now at 2,896.
If price does move lower, then it may find next support about 2,670. The invalidation point must remain at 2,594.62.
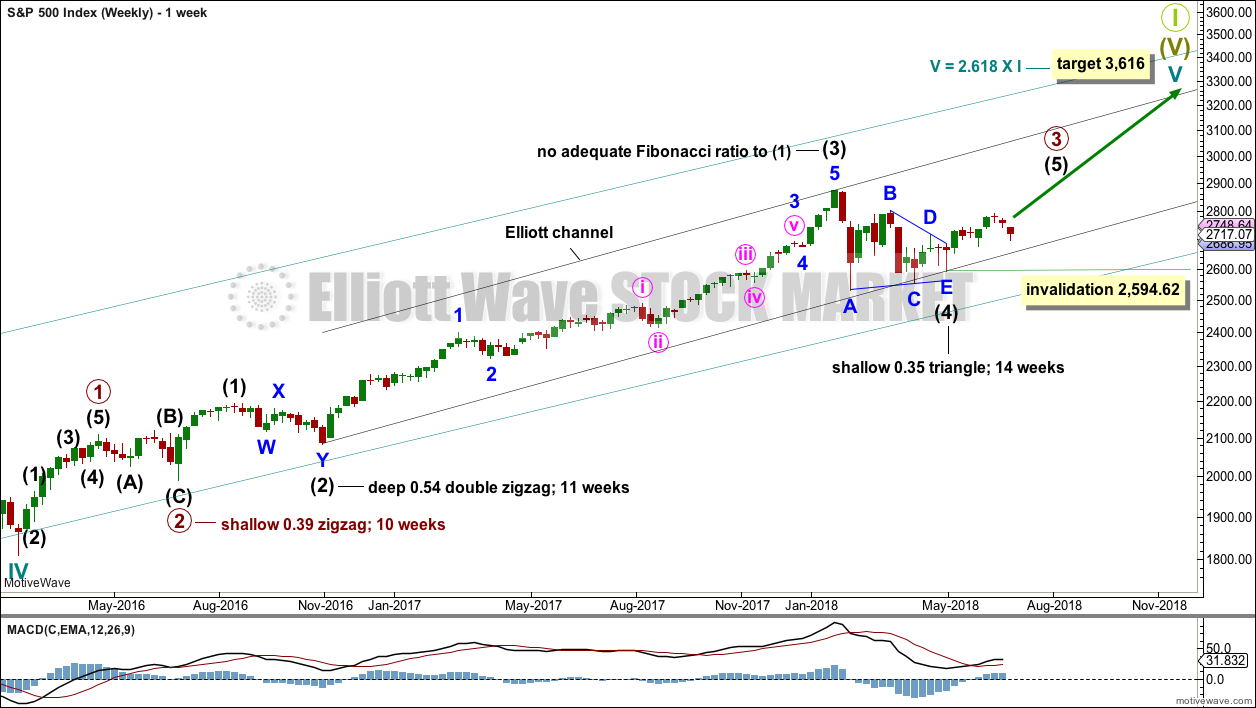
The mid to longer term target is at 2,922 (Elliott wave) or 3,045 (classic analysis). Another multi week to multi month correction is expected at one of these targets.
The final target for this bull market to end remains at 3,616.
Pullbacks are an opportunity to join the trend.
Always practice good risk management. Always trade with stops and invest only 1-5% of equity on any one trade.
New updates to this analysis are in bold.
The biggest picture, Grand Super Cycle analysis, is here.
Last historic analysis with monthly charts is here, video is here.
ELLIOTT WAVE COUNT
WEEKLY CHART
Click chart to enlarge.
Cycle wave V must complete as a five structure, which should look clear at the weekly chart level and also now at the monthly chart level. It may only be an impulse or ending diagonal. At this stage, it is clear it is an impulse.
Within cycle wave V, the third waves at all degrees may only subdivide as impulses.
Intermediate wave (4) has breached an Elliott channel drawn using Elliott’s first technique. The channel is redrawn using Elliott’s second technique: the first trend line from the ends of intermediate waves (2) to (4), then a parallel copy on the end of intermediate wave (3). Intermediate wave (5) may end either midway within the channel, or about the upper edge.
Intermediate wave (4) may now be a complete regular contracting triangle lasting fourteen weeks, one longer than a Fibonacci thirteen. There is perfect alternation and excellent proportion between intermediate waves (2) and (4).
Within intermediate wave (5), no second wave correction may move beyond the start of its first wave below 2,594.62.
DAILY CHART
Click chart to enlarge.
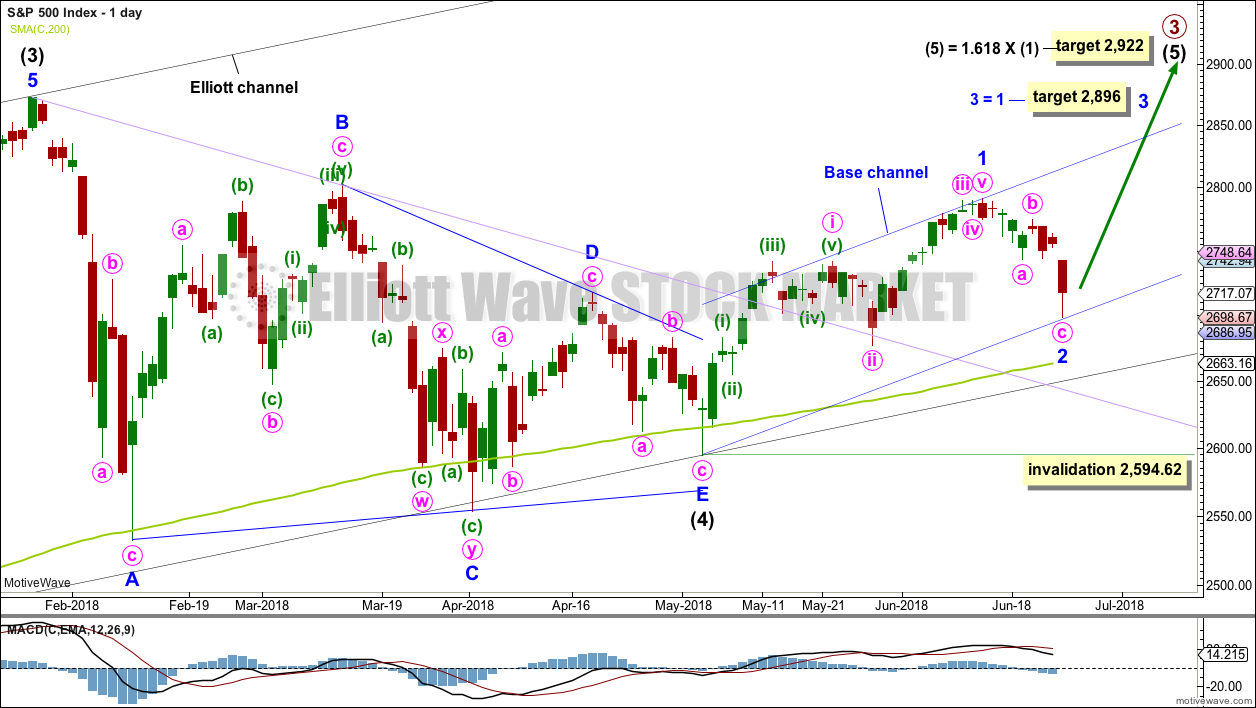
It is possible that intermediate wave (4) is a complete regular contracting triangle, the most common type of triangle. Minor wave E may have found support just below the 200 day moving average and ending reasonably short of the A-C trend line. This is the most common look for E waves of triangles.
Intermediate wave (3) exhibits no Fibonacci ratio to intermediate wave (1). It is more likely then that intermediate wave (5) may exhibit a Fibonacci ratio to either of intermediate waves (1) or (3). The most common Fibonacci ratio would be equality in length with intermediate wave (1), but in this instance that would expect a truncation. The next common Fibonacci ratio is used to calculate a target for intermediate wave (5) to end.
Price has clearly broken out above the upper triangle B-D trend line. This indicates that it should now be over if the triangle is correctly labelled.
A trend line in lilac is added to this chart. It is the same line as the upper edge of the symmetrical triangle on the daily technical analysis chart. Price found support about this line.
Strong downwards movement today now looks large enough to be minor wave 2. It may be over at today’s low.
Minor wave 1 may have been over at the last high. Minor wave 1 will subdivide as a five wave impulse on the hourly chart; the disproportion between minute waves ii and iv gives it a three wave look at the daily chart time frame. The S&P does not always exhibit good proportions; this is an acceptable wave count for this market.
If minor wave 2 is over here, then subsequent corrections along the way up may find support at the lower edge of the base channel. If minor wave 2 moves lower, then the base channel must be redrawn.
A target is calculated for minor wave 3, which fits with the higher target for intermediate wave (5).
Minor wave 2 may not move beyond the start of minor wave 1 below 2,594.62.
HOURLY CHART
Click chart to enlarge.
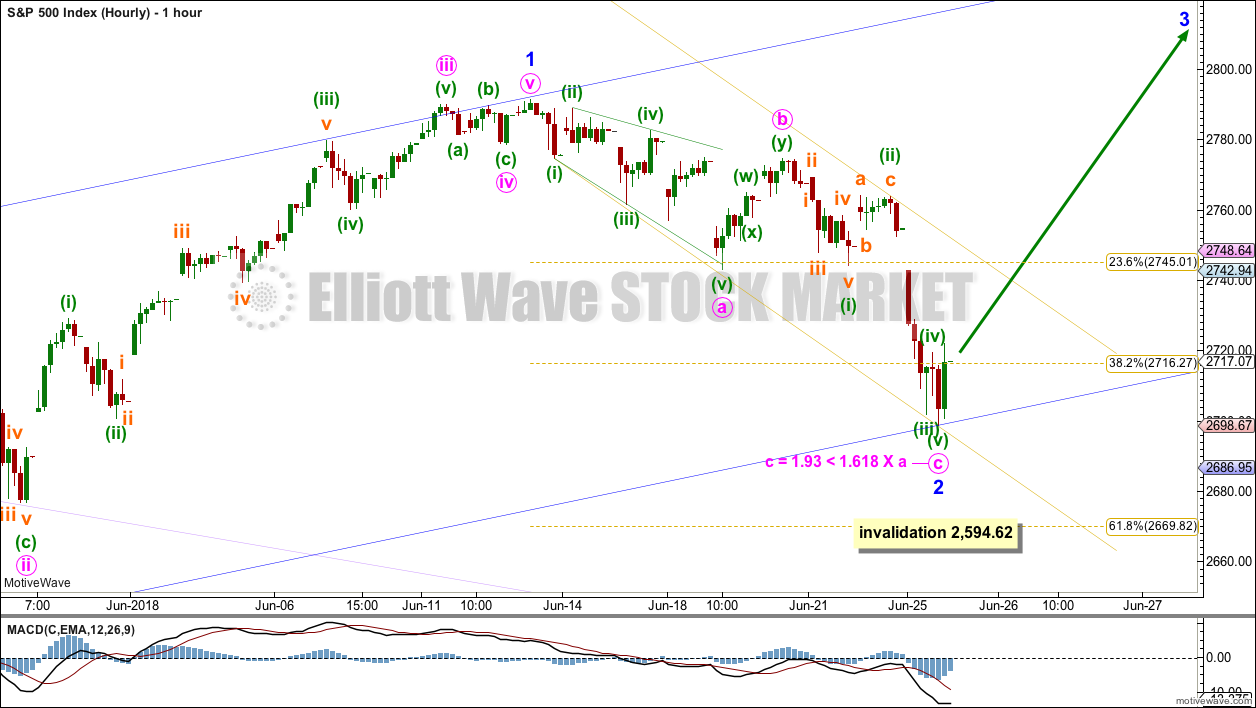
Minor wave 2 fits as a single zigzag ending short of the 0.618 Fibonacci ratio. There is a good Fibonacci ratio within it between minute waves a and c.
A tentative best fit channel is drawn about the zigzag of minor wave 2. If price breaks above the upper edge of this channel, then a little confidence may be had that a low may be in place.
Minor wave 2 may not move beyond the start of minor wave 1 below 2,594.62.
TECHNICAL ANALYSIS
WEEKLY CHART
Click chart to enlarge. Chart courtesy of StockCharts.com.
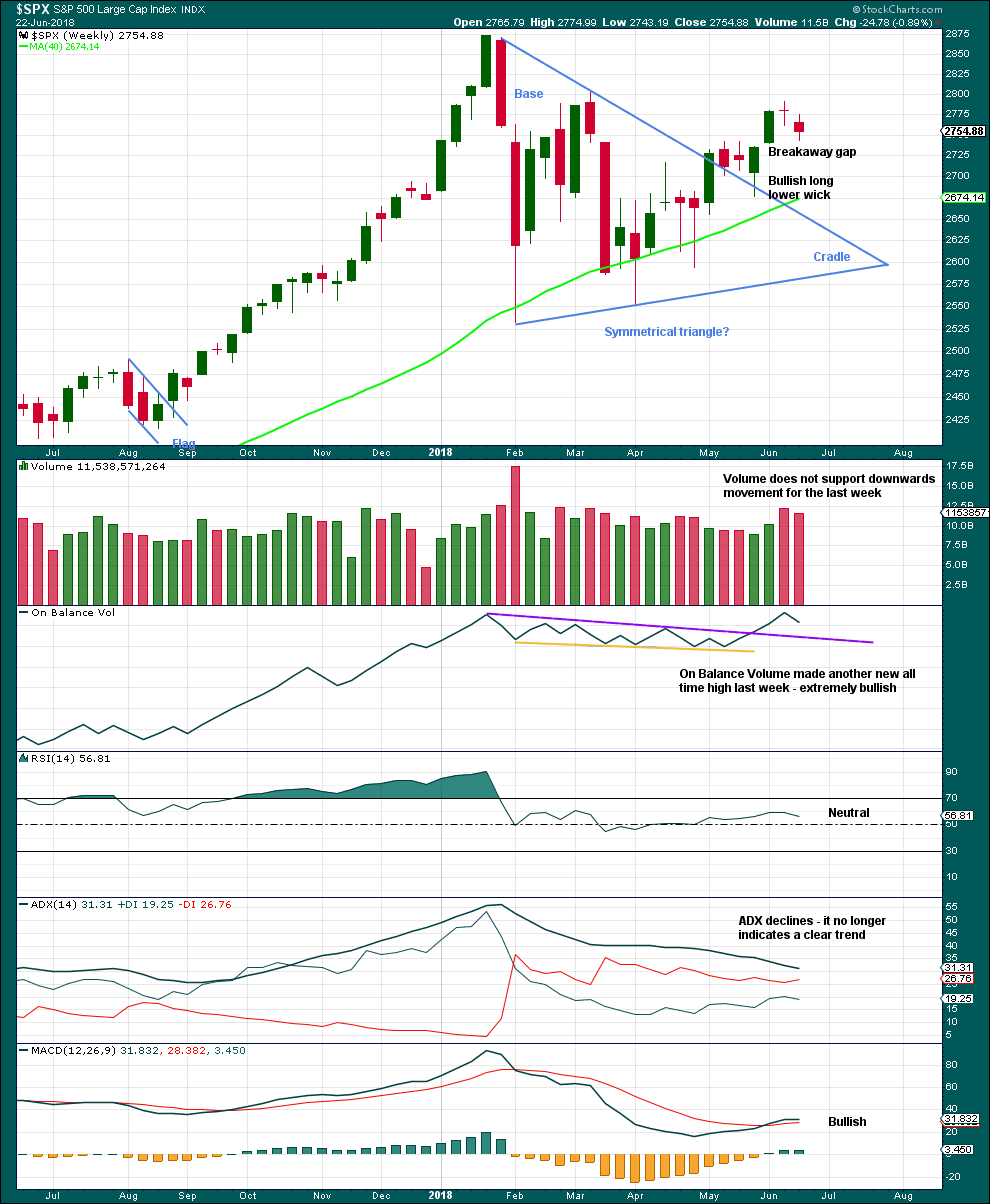
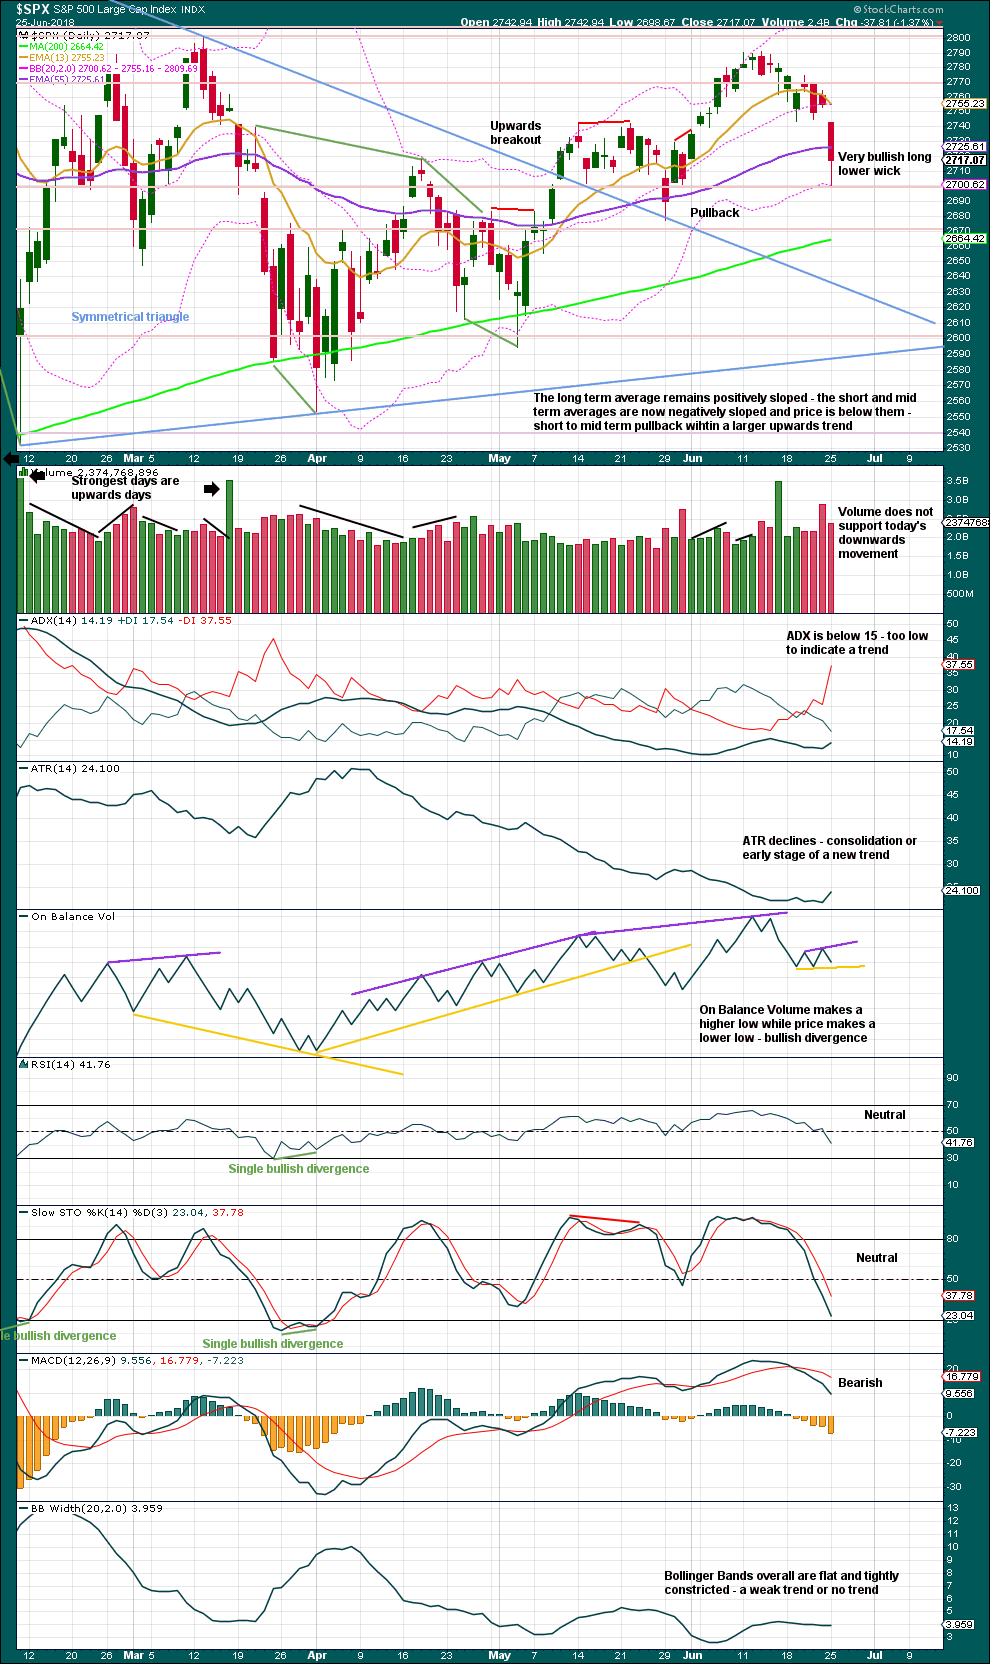
Last week’s spinning top candlestick pattern again signals a balance of bulls and bears. With volume not supporting downwards movement, it looks like bears may be tiring.
This chart is very bullish.
DAILY CHART
Click chart to enlarge. Chart courtesy of StockCharts.com.
The symmetrical triangle may now be complete. The base distance is 340.18. Added to the breakout point of 2,704.54 this gives a target at 3,044.72. This is above the Elliott wave target at 2,922, so the Elliott wave target may be inadequate.
Since the low on the 2nd of April, 2018, price has made a series of higher highs and higher lows. This is the definition of an upwards trend. But trends do not move in perfectly straight lines; there are pullbacks and bounces along the way. While price has not made a lower low below the prior swing low of the 29th of May, the view of a possible upwards trend in place should remain.
Today’s low is right about support at about 2,700. The long lower wick is very bullish, and with a series of long lower wicks within this pullback, together they may be read as a warning sign that on each of those days the bears were not able to hold the lows. This is bullish.
Price today made a new low substantially below the prior low three sessions ago of the 21st of June, but On Balance Volume has made a higher low. Downwards movement does not have support from a declining balance of volume. This divergence is bullish.
So far this looks like a typical pullback within an ongoing and developing upwards trend.
VOLATILITY – INVERTED VIX CHART
Click chart to enlarge. Chart courtesy of StockCharts.com. So that colour blind members are included, bearish signals
will be noted with blue and bullish signals with yellow.
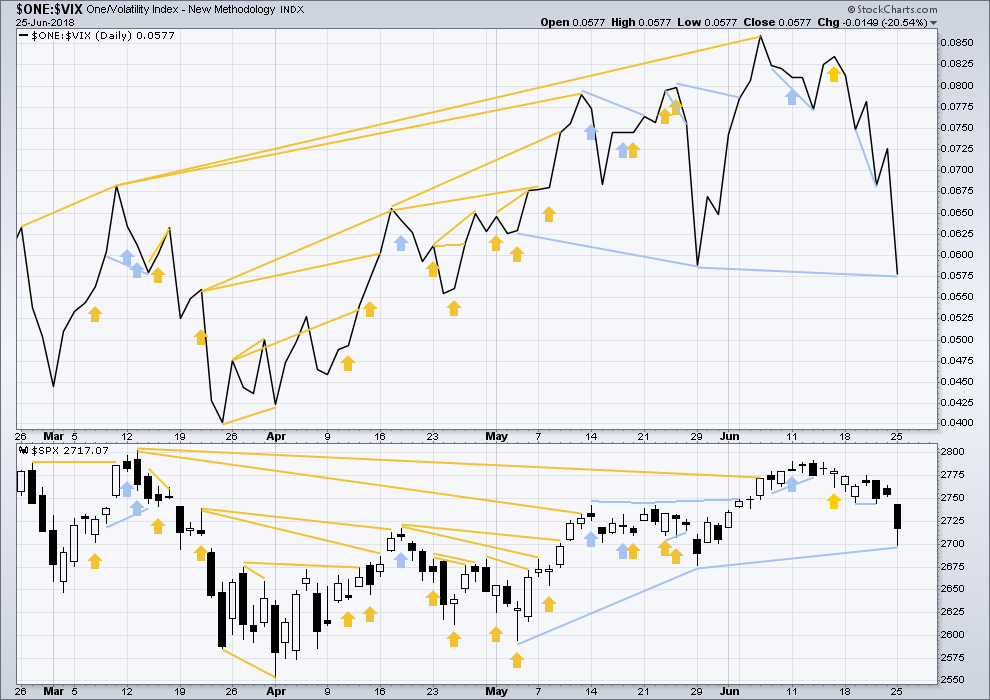
Normally, volatility should decline as price moves higher and increase as price moves lower. This means that normally inverted VIX should move in the same direction as price.
Inverted VIX has made a new high above the prior swing high of the 9th of March, but price has not made a corresponding new swing high about the same point yet. This divergence is bullish. Inverted VIX is still a little way off making a new all time high.
There is new mid term bearish divergence between price and inverted VIX: inverted VIX has made a new swing low below the prior swing low of the 29th of May, but price has not. Downwards movement has strong support from increasing market volatility; this divergence is bearish. However, it must be noted that the last swing low of the 29th of May also came with bearish divergence between price and inverted VIX, yet price went on to make new highs.
This divergence may not be reliable. As it contradicts messages given by On Balance Volume and the AD line, it shall not be given much weight in this analysis.
BREADTH – AD LINE
Click chart to enlarge. Chart courtesy of StockCharts.com.
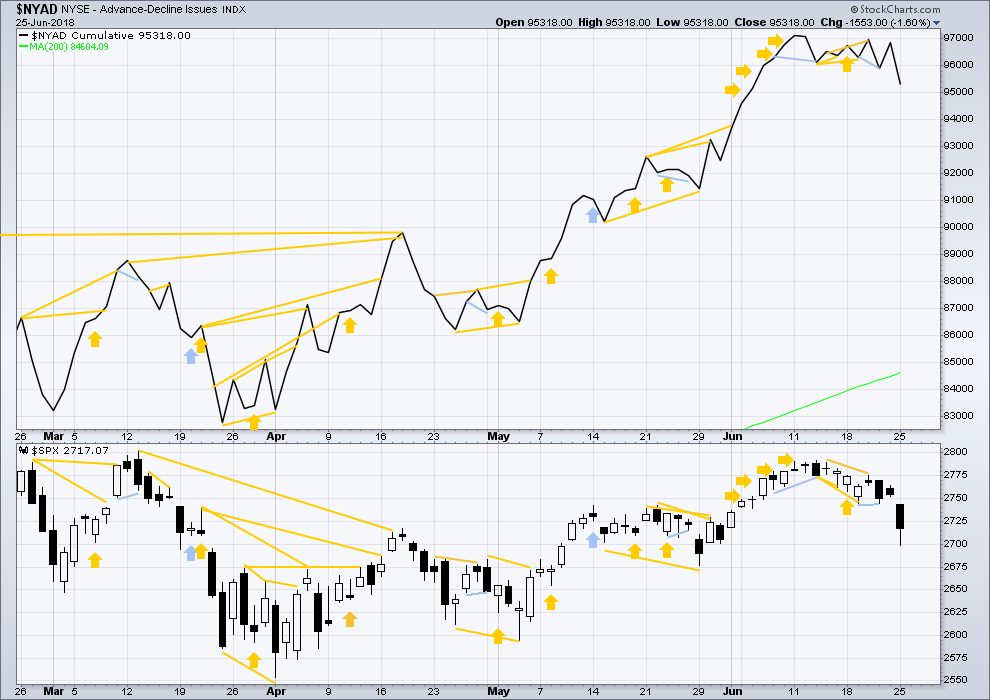
There is normally 4-6 months divergence between price and market breadth prior to a full fledged bear market. This has been so for all major bear markets within the last 90 odd years. With no longer term divergence yet at this point, any decline in price should be expected to be a pullback within an ongoing bull market and not necessarily the start of a bear market. New all time highs from the AD line means that any bear market may now be an absolute minimum of 4 months away. It may of course be a lot longer than that. My next expectation for the end of this bull market may now be October 2019.
Small caps and mid caps have both recently made new all time highs. It is large caps that usually lag in the latter stages of a bull market, so this perfectly fits the Elliott wave count. Expect large caps to follow to new all time highs.
Breadth should be read as a leading indicator.
Bearish divergence noted two sessions ago has now been followed by substantial downwards movement. It may now be resolved.
Both price and the AD line moved lower today. There is no new divergence.
Overall, the AD line still remains mostly bullish as it has made more than one new all time high last week. Price may reasonably be expected to follow through in coming weeks.
DOW THEORY
The following lows need to be exceeded for Dow Theory to confirm the end of the bull market and a change to a bear market:
DJIA: 23,360.29.
DJT: 9,806.79.
S&P500: 2,532.69.
Nasdaq: 6,630.67.
Only Nasdaq at this stage is making new all time highs. DJIA and DJT need to make new all time highs for the ongoing bull market to be confirmed.
Charts showing each prior major swing low used for Dow Theory may be seen at the end of this analysis here.
Published @ 08:26 p.m. EST.
I’m going to tentatively label the hourly chart like this, but I’m also going to have to have an alternate that sees today’s bounce as minuette (iv) within minute c, and one final low yet to come.
Looks like one more low yet to come….
Action a bit sluggish for start of a third up… 🙂
Alright, class… listen up! This, right here, is exactly why I allow Lara to keep pinging my Paypal account every month.
There is no plausible alternate that she fails to consider. Good work, Lara! Thank you so much!
*bushing*
thank you very much Chris!
Curtis, not Chris.
And not Peter!
Great. In my defence, only one coffee so far this morning.
I am sorry Curtis.
Lara, what do you think of my possibility as mentioned in today’s first comment ?
Thanks
Peter
I gave a long reply to it below.
okay, sorry, no I didn’t
will reply now
Ha so many Peters !
yes indeed
I see some fun and games in comments today for Peters… LOL
Looks like a close of FXE below 112 will unceremoniously eject me from bull credit spread. Let’s see how it closes. I think this move up is corrective so will be looking for
re-entry…
FXE has bounced twice now off the 50% of the multi-year move up. And channeling sideways now between that 50% at 110.5 and the 38% at 113.
I won’t take this long. I will consider it if the recent highs at 113.52 get exceeded, followed by a proper set up. Without that, price is likely headed further down after this consolidation phase, to at least the 62% at 108. 50% levels often slow a trend; they don’t as often turn a trend, in my experience (Lara doesn’t even include them, for example).
Just how I see it. YMMV!
Yep. I thought the dollar still had a C leg down of an abc correction for a fourth wave but that could be done. Still a possibility of an expanded flat with a C down to come which would take the Euro temporarily higher but so far it ain’t happening.
Oil is off like a rocket again today.
Now that’s it’s past the 78% retrace, it’s very likely the up move will continue to the 128% extension, over time. I got some underwater HAL and OIH that could sure benefit! And FANG (green but lots more is fine!).
3 Peters on the forum so far…. must be a great place!
Pumpkin Eaters? 😀
They all pick pecks of pickled pepper, I hear…
Now if 3 Peters picked pecks of pickled peppers, how many pickled peppers did all the Peters pick?
Particularly burnt pumpkin. Delicious !
Lara,
I’m wondering if it is possible that we are actually in Primary Wave 4 rather than Intermediate Wave 5. If price were to continue sideways/lower (and perhaps below) the recent lows of Intermediate Wave 4, is that something that you would consider? I’m not sure how to count that (I presume some sort of flat or combination). Of course, this assumes we don’t head to all-time highs soon.
Thanks,
Peter
I’ve considered this possibility and tried to chart it.
The problem (and it’s a really big one) is where exactly would intermediate (4) be?
It would have to be one of the corrections that lasted a maximum of only 4 weeks within that wave on the weekly chart that I have labelled intermediate (3). And that would give horrible proportions.
Also, from a classic TA POV, the AD line has made new all time highs. It needs to show a bare minimum of 4 months divergence with price before primary 5 can be over. I don’t see that as very likely that primary 4 unfolds with new ATH’s of the AD line, then that means as primary 5 makes new ATH’s for price the AD line would too. There could be no divergence? That would be the first time in almost 100 years a bull market has ended without that divergence.
And finally, if primary 4 is continuing right now then it is now much longer in duration than primary 2, and much larger as well. The proportions look horrible.
So, for a multiple of reasons I’ve discarded the idea. I do have it charted, and it looks awful, and I am considering it, but I’m not happy to publish such an idea. Only if price proves this most unlikely of ideas is correct shall I actually publish it.
INTC on a monthly chart.
Does a long term chart get more bearish?
48.3 a bit below market (though it’s falling fast!) is the 38% and it’s very likely to bounce significantly off that, and do a B wave up.
That’s the set up I’m stalking. Sell triggers on a completed B wave up.
Problem with that being, that set up won’t arrive for months! So it’s down to the hourly here for me, looking for a bounce off that 38% fibo and then a good short set up thereafter.
This is going to be a dead weight on the the QQQ’s and SPX for quite awhile.
Has anyone noticed ABBV the last few days? Sitting on seemingly strong support, 4th day today under its lower BB… I’m considering opening a long position during this potential minor or minute 3rd wave up. If that’s what we’re in anyway… lol
i’m long abbv. yes, it’s a reasonably bullish set up. I think IBB is setting up well too and carries far less “stochastic shock” (sudden huge selloff) risk.
We may see an interim low today to usher in the full moon. A slightly lower high in VIX might be indicating a fifth wave if it comes with a move below yesterday’s low.
I will be exiting remaining short positions at the open and lookiing for rversal signs.
An RSI bottom and positive momentum divergence at new lows are examples, especially a positive MACD cross.
Traders need to be careful. Nasdaq has issued a strong sell signal and SPX is unlikely to diverge as it is fairly tech heavy. Have a great trading day.
Hi Lara,
Re Daily chart, I’m thinking 5 up to May 14 for Minor 1, then expanded flat for Minor 2 to May 29 low.
Then 5 up for Minute [i] to June 13 then [ii] to yesterday’s low?
IMO it just seems to “look” better
I’ll chart it and take a look. Let’s see… may be another good alternate. Thanks Peter.
That looks pretty good. The expanded flat idea for minor 2 means it has good proportion. The only problem I can see is minute ii doesn’t fit nicely in a base channel, but then, this is the S&P. It just does not play nicely with channels.
I’ll use this idea as an alternate today. Will be published very soon….