
A small inside day, closing red, mostly fits the Elliott wave count for the short term.
Price remains above the invalidation point, which is very close by.
Summary: Upwards movement looks most likely next week. The short term target is about 2,844, where a larger pullback may develop.
Overall, an upwards trend is still expected to be developing.
The mid to longer term target is at 2,922 (Elliott wave) or 3,045 (classic analysis). Another multi week to multi month correction is expected at one of these targets.
The final target for this bull market to end remains at 3,616.
Pullbacks are an opportunity to join the trend.
Always practice good risk management. Always trade with stops and invest only 1-5% of equity on any one trade.
New updates to this analysis are in bold.
The biggest picture, Grand Super Cycle analysis, is here.
Last historic analysis with monthly charts is here, video is here.
ELLIOTT WAVE COUNT
WEEKLY CHART
Click chart to enlarge.
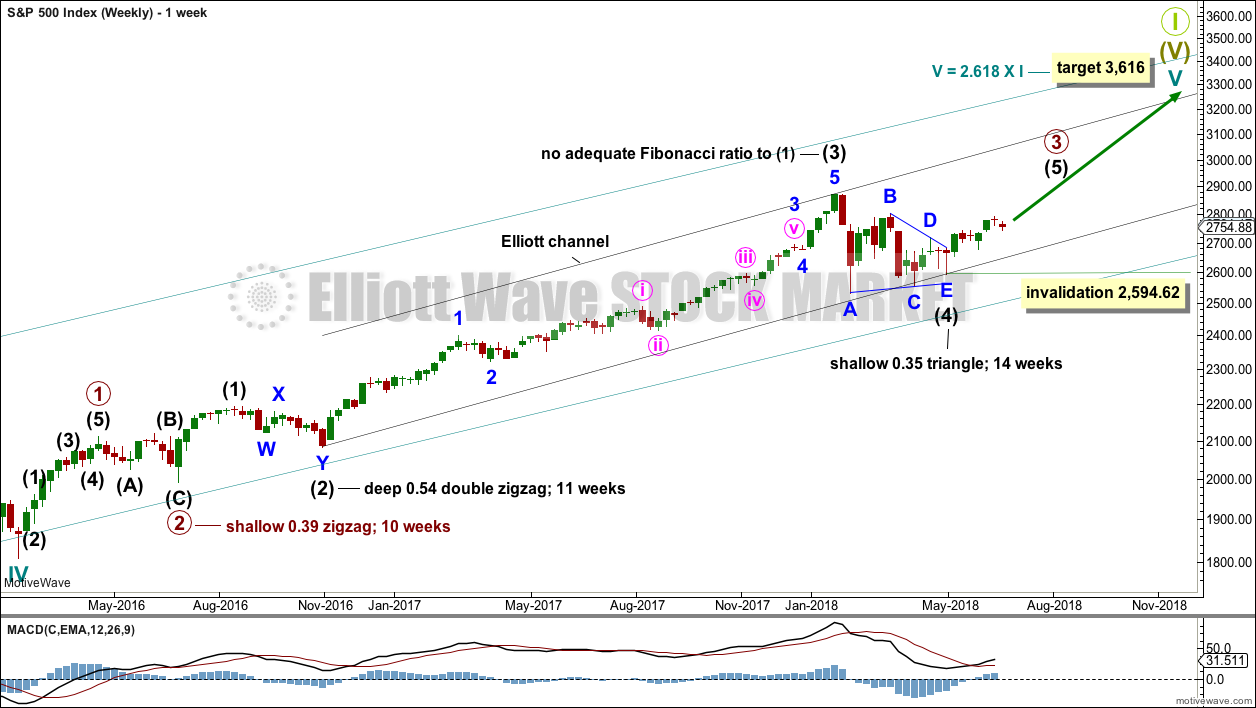
Cycle wave V must complete as a five structure, which should look clear at the weekly chart level and also now at the monthly chart level. It may only be an impulse or ending diagonal. At this stage, it is clear it is an impulse.
Within cycle wave V, the third waves at all degrees may only subdivide as impulses.
Intermediate wave (4) has breached an Elliott channel drawn using Elliott’s first technique. The channel is redrawn using Elliott’s second technique: the first trend line from the ends of intermediate waves (2) to (4), then a parallel copy on the end of intermediate wave (3). Intermediate wave (5) may end either midway within the channel, or about the upper edge.
Intermediate wave (4) may now be a complete regular contracting triangle lasting fourteen weeks, one longer than a Fibonacci thirteen. There is perfect alternation and excellent proportion between intermediate waves (2) and (4).
Within intermediate wave (5), no second wave correction may move beyond the start of its first wave below 2,594.62.
DAILY CHART
Click chart to enlarge.
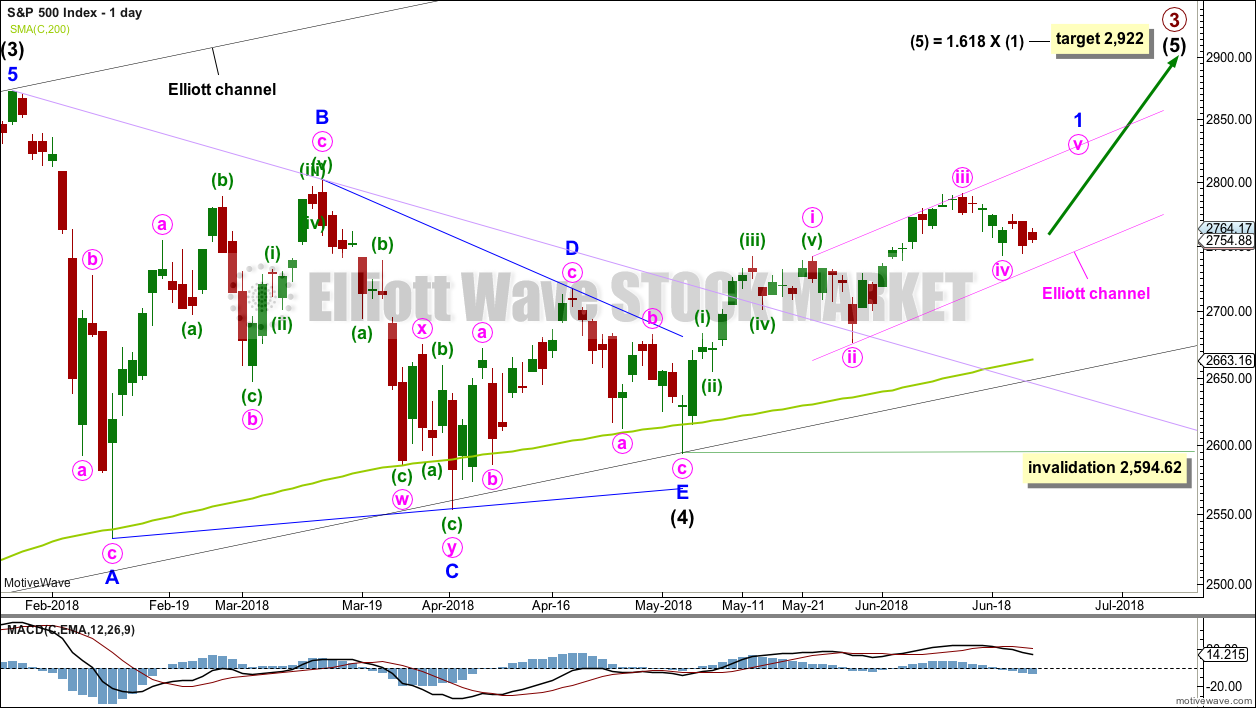
It is possible that intermediate wave (4) is a complete regular contracting triangle, the most common type of triangle. Minor wave E may have found support just below the 200 day moving average and ending reasonably short of the A-C trend line. This is the most common look for E waves of triangles.
Intermediate wave (3) exhibits no Fibonacci ratio to intermediate wave (1). It is more likely then that intermediate wave (5) may exhibit a Fibonacci ratio to either of intermediate waves (1) or (3). The most common Fibonacci ratio would be equality in length with intermediate wave (1), but in this instance that would expect a truncation. The next common Fibonacci ratio is used to calculate a target for intermediate wave (5) to end.
Price has clearly broken out above the upper triangle B-D trend line. This indicates that it should now be over if the triangle is correctly labelled.
A trend line in lilac is added to this chart. It is the same line as the upper edge of the symmetrical triangle on the daily technical analysis chart. Price found support about this line.
Minor wave 3 may only subdivide as an impulse, and within it the subdivisions of minute waves ii and iv may show up as one or more red daily candlesticks or doji.
The preferred way now to see upwards movement from the end of intermediate wave (4) is as an incomplete five wave impulse for minor wave 1. Within the impulse, minute wave iii is shorter than minute wave i by 32.96 points, which limits minute wave v to no longer than equality in length with minute wave iii at 2,857.85, so that minute wave iii is not the shortest actionary wave within the impulse and a core Elliott wave rule is met. A target for minute wave v to complete minor wave 1 may be about 2,844.
When minor wave 1 is a complete five wave impulse, then a longer lasting pullback for minor wave 2 may be expected. A breach of the Elliott channel about minor wave 1 by a full daily candlestick below and not touching the lower trend line would provide confidence that minor wave 1 should then be over and minor wave 2 should then have begun.
HOURLY CHART
Click chart to enlarge.
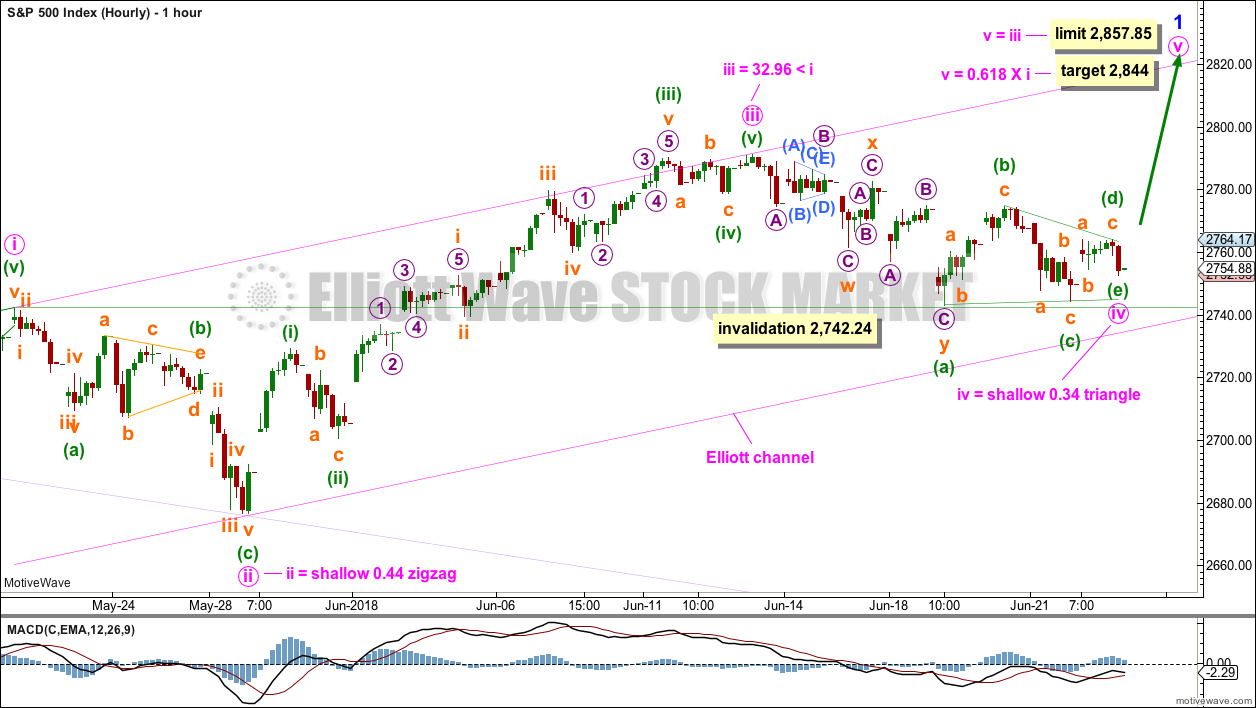
Minute wave iv may be moving sideways as a regular contracting triangle. It may have ended at the end of Friday’s session, or minuette wave (e) may move just a little lower.
If minute wave iv continues further, then it may not move into minute wave i price territory below 2,742.24.
Minute wave v may end about mid way within the Elliott channel.
ALTERNATE HOURLY CHART
Click chart to enlarge.
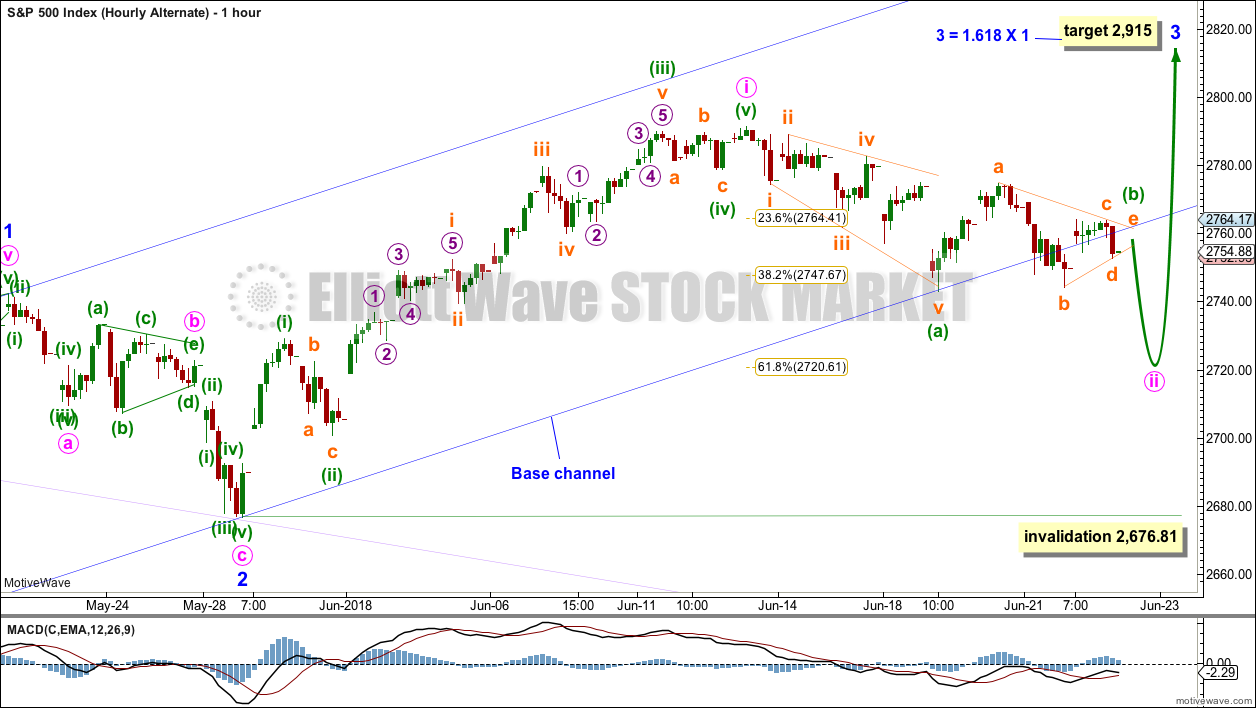
This is now the alternate hourly count. It looks at the possibility that minor wave 1 may be complete, and now minute wave i may be complete.
Minute wave ii may be an incomplete zigzag that is not remaining within the base channel drawn about minor waves 1 and 2. The base channel is drawn from the start of minor wave 1 to the end of minor wave 2, then a parallel copy is placed upon the end of minor wave 1. Lower degree second wave corrections usually find support about the lower edge of a bull market base channel. While base channels most often work in this way, they do not always work. The probability of this wave count is reduced, but it remains viable.
Minute wave ii may end closer to the 0.618 Fibonacci ratio of minute wave i about 2,721.
Minute wave ii may not move beyond the start of minute wave i below 2,676.81.
A new low below 2,742.24, by any amount at any time frame, would invalidate the main hourly wave count and provide confidence in this alternate.
TECHNICAL ANALYSIS
WEEKLY CHART
Click chart to enlarge. Chart courtesy of StockCharts.com.
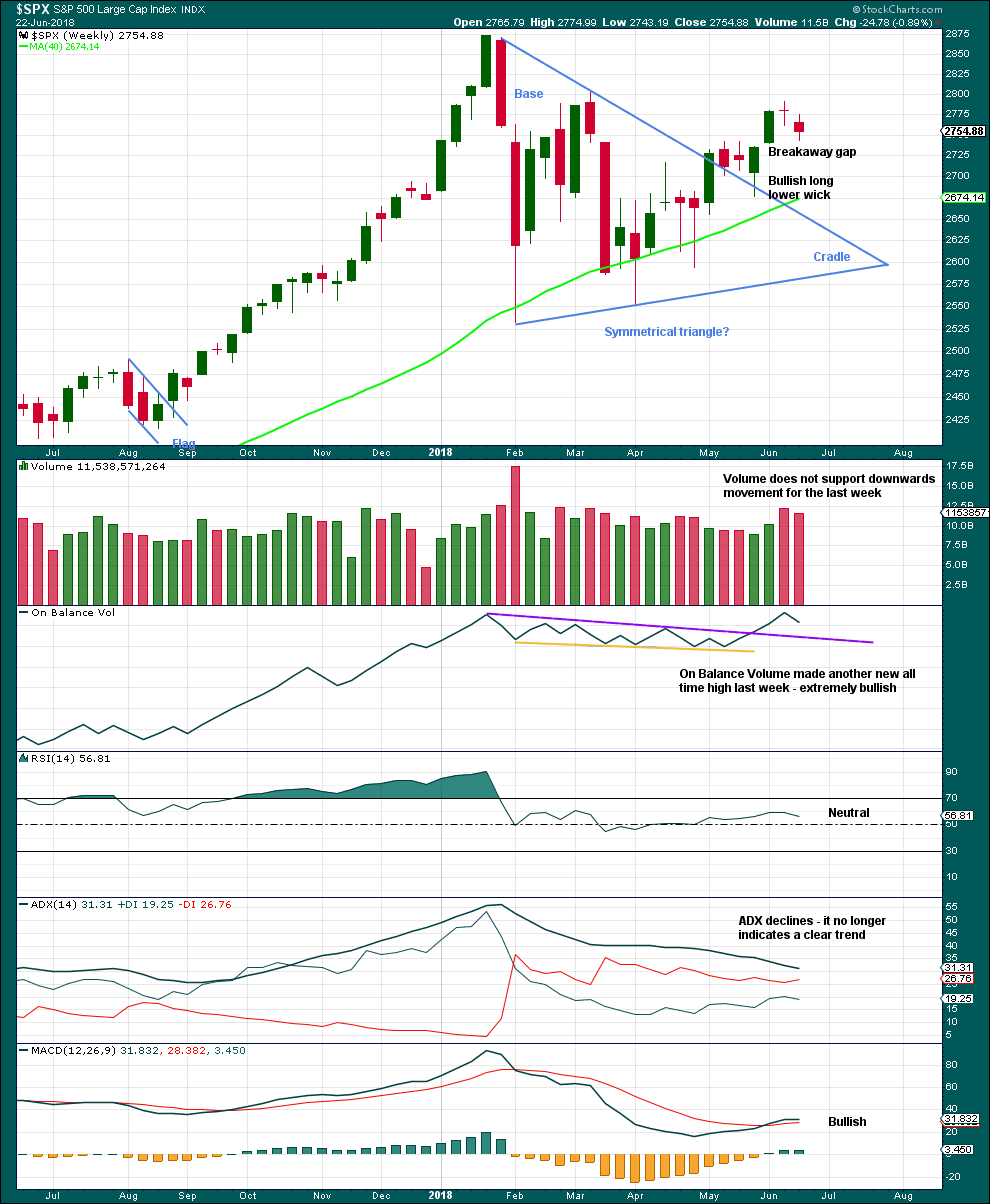
This week’s spinning top candlestick pattern again signals a balance of bulls and bears this week. With volume not supporting downwards movement this week, it looks like bears may be tiring.
This chart is very bullish.
DAILY CHART
Click chart to enlarge. Chart courtesy of StockCharts.com.
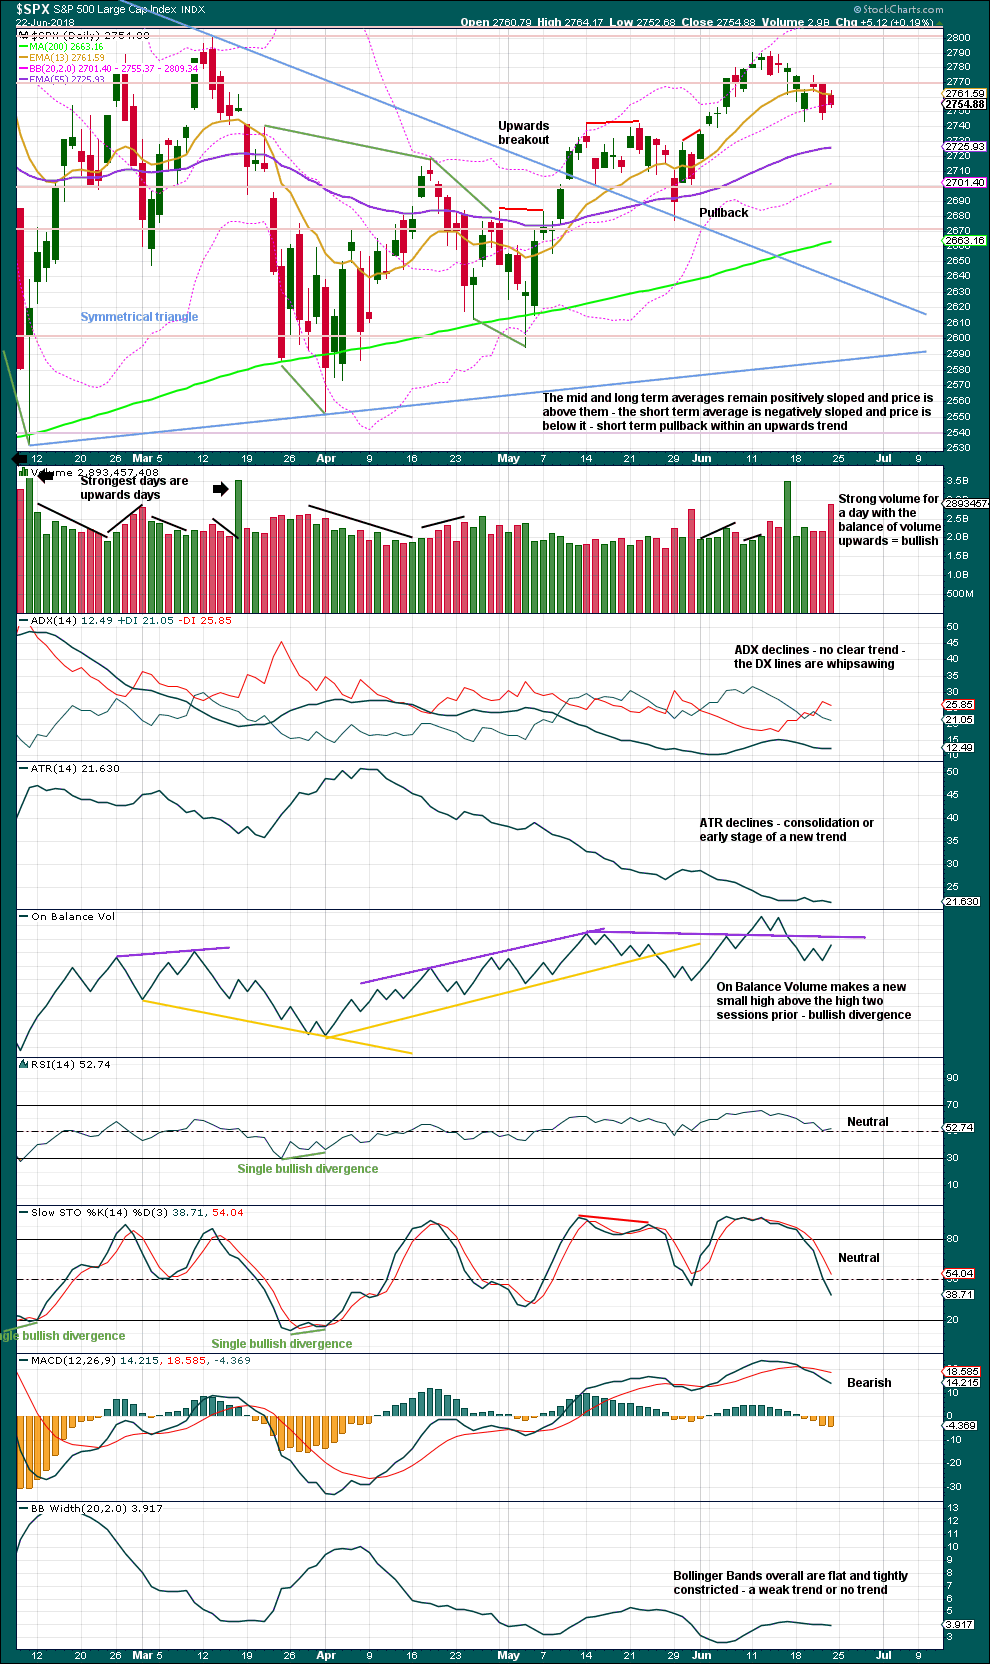
The symmetrical triangle may now be complete. The base distance is 340.18. Added to the breakout point of 2,704.54 this gives a target at 3,044.72. This is above the Elliott wave target at 2,922, so the Elliott wave target may be inadequate.
The balance of volume for Friday was upwards and the candlestick was an inside day. Volume strongly supported upwards movement during Friday’s session.
With Stochastics now well back into neutral territory, there is again plenty of room now for price to continue higher.
VOLATILITY – INVERTED VIX CHART
Click chart to enlarge. Chart courtesy of StockCharts.com. So that colour blind members are included, bearish signals
will be noted with blue and bullish signals with yellow.
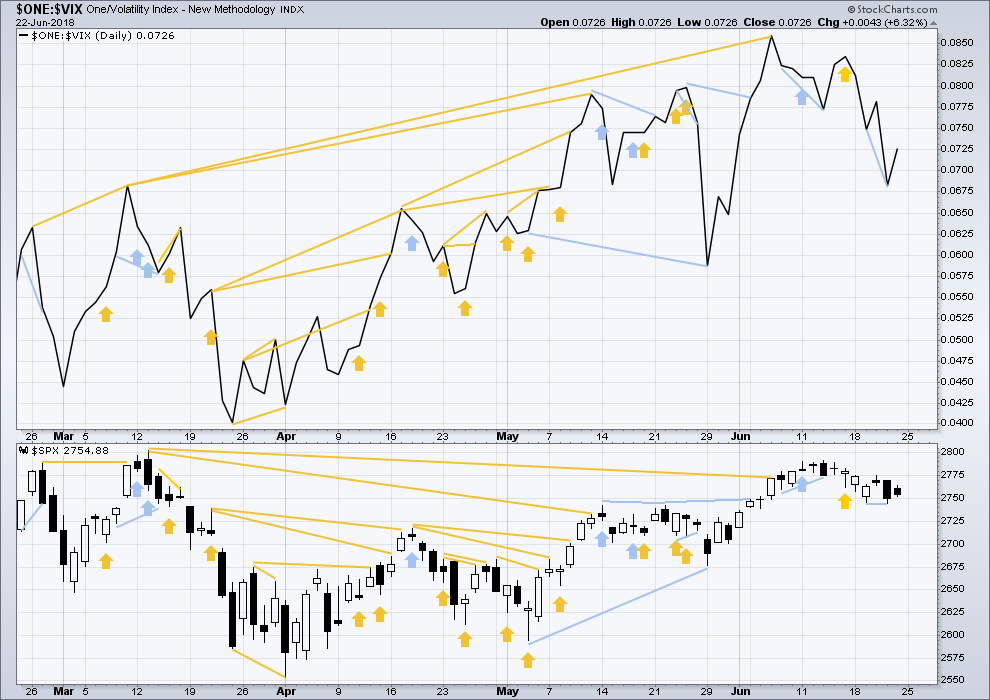
Normally, volatility should decline as price moves higher and increase as price moves lower. This means that normally inverted VIX should move in the same direction as price.
Inverted VIX has made a new high above the prior swing high of the 9th of March, but price has not made a corresponding new swing high about the same point yet. This divergence is bullish. Inverted VIX is still a little way off making a new all time high.
Bearish divergence noted in last analysis between price and inverted VIX has now been followed by one red daily candlestick. It may now be resolved, or it may need another downwards day to resolve it. There is no new divergence for Friday.
BREADTH – AD LINE
Click chart to enlarge. Chart courtesy of StockCharts.com.
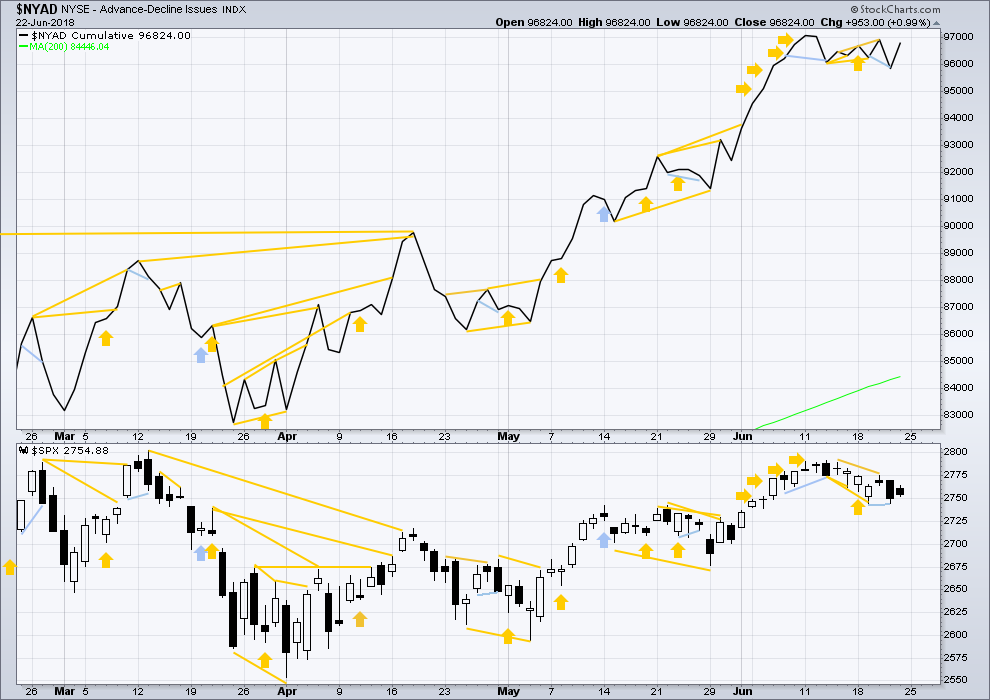
There is normally 4-6 months divergence between price and market breadth prior to a full fledged bear market. This has been so for all major bear markets within the last 90 odd years. With no longer term divergence yet at this point, any decline in price should be expected to be a pullback within an ongoing bull market and not necessarily the start of a bear market. New all time highs from the AD line means that any bear market may now be an absolute minimum of 4 months away. It may of course be a lot longer than that. My next expectation for the end of this bull market may now be October 2019.
Small caps and mid caps have both recently made new all time highs. It is large caps that usually lag in the latter stages of a bull market, so this perfectly fits the Elliott wave count. Expect large caps to follow to new all time highs.
Breadth should be read as a leading indicator.
Bearish divergence noted in last analysis between price and the AD line has now been followed by a red daily candlestick. It may now be resolved, or it may need another downwards day to resolve it. There is no new divergence for Friday.
Overall, the AD line still remains mostly bullish as it has made more than one new all time high last week. Price may reasonably be expected to follow through in coming weeks.
DOW THEORY
The following lows need to be exceeded for Dow Theory to confirm the end of the bull market and a change to a bear market:
DJIA: 23,360.29.
DJT: 9,806.79.
S&P500: 2,532.69.
Nasdaq: 6,630.67.
Only Nasdaq at this stage is making new all time highs. DJIA and DJT need to make new all time highs for the ongoing bull market to be confirmed.
Charts showing each prior major swing low used for Dow Theory may be seen at the end of this analysis here.
Published @ 10:07 p.m. EST.
Today’s daily candlestick has developed a huge long lower wick. That’s very bullish folks.
updated alternate hourly wave count:
There is now a zigzag, 5-3-5 down complete. It looks like a zigzag on the daily chart.
Hi Lara,
Isn’t it unusual to have such a deep wave II in a wave 3?
A bit unusual, yes.
And it’s a huge breach of the base channel.
I’m looking at another way to label this… I may have to change my degrees
Not shown on Lara’s chart, but the minute ii stopped right at the 78% fibo. Now this is a robust ii, not some cheap 38% retrace imitation, or something with a low lost between fibo levels. No doubt it’s generated lots of fear and shaken out lots of weak hands. All according to Hoyle. Took most of my small shorts and an SPX put I held, and I’m up nicely on the day, but I’d like Hoyle to take us back up now, thank you very much!!!
A small point, but one that really bugs me. 0.786 isn’t a Fibonacci ratio. It’s the square root of 0.618 which is a Fibonacci ratio.
Thats why when I put my Fibonacci re-tracements on a chart, you’ll not see 0.786 there.
I’m a bit pedantic about math.
Okay, in the future I’ll call it a “fibonacci ratio derivative”.
Since 0.786 = sqrt(0.618), and since the golden mean itself is all about a relationships between a square and the number 1 (0.618^2 = 1-0.618), there is an implication that both squares and sqrts of the golden mean might be important. And so they are as you of course know.
Pragmatically 0.786 is more often than not the preferred turn spot (when a turn is in the general area) vs. the “fundamental” ratio 0.764. So much so that I’ve stopped using the latter and strictly use the derived ratio 0.786 on my charts. Similarly, for extension targets, my lowest is always 1.272 (sqrt(1.618)), and the next is the 1.618 (then 2.618 etc). The 1.236 for this particular type of market behavior (price extension, vs. price retrace) doesn’t seem to be significant, while 1.272 does.
Have you noticed that the VIX aggressive short sellers have scattered to the wind?
Hey guys….come and get some!!! 🙂 🙂 🙂
We will probably see a capitulation spike in the am tomorrow and a chance to reload the howitzer over the next week or two…not trading advice and for educational purposes only!
I have been reading a lot of smart analysts who have been talking about a change in the Zeitgeist of the market the last week or two. I personally was intrigued by how many long lower wicks we had that did not issue in a downtrend reversal. A few months ago you would ignore that reliable signal at your own peril if you were short the market.
A developing loss of bankster dominance? Mood change?
From what I have read the mood has remained extremely bullish so what changed??!! Most folk think it is the trade war but I have my doubts. Just thinking out loud.
There is a lot of noise, and we are continually tempted to ascribe meaning and patterns to random variations within a distribution when in fact there are none to be found. I am content relying on the more tried and true indicators that Lara relies on, mainly market breadth, OBV, and volatility, all of which have remained relatively bullish even in the face of immense price weakness–suggesting the main count Lara is working on is indeed mostly correct. The long lower wick on 2/9 signaled the interim bottom for the volatility squeeze sell-off, but since then, price has simply meandered sideways while the other indicators I mentioned have trended strongly upward. I mentioned before that I think price can continue moving sideways and this will be an options sellers’ market until there either a) resolution of political “jitters” b) economic numbers finally roll over.
I have read some analysis that claims credit markets are not nearly as vulnerable as the market would make it seem, despite the weakness in European banks. I know you are inclined to scoff at the idea that credit is not weak, but the Fed stress tests didn’t identify any immediate danger. I know there are some self-proclaimed insiders here who say that credit is on the verge of an apocalyptic collapse and banks are about to go under, but if that is to happen the breakdown has not even come close to reaching its “Bear Stearns” moment yet.
No need for speculation, just look at LIBOR…
Bo they post all the bad assets away while undergoing examinations. Very few processes in this worked that are gamed to this degree and magnitude; window dressing at best. Fractional reserve bank, especially at the SIFIM level. Passing an updated Glass Steagal and term limits would do rounders to void off systemic risk.
A lot of folk are going to be tempted to catch this falling knife….
A break of DJI 24K is going to send VIX past 20.00 with some additional dicey implications for the persistent insane (yes they have NOT fully unwound!) risk parity trade.
The rollover of Tech also has some very serious implications for SPX as its tech components have been keeping SPX aloft. May be time to batten down the hatches….
We may have a turn in the Euro. A close above 112.58 would close most recent overhead gap down and trigger a buy… 🙂
Deploying August expiration 112/110 bull put spread for credit of 0.65 per contract.
Hard stop any close below FXE 112.00
If we transfer Lara’s S&P wave count to the RUT (just for fun) we find that minute ii is, so far, a perfect 61.8% retracement of minute i. If this wave count is correct, then judging by the size of minute i, minor 3 will be much larger than minor 1 which is as it should be.
I realize that technically it does not violate any explicit EW rules but I have always been very ill at ease with similarly numerically designated lesser degeree waves that equal larger degree ones in duration and/or displacement. It seems to me that it violates the very notion of degree in EW theory. I could be in error on that but counts when that happens makes me antennae go up.
I agree, but it cannot be minute iv playing out now, so that means we are either in minor 4 already, which would mean minor 3 < minor 1 or we are in minute ii and ready to start minute iii of minor 3 which should be one of the larger waves I would think (3 of a 3 of a 5 of Primary 3). Unless something else is going on that I'm not seeing and that may be why your antenna is up.
Maybe it wasn’t a triangle but rather a zigzag and where you have abcde, it was a flat zigzag, and that we are seeing a leading diagonal! That would mean that a deep retrace has started. Dunt know…Im still holding my longs but may have to let them goooooo
I have been wondering about the possibility of a larger triangle with an E wave unfolding. This kind of downside momentum in an unfolding upward impulse is quite unusual imho. VIX a bit of caitionary note. I could be wrong here. Price will tell all!
BTW, per my charts the apex of the triangle that “sometimes” marks a trend change point did INDEED do so here. It appears to me to be 4 days later than the highs before the initiation of this sell off. Not a perfect bingo but close enough for gov’t work.
Kevin, my pivot to buy is 2670. (Not trading advice). It should have a big bounce to suck people back in, but there’s very real selling occurring here.
No panic yet though. I am scratching my head over the early exit of the Commercials from their E-mini record net short position. They left hundreds of millions on the table and that is not at all like them as they generally nail the bottom (probably cause it) when they cover.
My interpretation to that is potential counterparty risk if this blows wide open here. It’s doesn’t look like they exited 50% Verne, you see the same?
Current reading has them down to around 240K from well over 500K last week (Barcharts).
That business about counterparty risk is a hair-raiser. This persistent low volume on the ride up means the purchase of a lot of insurance to protect long traders who cannot exit due to ridiculous on non-existent bids. For leveraged longs this is going to be an absolute nightmare.
I think this is the other side of vol shoe yet to drop which has been puzzling me for some months now…
It certainly has yet to drop Verne, and I’m glad you’re aware of the counter party risk hair-riser, I don’t think absolute nightmare begins to quantify what will ultimately happen. This event will occur when the public panic sells the etfs, and we have a series of limit down days, as brokerage firms, market makers, risk-parity and global macro get blown to smithereens. It’s coming folks, mark my words, I’m out of town on my second surf trip of 2018 August 9-24th, so naturally that’s the timeline….lol
Oh yes! Those ETFs and the ticking time bomb of passive investing!
Very little, if any, discussion of the import, possible impact, and ongoing risk metric distortion of that little item…!
Yep. That makes sense…a bird in the hand of sorts….
Great day for da bears! I managed to grab a quick profit in SPXS myself. But we might be at or near the bottom of minute 2, as per Lara’s alternate count. So possibly… minor 1-2 > minute 1-2… that’s potentially super bullish, is it not?
If that’s what is really happening. I am concerned we are still in the early days of a toddler with power kicking over the world economic order, and the market effects are just beginning, not just ending. Large bearish ratio backspreads might just be a wise move right about now. A meltdown is possible in reaction as more and more blocks topple, and it becomes clear that the tantrum is never ending (until 2021 or 2025).
DAH BEARSSSSSHH…! 🙂
Hahaahahahahah lol……That made my day, except for all the green across the board..Selling remaining Calls on Vix. Will likely be frustrated if we see 25 tomorrow but so be it.
Bulls make money, Bears make money but…well, you know…! 🙂
Pardon me if I don’t agree that Darden Restaurants (DRI), valued at $85/sh 6 weeks ago, is now properly valued at $108.5/sh. Who are we kidding here? Suddenly all of American wants to eat at Dardens??? There are many such vastly overblown valuations, as money has fled international companies (trade war concerns) and poured into US only/defensive stocks…such as DRI. TIF. LULU. CMG. I will continue rifle shot shorts on these.
I could not agree more! There is an awful lot of dumb money piling into retail stocks lately….free money! 😉
Uh, Oh! Yikes!
tagging all but 10% of VIX calls, gotta take the triple.
He! he! I hear ya! I sold some, and exercised some and sold some fat deep in the money calls. I will either get called away or pocket the juicy premium and hang onto the shares. I have a sneaky suspicion they are not quite done!
Congrats buddy, you know they’re gonna give us another entry point, but man these gains are getting silly. Lara, I’m paying for an INDO Boat Trip in the MENTs literally right now with VIX profits from today!!! Targeting an August departure, which of course, the bear will start while I’m away from the office.
Haha! No doubt! 🙂
thats one of my dreams, to surf in the Mentawis
nice one Chris!
Last VIX gap filled. One remains open. If we get a bull flag here….Uh Oh..! 🙂
Looks like ES finding support at 2720.
Selling SPY 275 long puts, covering 279 short calls.
We now need to fill some upside gaps….a lot of ’em, and we need to start “Schnell!”
While SPX has held at the 62% at 2721, it sure looks to me like the BEST case is days worth of backing and filling around this price area, perhaps with a lot of volatility (60% likely). Another significant leg down (another 30+ points, perhaps even down to 2682 area) would be completely reasonable (30% likely). And price just turning here and resuming bull mode? I see that likelihood as very low, <10%.
As I strongly suspected, SPX has rolled over.
If 2717 (a major pivot high from 4/18) doesn’t hold, this market could be headed to 2677-82 area.
I am going to do something a bit different.
I am exercising UVXY deep in the money calls and selling covered calls against my shares a few weeks out. If called away I still make out like a bandit. If not, I make a bit less but remain long vol with a nice sized position. I think something interesting is going on with the big banks, led by that dead man walking, DB.
I don’t know how they are fudging the numbers, but I have long contended VIX numbers being posted cannot possibly be right being so woefully incommensurate with true market risk. Oh I know they call it “implied volatility” for a reason, but somebody STILL got some ‘splaining to do, and it’s not Lucy! 🙂
I have never seen a double gap higher intra day in VIX….wassup wid dat?!
Selling IWM 165, QQQ 177 puts.
Holding long vol trades. Something very strange going on there…
Verne, Futures sold at 15 limit, I’m going to close UVXY spread, but keeping a few August VIX calls for the heck of it.
I noticed the Commercials covered half their E mini short positions so I think a bottom is near. Will also exit UVXY calls and QQQ and IWM puts shortly. 🙂
Unless PPT steps in early we follow DAX in all likelihood.
Nice and clear analysis Lara. Thank you. I am headed off to Chicagoland tomorrow afternoon to visit family for the week. I will be checking in periodically. But I expect the SPX to be mostly higher this week as stated in the summary.
One part of my mind looks at the SPX daily and screams “price rolling over!!”. It’s my “intuitive” side that is particularly sensitive to short term momentum and trend, both of which are down at the daily and hourly levels (the weekly is more mixed, and the monthly is still up). I don’t view this wave structure as giving downside protection right here and now: there’s plenty of room for a larger ii down (or ??) to continue to unfold. The good news is, the decision level for “more down” is very close: any move below lows last week and I’m getting a larger short hedge trade in place quickly. So I share the expectation Rodney…but will be ready for anything here, for sure.
SPX weekly.
A very bullish weekly trend per the solid (so far) trend line. But it’s always the 3rd touch (last week’s) that is the real test. Hold or break?
StochasticRSI has rolled over to BEARISH. (I find stochRSI to be my most sensitive indicator. )
Overall, based on ADX and CCI, the weekly chart is still in a (mild) down trend (orange bars).
The closest pivot low support is “far far away” at 2676.
Price is in a squeeze (bollinger inside keltner, not shown here, indicated by the red dots on the momentum oscillator); we can expect a sharp range expansion out of this at some point in the coming weeks. Up or down is unknown.
The trend line holding is mega-important. If it cracks, I want to be short. And when the squeeze comes off, I’ll want to get in line quickly with the break out direction.
The daily view. The StochRSI here is oversold and is crossing to bullish.
2742 is key on the downside, and 2770 on the upside. Breaking either could ignite the market a bit. Downside would be to the 2721 62% fibo for sure, and to the 2701 area 78% wouldn’t be surprising.
To the upside, can price push past the pivot highs around 2804?
Enjoy the drama everyone.