
More upwards movement unfolded as last analysis expected.
Today a candlestick pattern is balanced against analysis of On Balance Volume and the AD line to decide which short term Elliott wave count is most likely for tomorrow.
Summary: A brief shallow pullback is expected to start here, to end about 2,769 in one to about three days.
The short term target for a reasonable pullback within this trend is at 2,824 or 2,915.
The mid to longer term target is at 2,922 (Elliott wave) or 3,045 (classic analysis). Another multi week to multi month correction is expected at one of these targets.
The final target for this bull market to end remains at 3,616.
The Elliott wave count has good support from classic technical analysis. New all time highs today from On Balance Volume and the AD line add strong confidence to this analysis.
Pullbacks are an opportunity to join the trend. An upwards trend is expected to be developing. It is possible that upwards movement may show a further increase in momentum over the next several days.
Always practice good risk management. Always trade with stops and invest only 1-5% of equity on any one trade.
New updates to this analysis are in bold.
The biggest picture, Grand Super Cycle analysis, is here.
Last historic analysis with monthly charts is here, video is here.
ELLIOTT WAVE COUNT
WEEKLY CHART
Click chart to enlarge.
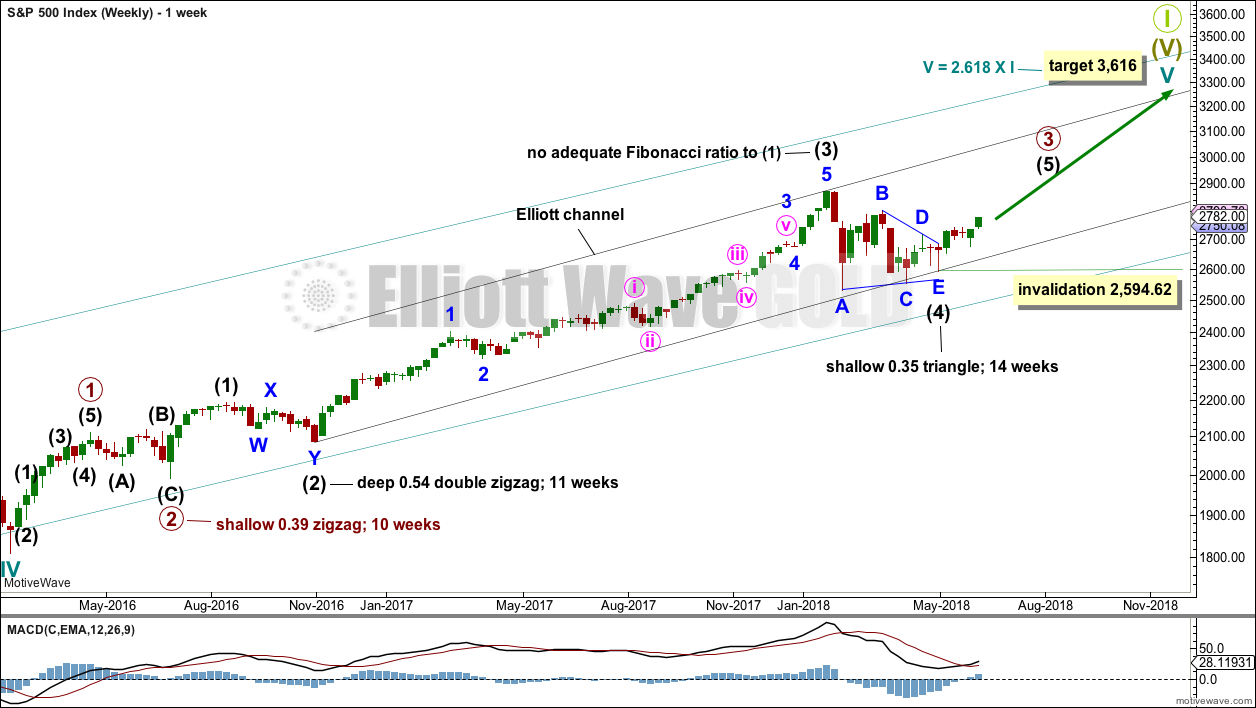
Cycle wave V must complete as a five structure, which should look clear at the weekly chart level and also now at the monthly chart level. It may only be an impulse or ending diagonal. At this stage, it is clear it is an impulse.
Within cycle wave V, the third waves at all degrees may only subdivide as impulses.
Intermediate wave (4) has breached an Elliott channel drawn using Elliott’s first technique. The channel is redrawn using Elliott’s second technique: the first trend line from the ends of intermediate waves (2) to (4), then a parallel copy on the end of intermediate wave (3). Intermediate wave (5) may end either midway within the channel, or about the upper edge.
Intermediate wave (4) may now be a complete regular contracting triangle lasting fourteen weeks, one longer than a Fibonacci thirteen. There is perfect alternation and excellent proportion between intermediate waves (2) and (4).
If intermediate wave (4) were to continue further as either a flat or combination, both possibilities would require another deep pullback to end at or below 2,532.69. With both On Balance Volume and the AD line making new all time highs, that possibility looks extremely unlikely.
If intermediate wave (4) were to continue further, it would now be grossly disproportionate to intermediate wave (2). Both classic technical analysis and Elliott wave analysis now suggest these alternate ideas should be discarded based upon a very low probability.
Within intermediate wave (5), no second wave correction may move beyond the start of its first wave below 2,594.62.
DAILY CHART
Click chart to enlarge.
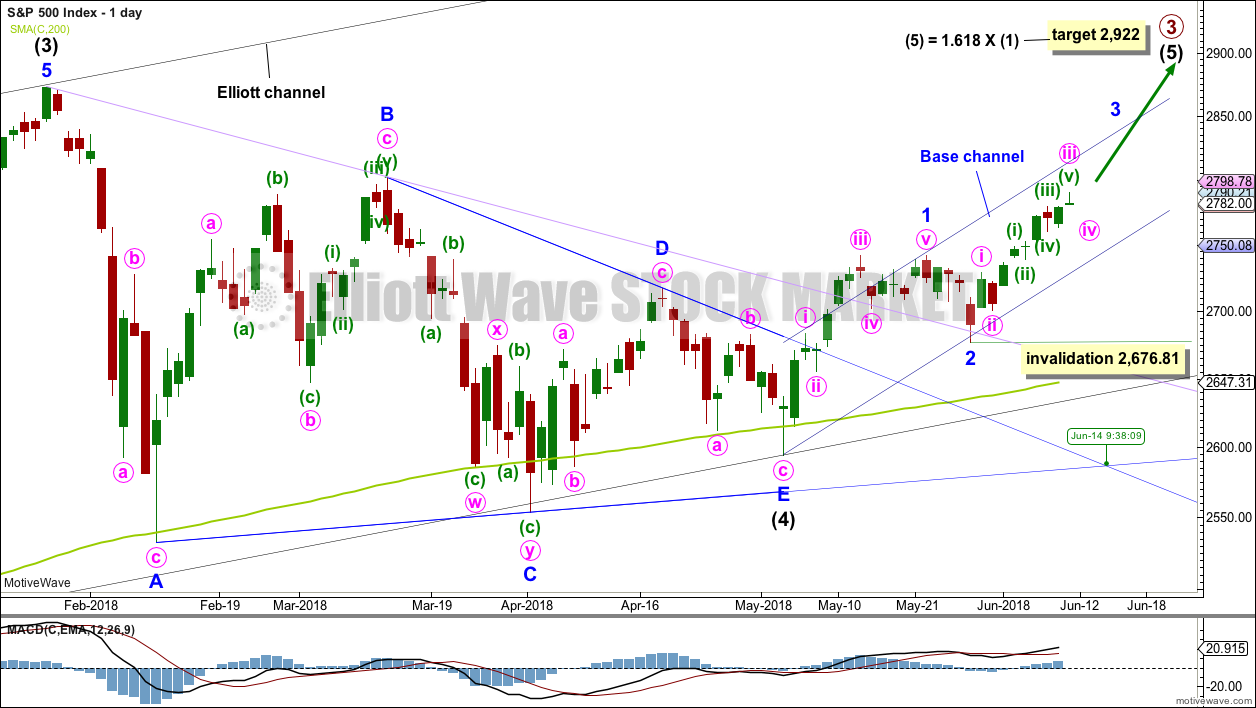
It is possible that intermediate wave (4) is a complete regular contracting triangle, the most common type of triangle. Minor wave E may have found support just below the 200 day moving average and ending reasonably short of the A-C trend line. This is the most common look for E waves of triangles.
Intermediate wave (3) exhibits no Fibonacci ratio to intermediate wave (1). It is more likely then that intermediate wave (5) may exhibit a Fibonacci ratio to either of intermediate waves (1) or (3). The most common Fibonacci ratio would be equality in length with intermediate wave (1), but in this instance that would expect a truncation. The next common Fibonacci ratio is used to calculate a target for intermediate wave (5) to end.
Price has clearly broken out above the upper triangle B-D trend line. This indicates that it should now be over if the triangle is correctly labelled.
A trend line in lilac is added to this chart. It is the same line as the upper edge of the symmetrical triangle on the daily technical analysis chart. Price has found support about this line at the last two small swing lows. The suppport at this line has reasonable technical significance now that it has been tested twice, and this line should be assumed to continue to provide support until proven otherwise.
Sometimes the point at which the triangle trend lines cross over sees a trend change. A trend change at that point may be a minor one or a major one. That point is now about the 14th of June.
Minor wave 3 may only subdivide as an impulse, and within it the subdivisions of minute waves ii and iv may show up as one or more red daily candlesticks or doji.
Within minor wave 3, no second wave correction may move beyond the start of its first wave below 2,676.81. Along the way up, any deeper corrections may now find support at the lower edge of the base channel drawn about minor waves 1 and 2. Minor wave 3 may have the power to break above the upper edge of the base channel. If it does, then that upper edge may then provide support.
HOURLY CHART
Click chart to enlarge.
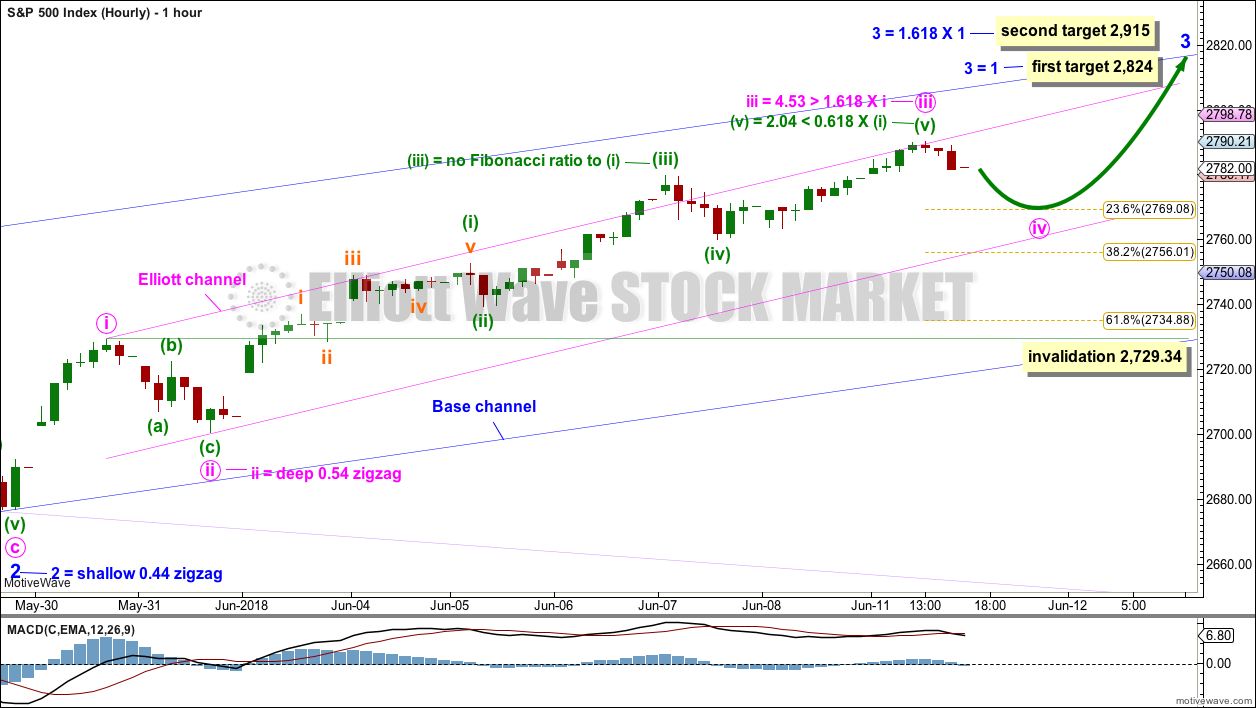
Minor wave 3 may only subdivide as an impulse, and within it all third waves at all degrees may only subdivide as impulses.
This main hourly wave count is preferred as it fits better with MACD. Momentum is slightly waning and this coincides with the fifth wave for minuette wave (v).
Minute wave iii may be over today. The Gravestone doji on the daily chart for today’s session supports this idea.
Fibonacci ratios are reasonable for this wave count.
Minute wave iv may be expected to exhibit alternation with minute wave ii. Minute wave iv may most likely be shallow, and may most likely be a flat, combination or triangle. All these structures are sideways types of corrections although expanded flats can end with strong downwards waves.
Minute wave iv may end within the price territory of the fourth wave of one lesser degree; minuette wave (iv) has its range from 2,779.90 to 2,460.16. The 0.236 Fibonacci ratio is within this range and may be a favoured target for minute wave iv to end.
Minute wave ii was over within one session, lasting exactly a Fibonacci 8 hours. Minute wave iv may also be as brief, but it may be a little longer as sideways corrections do tend to be longer lasting than zigzags.
The pink channel is redrawn using Elliott’s first technique. In the first instance, look for minute wave iv to find support about the lower edge, if it gets that low.
Minute wave iv may not move into minute wave i price territory below 2,729.34.
Minute wave iv is expected to be only a relatively brief shallow pullback. The larger upwards trend is expected to remain intact. Classic technical analysis remains overly bullish and the Elliott wave structure of this third wave for minor wave 3 still looks incomplete.
ALTERNATE HOURLY CHART
Click chart to enlarge.
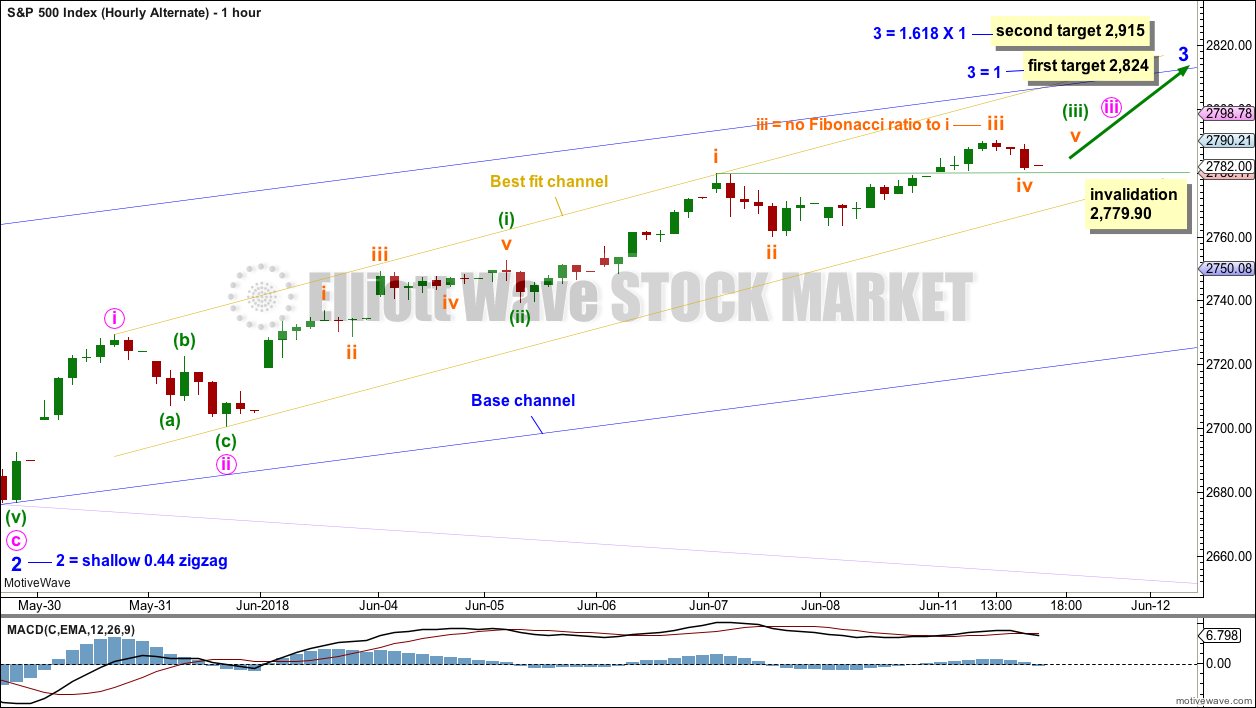
This alternate wave count has a lower probability than the main hourly wave count. Upwards movement shows weaker momentum and this does not coincide with the middle of a third wave at four degrees.
Both wave counts are identical up to the low labelled minuette wave (ii). Thereafter, for this alternate, the degree of labelling within minuette wave (iii) is moved down one. Within minuette wave (iii), only subminuette waves i through to iv may be complete.
Subminuette wave iv may not move into subminuette wave i price territory below 2,779.90.
TECHNICAL ANALYSIS
WEEKLY CHART
Click chart to enlarge. Chart courtesy of StockCharts.com.
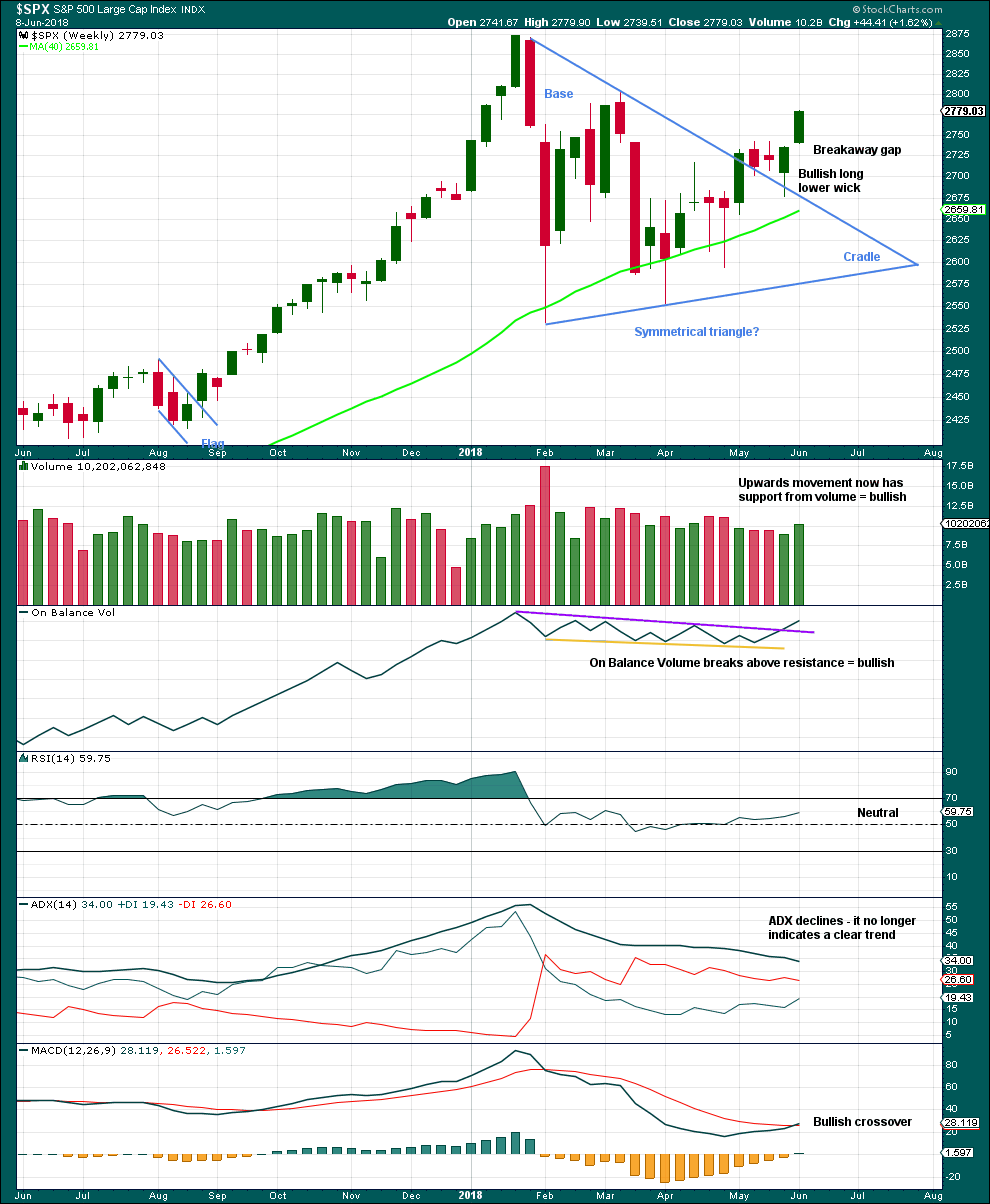
Last week closes very bullish with support from volume. The gap open last week moves up from a small three week consolidation, so it may be a breakaway gap; if this is correct, then the lower edge may provide support at 2,736.93.
The bullish signal from On Balance Volume is now very clear. If this week sees On Balance Volume move higher again, then it may make a new all time high at the weekly chart level; if it does, then that would be a very bullish signal.
Overall, this chart is fairly bullish.
DAILY CHART
Click chart to enlarge. Chart courtesy of StockCharts.com.
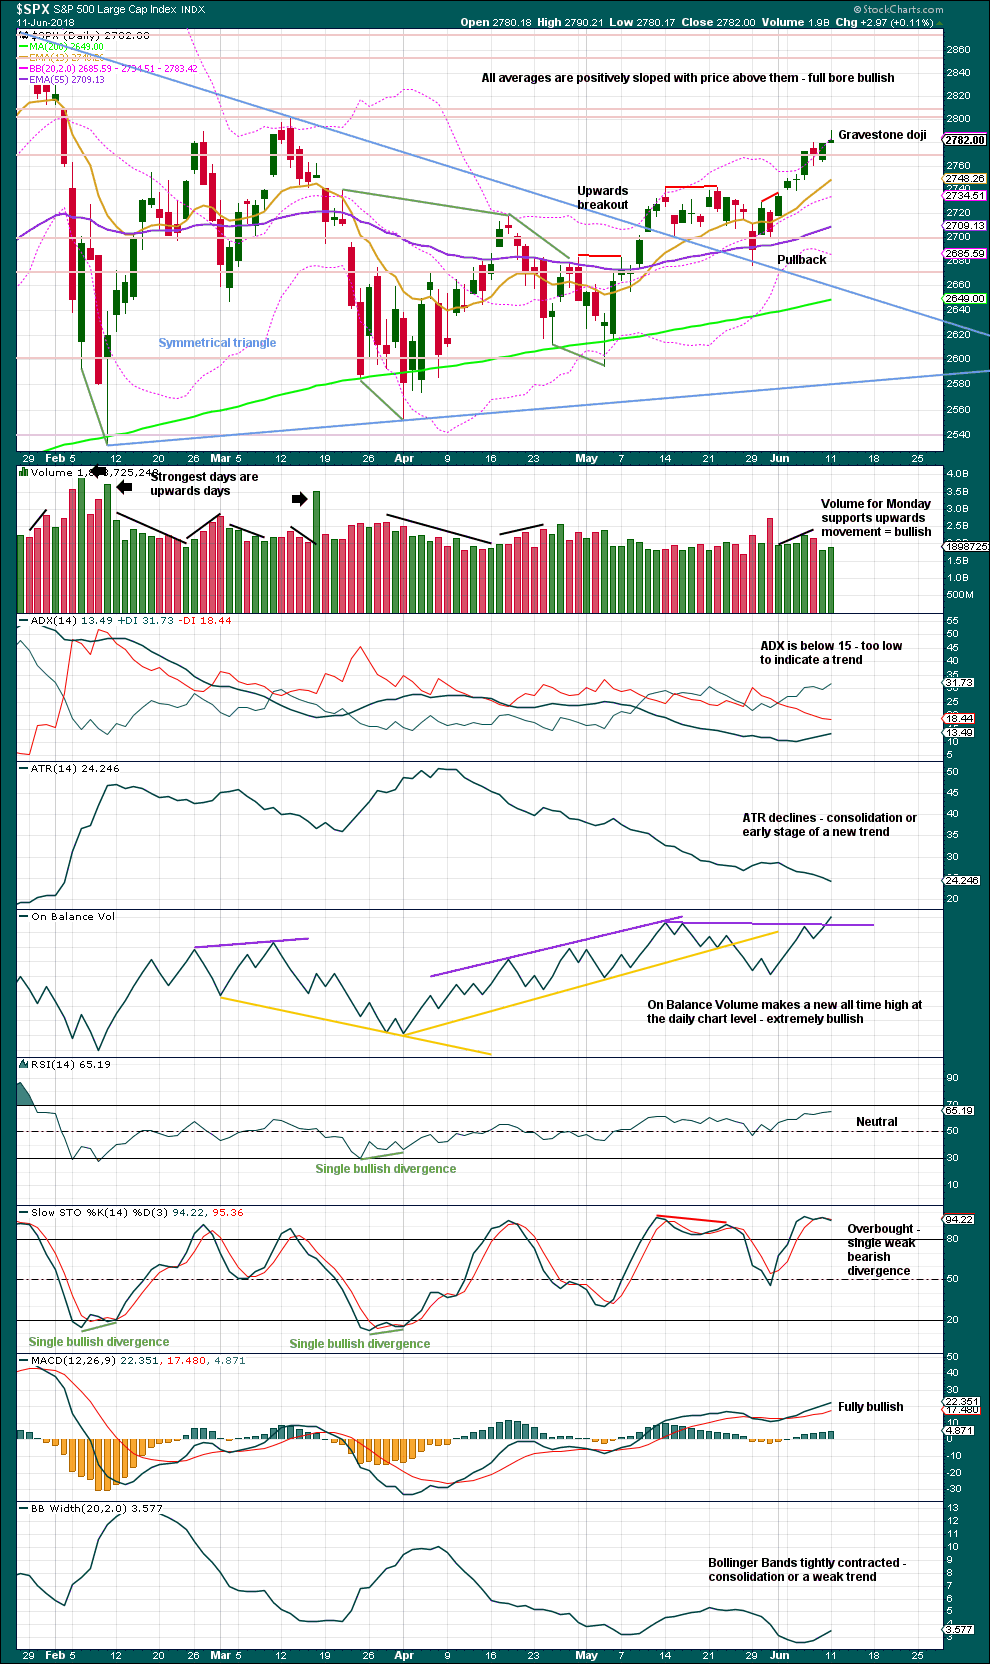
The symmetrical triangle may now be complete. The base distance is 340.18. Added to the breakout point of 2,704.54 this gives a target at 3,044.72. This is above the Elliott wave target at 2,922, so the Elliott wave target may be inadequate.
The Gravestone doji’s forte is in calling tops. This fits with the short term Elliott wave count today that expects to see a small consolidation here. Candlestick reversal patterns make no comment on the direction of the next trend (from up to either down or sideways) nor on how long the next trend may continue (a very few days to much longer). It seems to be a common misperception that candlestick reversal patterns, like this Gravestone doji, call for a major reversal; they may not.
Countering the bearishness of the Gravestone doji is support from volume and a new all time high from On Balance Volume at the daily chart level. This is extremely bullish, and price may be reasonably expected to follow on through to new all time highs.
Stochastics may remain overbought for long periods of time when this market has a bullish trend.
VOLATILITY – INVERTED VIX CHART
Click chart to enlarge. Chart courtesy of StockCharts.com. So that colour blind members are included, bearish signals
will be noted with blue and bullish signals with yellow.
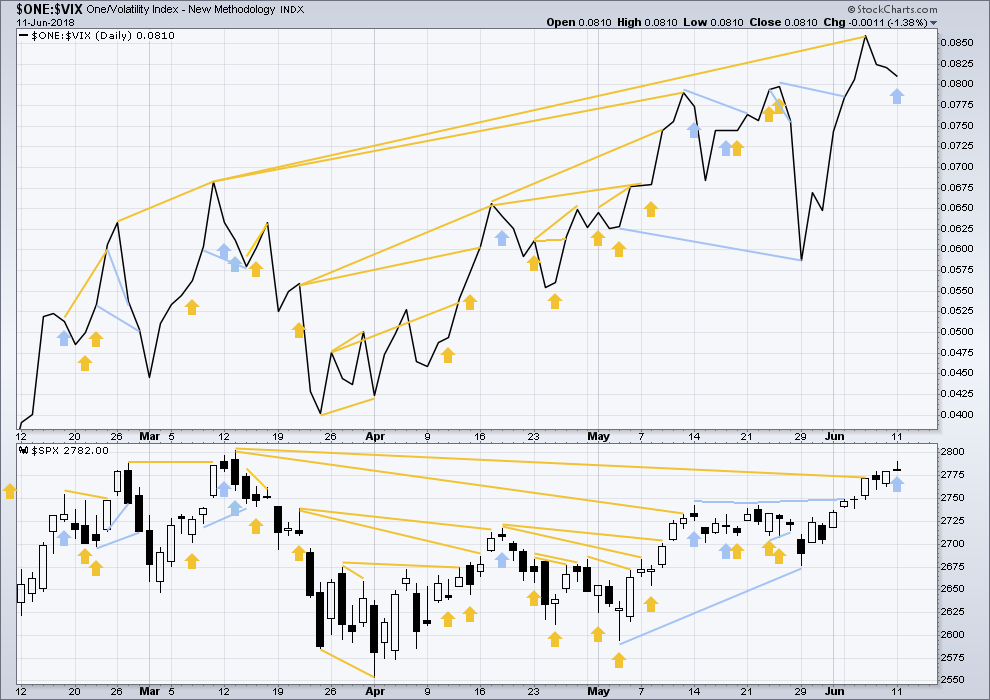
Normally, volatility should decline as price moves higher and increase as price moves lower. This means that normally inverted VIX should move in the same direction as price.
Inverted VIX has made a new high above the prior swing high of the 9th of March, but price has not made a corresponding new swing high about the same point yet. This divergence is bullish. Inverted VIX is still a little way off making a new all time high.
Price moved higher, but inverted VIX moved lower. This divergence is bearish. It supports the idea of a small consolidation about here, and for the divergence to be resolved it may be followed by one or two days of downwards movement.
BREADTH – AD LINE
Click chart to enlarge. Chart courtesy of StockCharts.com.
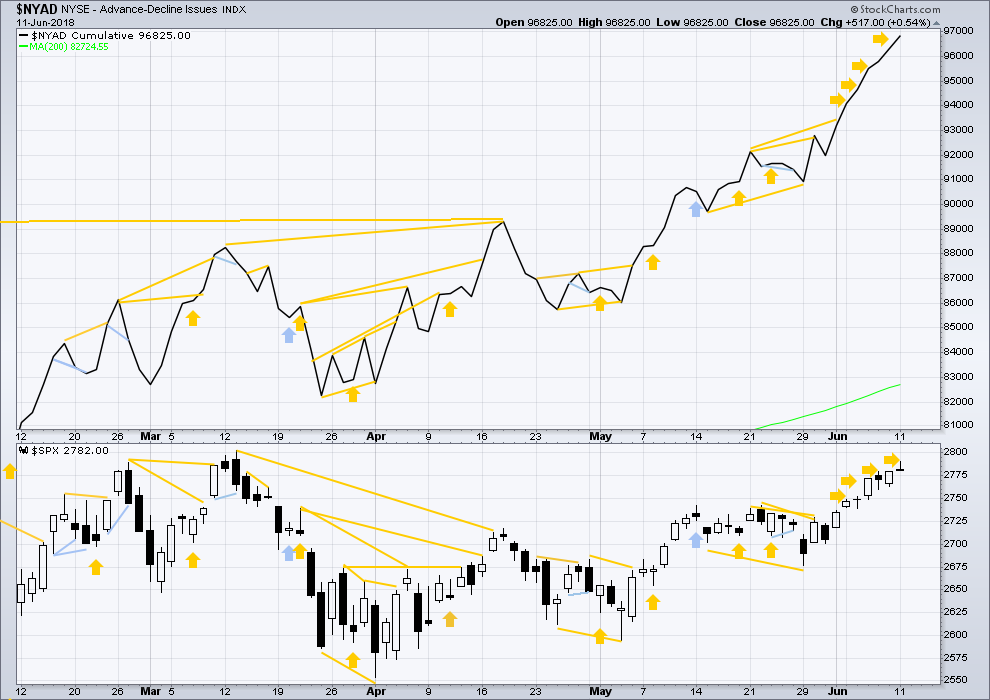
There is normally 4-6 months divergence between price and market breadth prior to a full fledged bear market. This has been so for all major bear markets within the last 90 odd years. With no longer term divergence yet at this point, any decline in price should be expected to be a pullback within an ongoing bull market and not necessarily the start of a bear market. New all time highs from the AD line means that any bear market may now be an absolute minimum of 4 months away. It may of course be a lot longer than that. My next expectation for the end of this bull market may now be October 2019.
Small caps and mid caps have both made new all time highs. It is large caps that usually lag in the latter stages of a bull market, so this perfectly fits the Elliott wave count. Expect large caps to follow to new all time highs.
Breadth should be read as a leading indicator.
The AD line is daily making new all time highs. This is a very bullish signal and will be given the most weight in today’s analysis. Price is likely to follow within days or a very few weeks.
DOW THEORY
The following lows need to be exceeded for Dow Theory to confirm the end of the bull market and a change to a bear market:
DJIA: 23,360.29.
DJT: 9,806.79.
S&P500: 2,532.69.
Nasdaq: 6,630.67.
Only Nasdaq at this stage is making new all time highs. DJIA and DJT need to make new all time highs for the ongoing bull market to be confirmed.
Charts showing each prior major swing low used for Dow Theory may be seen at the end of this analysis here.
Published @ 09:27 p.m. EST.
I am sorry everybody for not being here today to give you an updated hourly chart before the close. I suffer from insomnia, and after little sleep in the night if I can fall asleep in the morning, I need to stay asleep.
Caffeinated now and ready to analyse some markets.
The slight low today below 2,779.90 to 2,779 invalidates the alternate hourly wave count. This does look like minute iv has arrived as per the main hourly count.
A small doji for todays candlestick looks like a small correction, but if tomorrow prints a red candlestick that would have better look for minute iv.
Don’t worry at all Lara.
Sorry to hear you suffer from insomnia – I think we all do from time to time.
Thanks Nick.
You’d think after all this time I’d be better at that sleeping thing… but nope.
LOL
I hope everyone’s makin’ money. This “threat” of the minute iv got me to take profits here and there (and a dog or two) somewhat aggressively, so I’m up very nicely on the day, and am continuing a very nice long run of profitable days. Between a thinner exposure with only longer term holdings still on and tidy profits in the bag I’m a happy camper today. This is one of the ways I leverage Lara’s EW info: modulating my exposure based on the short term expectations. When this minute iv comes, it’ll set up another good short term buying opportunity. Though it’ll be only a quick opportunity: the minor 2 looms large, and I’m thinking forward to how to be properly positioned for that.
I’ll give you a hint: it has three letters…….
Does it rhyme with SIX??!! 🙂
Every one of the FAANGM group of stocks is up today, so far. My combined ticker for all of them is up 0.26% at the moment. SPX is NOT going down until that changes! XLF is the other key: it’s down but only slightly (-0.1%). Maybe the various reports etc. tomorrow and Thursday whip this market into some minute ii action.
Hi Kevin. You’ve been mentioning a minute ii the last couple of days.
What are you referring to? Are you seeing what Lara has at minute iii is end of minute i? And we’ll be starting a minute ii correction instead of a minute iv?
Thanks in advance…
You caught me snoozin’ Ari!!
Yes of course, the pending minute iv, not minute ii, thanks.
-k
🙂
Macy’s making a bounce today. Looking for a good entry point to short this… it does have a 5% dividend from what I see though.
But technically it’s due for a correction like you mentioned yesterday.
M: 42.44 is the 61.8% retrace of the entire 2016-2017 down move. So I’m looking for some combination in a perfect world of a tag and turn off that level, a break of the daily tf uptrend line, and a polarity switch. That’ll get me in short, probably with a debit spread. Soon!
SPY goes ex-div Friday FYI. Not sure if that matters but some buyers might want to hold on until Friday.
The other side of it is, when this minute iv finally hits, it will set up a cheap opportunity to buy SPY to collect that dividend. If you are bullish and comfortable holding/selling in the future. I suspect this minute iv coming any day now will be driven by big money for exactly that reason. Classic bull market ploy.
NAIL is starting it’s move for any interested. Extremely high leverage product. The spreads are awful but you can’t have everything.
Outstanding for the bulls. Once again you, Lara, have nailed the change in trend coming out of the triangle. Hope all members have been able to take advantage of this up move. Ride the bull!
Ride the bull…detailed instructions on how to in the movie “The Rider”, excellent indie flick, check it out!
Thanks Rodney! Yes, everybody should be making profits, and should be happy.
I’ve got a small buy. Holding on until the target for intermediate (5) is met, or a channel is breached. Whichever comes first.