
Upwards movement continues exactly as the main Elliott wave count and classic technical analysis expect. When classic technical analysis offers strong support to the Elliott wave count, then confidence may be had in the analysis overall.
Summary: The short term target is at 2,824 or 2,915. The mid to longer term target is at 2,922 (Elliott wave) or 3,045 (classic analysis). The final target for this bull market to end remains at 3,616.
The Elliott wave count has good support from classic technical analysis. Price has support from rising market breadth and declining volatility and rising volume.
Pullbacks are an opportunity to join the trend. An upwards trend is expected to be developing. It is possible that upwards movement may show a further increase in momentum over the next several days.
Always practice good risk management. Always trade with stops and invest only 1-5% of equity on any one trade.
New updates to this analysis are in bold.
The biggest picture, Grand Super Cycle analysis, is here.
Last historic analysis with monthly charts is here, video is here.
ELLIOTT WAVE COUNT
WEEKLY CHART
Click chart to enlarge.
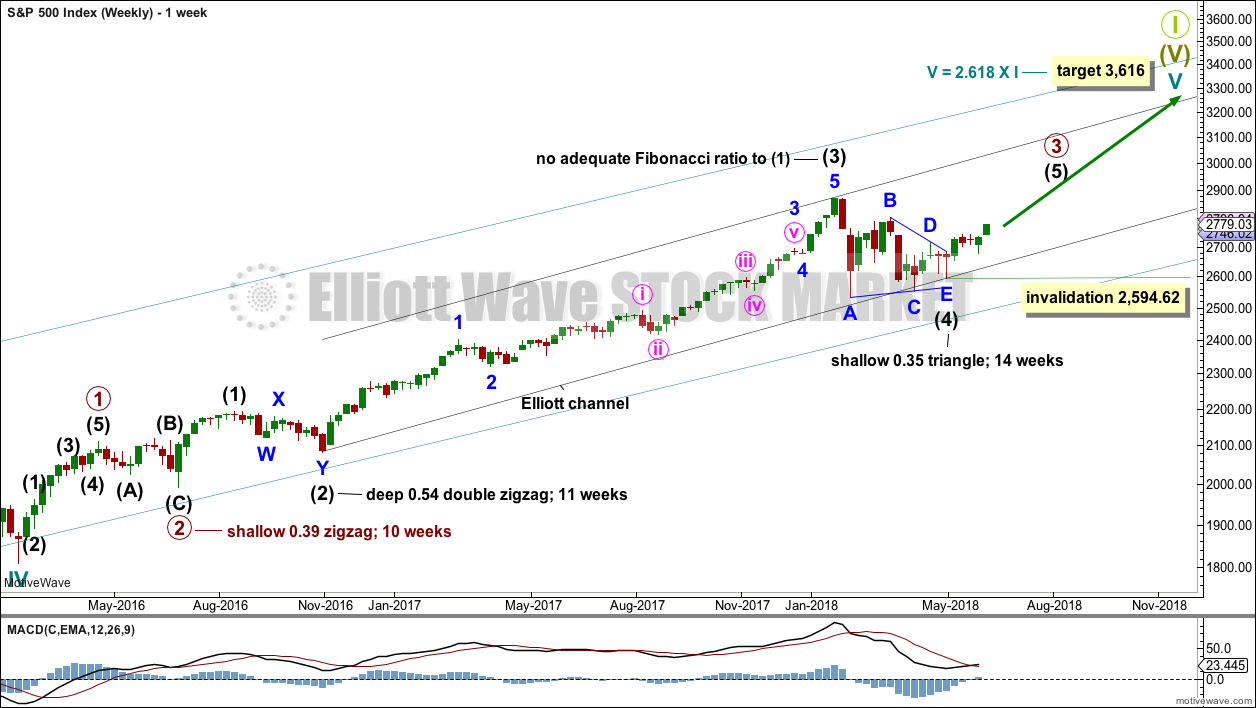
Cycle wave V must complete as a five structure, which should look clear at the weekly chart level and also now at the monthly chart level. It may only be an impulse or ending diagonal. At this stage, it is clear it is an impulse.
Within cycle wave V, the third waves at all degrees may only subdivide as impulses.
Intermediate wave (4) has breached an Elliott channel drawn using Elliott’s first technique. The channel is redrawn using Elliott’s second technique: the first trend line from the ends of intermediate waves (2) to (4), then a parallel copy on the end of intermediate wave (3). Intermediate wave (5) may end either midway within the channel, or about the upper edge.
Intermediate wave (4) may now be a complete regular contracting triangle lasting fourteen weeks, one longer than a Fibonacci thirteen. There is perfect alternation and excellent proportion between intermediate waves (2) and (4).
If intermediate wave (4) were to continue further as either a flat or combination, both possibilities would require another deep pullback to end at or below 2,532.69. With both On Balance Volume and the AD line making new all time highs, that possibility looks extremely unlikely.
If intermediate wave (4) were to continue further, it would now be grossly disproportionate to intermediate wave (2). Both classic technical analysis and Elliott wave analysis now suggest these alternate ideas should be discarded based upon a very low probability.
Within intermediate wave (5), no second wave correction may move beyond the start of its first wave below 2,594.62.
DAILY CHART
Click chart to enlarge.
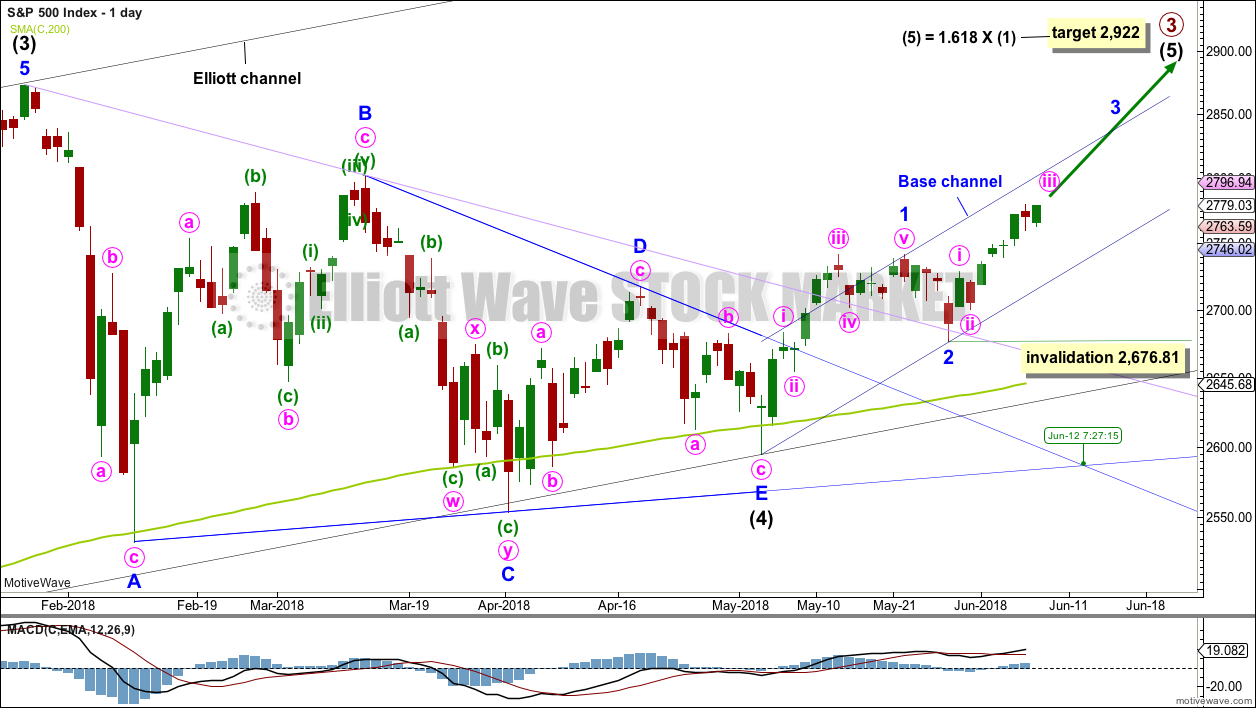
It is possible that intermediate wave (4) is a complete regular contracting triangle, the most common type of triangle. Minor wave E may have found support just below the 200 day moving average and ending reasonably short of the A-C trend line. This is the most common look for E waves of triangles.
Intermediate wave (3) exhibits no Fibonacci ratio to intermediate wave (1). It is more likely then that intermediate wave (5) may exhibit a Fibonacci ratio to either of intermediate waves (1) or (3). The most common Fibonacci ratio would be equality in length with intermediate wave (1), but in this instance that would expect a truncation. The next common Fibonacci ratio is used to calculate a target for intermediate wave (5) to end.
Price has clearly broken out above the upper triangle B-D trend line. This indicates that it should now be over if the triangle is correctly labelled.
A trend line in lilac is added to this chart. It is the same line as the upper edge of the symmetrical triangle on the daily technical analysis chart. Price has found support about this line at the last two small swing lows. The suppport at this line has reasonable technical significance now that it has been tested twice, and this line should be assumed to continue to provide support until proven otherwise.
Sometimes the point at which the triangle trend lines cross over sees a trend change. A trend change at that point may be a minor one or a major one. That point is now about the 12th of June, but may change to the 14th of June on Monday because MotiveWave does not allow for weekends to print no candlesticks.
Minor wave 3 may only subdivide as an impulse, and within it the subdivisions of minute waves ii and iv may show up as one or more red daily candlesticks or doji.
Within minor wave 3, no second wave correction may move beyond the start of its first wave below 2,676.81. Along the way up, any deeper corrections may now find support at the lower edge of the base channel drawn about minor waves 1 and 2. Minor wave 3 may have the power to break above the upper edge of the base channel. If it does, then that upper edge may then provide support.
HOURLY CHART
Click chart to enlarge.
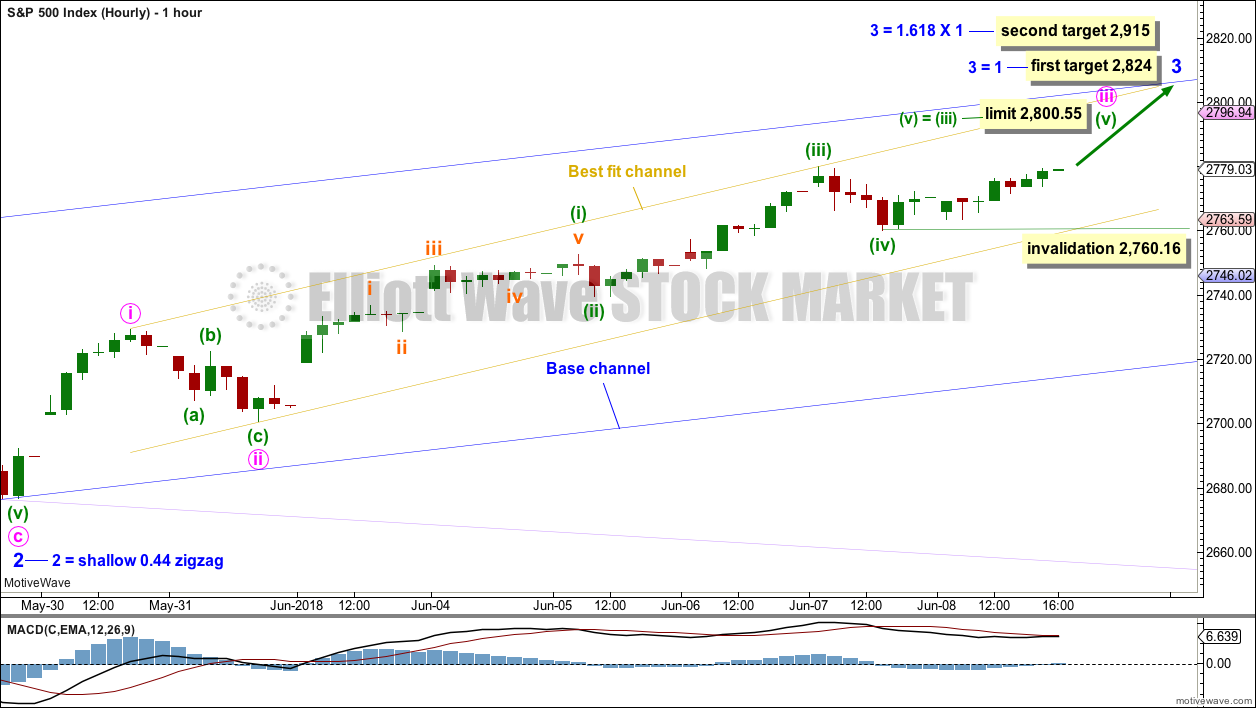
Minor wave 3 may only subdivide as an impulse, and within it all third waves at all degrees may only subdivide as impulses.
This main hourly wave count is now preferred as it fits better with MACD. Momentum for Friday’s upwards movement is slightly waning and this coincides with the fifth wave for minuette wave (v).
Within the impulse of minute wave iii, minuette wave (iii) is shorter than minuette wave (i). This limits minuette wave (v) to no longer than equality in length with minuette wave (iii), so that minuette wave (iii) is not the shortest actionary wave within the impulse and the core Elliott wave rule is met.
A possible target for minute wave iii to end may be about 2,792, where minuette wave (v) would reach 0.618 the length of minuette wave (i).
Minuette wave (iv) may not move into minuette wave (i) price territory below 2,751.61.
When minute wave iii may be complete, then the invalidation point must move down to the high of minute wave i at 2,729.34, and the following correction for minute wave iv may not move into minute wave i price territory. Minute wave iv may end within the price territory of the fourth wave of one lesser degree; minuette wave (iv) has its range from 2,779.90 to 2,760.16.
ALTERNATE HOURLY CHART
Click chart to enlarge.
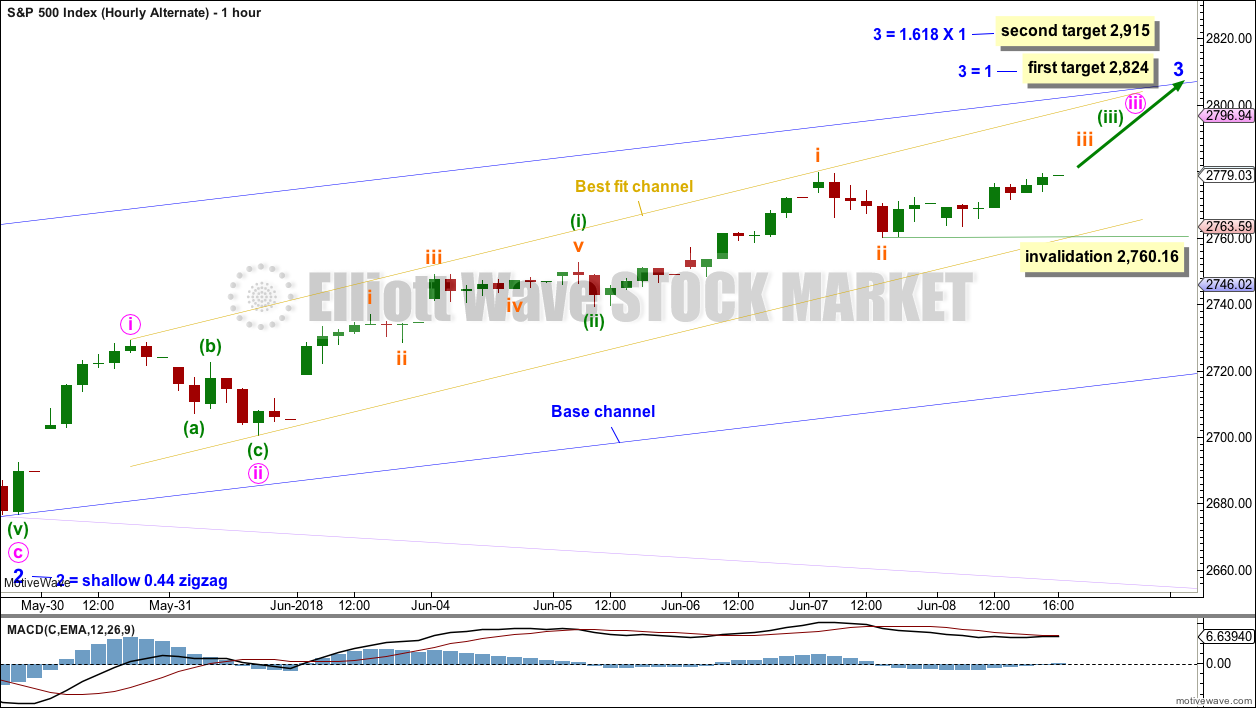
This alternate wave count now has a lower probability than the main hourly wave count. Friday’s upwards movement shows weaker momentum and this does not coincide with the middle of a third wave at four degrees.
Both wave counts are identical up to the low labelled minuette wave (ii). Thereafter, for this alternate, the degree of labelling within minuette wave (iii) is moved down one. Within minuette wave (iii), only subminuette waves i and ii may be complete.
This wave count now sees four first and second waves complete. A strong increase in upwards momentum should begin about here as the middle of a third wave unfolds higher.
Within subminuette wave iii, no second wave correction may move beyond its start below 2,760.16.
TECHNICAL ANALYSIS
WEEKLY CHART
Click chart to enlarge. Chart courtesy of StockCharts.com.
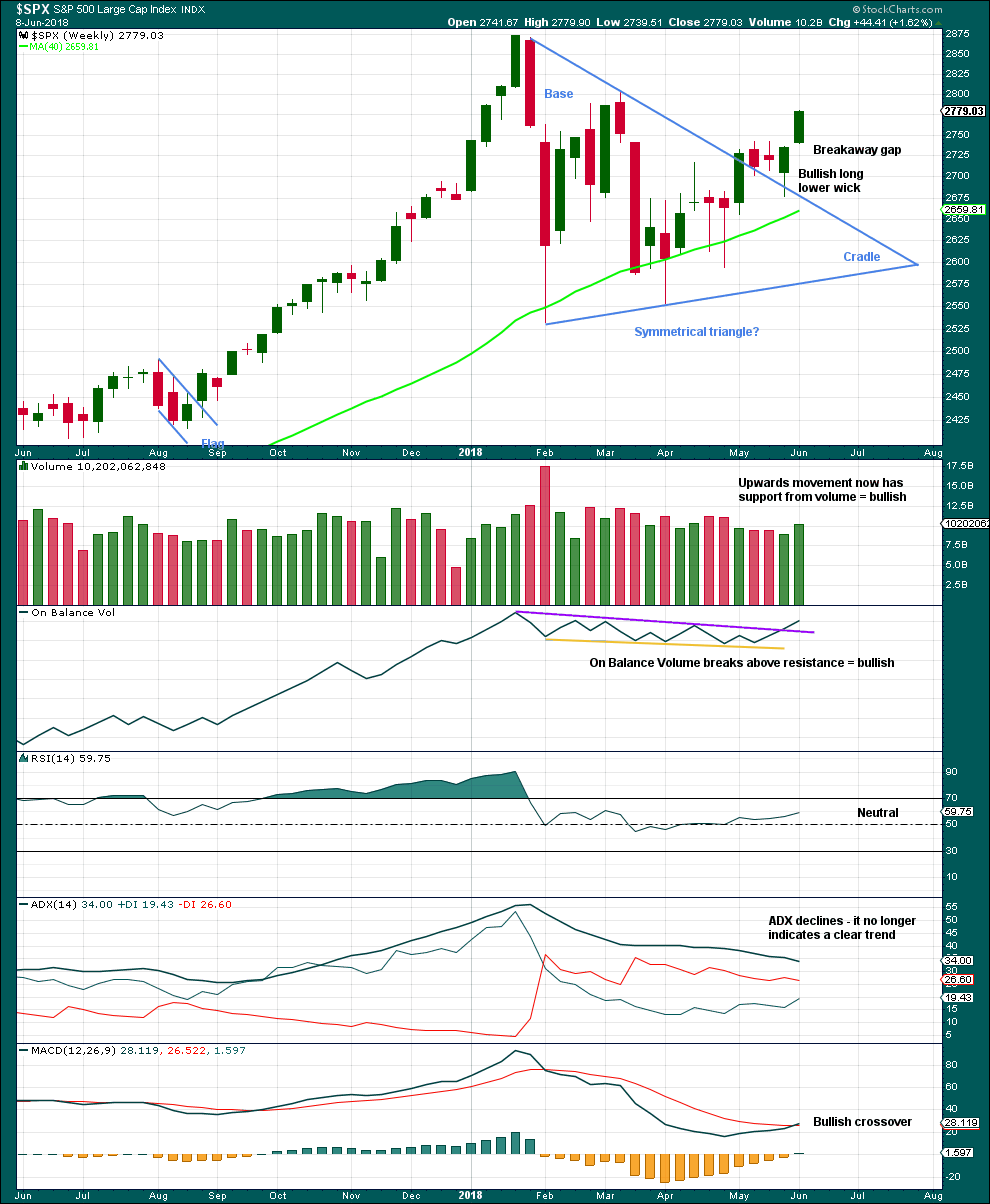
This week closes very bullish with support from volume. The gap open this week moves up from a small three week consolidation, so it may be a breakaway gap; if this is correct, then the lower edge may provide support at 2,736.93.
The bullish signal from On Balance Volume is now very clear. If next week sees On Balance Volume move higher again, then it may make a new all time high; if it does, then that would be a very bullish signal.
Overall, this chart is fairly bullish.
DAILY CHART
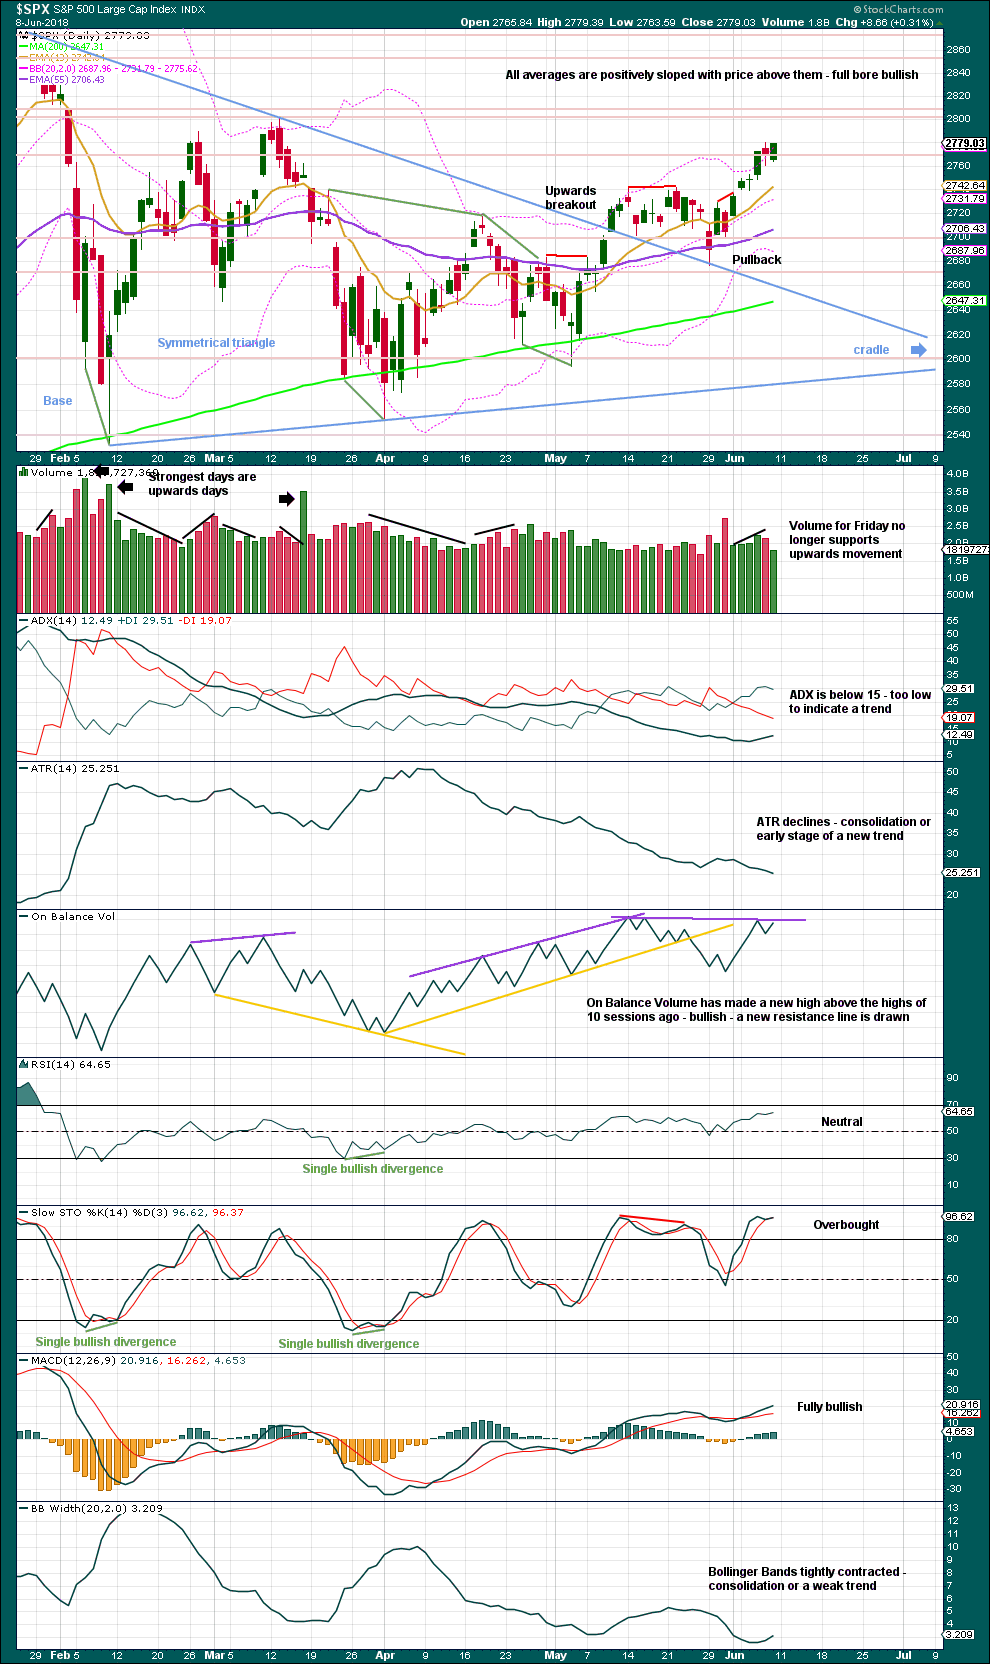
Click chart to enlarge. Chart courtesy of StockCharts.com.
The symmetrical triangle may now be complete, and price has completed an upwards breakout. There may be some small cause for concern that the upwards breakout does not have support from volume. However, in current market conditions only some small concern is had here. Rising price on light and declining volume has been a feature of this market for years, yet price continues to rise.
After an upwards breakout, pullbacks occur 59% of the time. The pullback looks typical. With price now moving up and away from the line, it does look like the pullback may be over.
On Balance Volume made a new all time high on the 14th of May at the daily chart level. This signal remains overall very bullish.
The base distance is 340.18. Added to the breakout point of 2,704.54 this gives a target at 3,044.72. This is above the Elliott wave target at 2,922, so the Elliott wave target may be inadequate.
On Balance Volume remains slightly bearish for the short term as it still has not made a new high above the prior swing high of the 14th of May while price has, but the difference for On Balance Volume is so very slight no weight will be given to this in today’s analysis.
There is no new divergence between price and On Balance Volume. Friday’s candlestick is very bullish.
Stochastics may remain overbought for a reasonable period of time during a bull trend for this market.
VOLATILITY – INVERTED VIX CHART
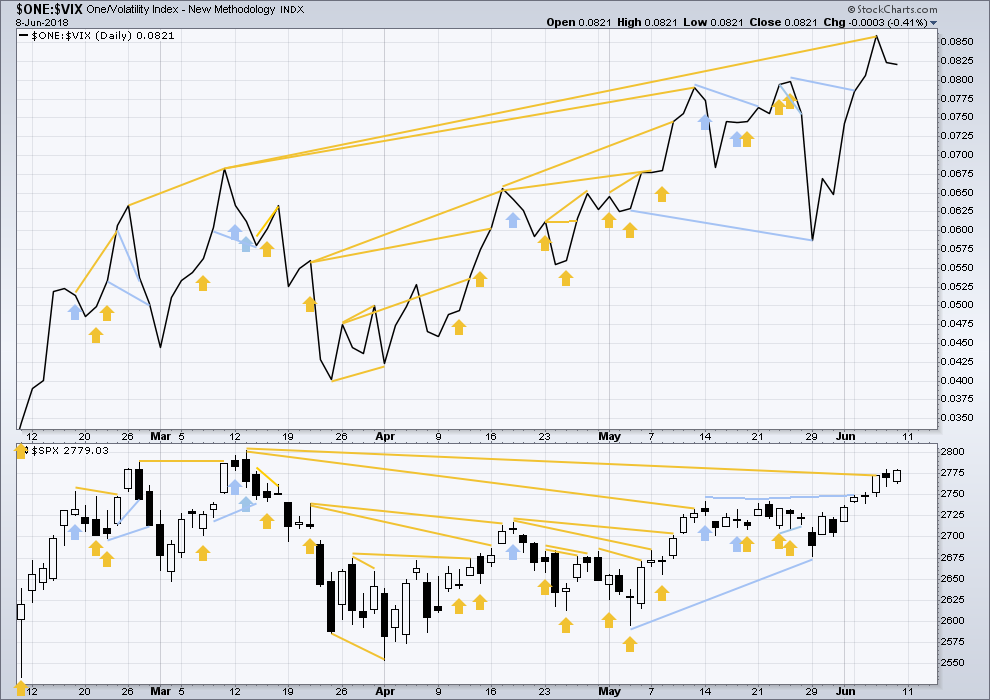
Click chart to enlarge. Chart courtesy of StockCharts.com. So that colour blind members are included, bearish signals
will be noted with blue and bullish signals with yellow.
Normally, volatility should decline as price moves higher and increase as price moves lower. This means that normally inverted VIX should move in the same direction as price.
Inverted VIX has made a new high above the prior swing high of the 9th of March, but price has not made a corresponding new swing high about the same point yet. This divergence is bullish. Inverted VIX is still a little way off making a new all time high.
There is no new divergence today.
BREADTH – AD LINE
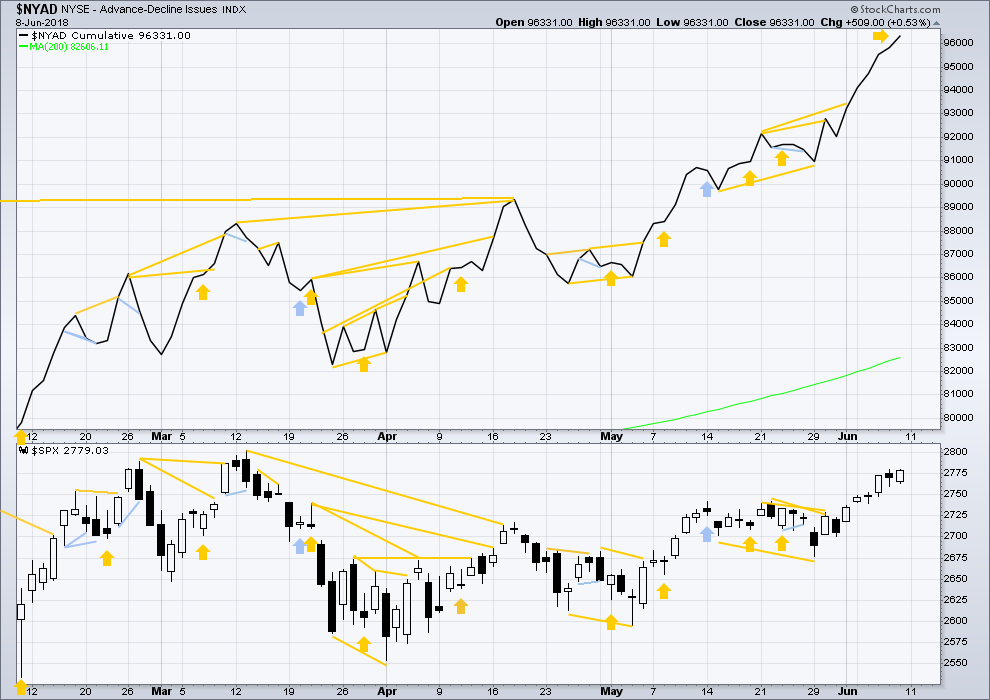
Click chart to enlarge. Chart courtesy of StockCharts.com.
There is normally 4-6 months divergence between price and market breadth prior to a full fledged bear market. This has been so for all major bear markets within the last 90 odd years. With no longer term divergence yet at this point, any decline in price should be expected to be a pullback within an ongoing bull market and not necessarily the start of a bear market. New all time highs from the AD line means that any bear market may now be an absolute minimum of 4 months away. It may of course be a lot longer than that. My next expectation for the end of this bull market may now be October 2019.
Small caps made a new all time high last week. Now mid caps make a new all time high this week. It is large caps that usually lag in the latter stages of a bull market, so this perfectly fits the Elliott wave count. Expect large caps to follow to new all time highs.
Breadth should be read as a leading indicator.
The AD line is daily making new all time highs. This is a very bullish signal and will be given the most weight in today’s analysis. Price is likely to follow within days or a very few weeks.
DOW THEORY
The following lows need to be exceeded for Dow Theory to confirm the end of the bull market and a change to a bear market:
DJIA: 23,360.29.
DJT: 9,806.79.
S&P500: 2,532.69.
Nasdaq: 6,630.67.
Only Nasdaq at this stage is making new all time highs. DJIA and DJT need to make new all time highs for the ongoing bull market to be confirmed.
Charts showing each prior major swing low used for Dow Theory may be seen at the end of this analysis here.
Published @ 12:24 a.m. EST on 9th June, 2018.
Looks like someone/something decided to try to kick-start the minute ii down!! It might even work. I launched an SPX bear debit put spread close to the highs, as well as picked up some spxu. I’m operating on the thesis that the rise in volatility’s going to give my spread extra kick as price drops. Kawabunga…
Kevin , enjoying your trading ideas – just want to say thank you for your insights , and your thoughts .
I took your googl trade a couple of weeks ago . wow what a ride that was .
You’re welcome Fred! This market is getting “good” again, meaning, “a bit more predictable”, less volatile, back to the fairly steady grind higher. It’s nice to have the support of the higher tf wave count isn’t it? Oh yea it is!!
Momentum still indicates this is the more likely hourly wave count. That could change of course, but for now with the data in hand this is it.
Minute iii could be over at any point now. Minute iv may remain within the best fit channel. Look for support at the lower edge in the first instance.
/CL (oil futures) has broken the daily and hourly level downtrend and polarity inverted. I’m definitely bullish oil stocks again here (tempered by the impending minute 2 of course…but as that ends, I like oil stocks again here!).
NUGT is at only 5% of it’s historical implied volatility (it’s at 21%). The “Middle” of it’s historical volatility looks to be around 45%! So I’ve put on a small straddle, to see if I can catch net profit on the volatility rise, whatever direction the underlying moves in. (I separately have a long call debit spread on it, because I’m also a bullish gold.)
I second that…
It also seems that JNUG is even less volatile than NUGT.
And just FYI Kevin, I bought some MTDR at its lows of the day today. Seemed like a bottom of a second wave correction primed to move higher.
Thanks for all of your recommendations and good charts 🙂
I hope you are on to something with MTDR Ari…I bought some today as well!! Considered a spread, but went with the outright purchase.
Anybody see (and hear) “It Might Get Loud”, with Jack White (White Stripes guitarist), The Edge (U2 guitarist) and Jimmy Page (Led Zepplin guitarist)? Worthwhile, I recommend it. To start the movie, Jack White out in a field hammers 2 nails in a board, tightens a wire between them, hammer’s a pickup under it, wires that to an electric car battery and to a speaker cone sitting in a bucket. Proceeds to start jamming hard with a coke bottle on his electric string, and concludes with “you don’t need to go buy some expensive guitar!”.
You don’t any complicated indicators to trade either. Here’s the raw essential story of XLP, all I really need to know. I’m long.
Hi Kevin
Do you think the S & P makes it up to 2796 before minute 4 starts.
Thank You
I don’t know.
That said, my best guess is price tops right around the 78.6% fibo (of the Jan-Feb 11% price fall) at 2796.4 Or at either of the major swing pivots around 2789 and 2802.
We know it’ll be somewhere close, so it’s merely a matter of watching for the turn, and then pre-defined sell triggers. I like the tightest trend line on the hourly broken, and a polarity switch to lower lows/lower highs on the 5 minute and hourly as fundamental triggers. I am prone to jumping the gun a little, usually with some initial scaling (the “pilot position”).
Retail is for some reason (sector rotation I guess?) has been going nuts. Macy’s (M) has gone parabolic. I’m watching for a good short set up, coincident with this approaching minute 2 in SPX which should cool lots of sectors off a bit.
Here’s some high volatility / high leverage tickers (GBTC, NAIL, GUSH) compared with the strongest of the more mainstream tickers that are strong (XLE, XLK, SPX), over one year. This is the longer term view showing how hugely the high volatility tickers can outperform, and over much of the last year, did outperform.
GUSH = purple, GBTC = Maroon, XLE = blue, XLK = yellow, SPX = green, NAIL = white.
Note that GBTC peaks at about 800% (off the top by A LOT!).
And here are the same tickers, with relative performance (daily) since April 2 (about 9 weeks). NAIL appears to be on the move, and GUSH appears to be setting up well for the long side. If you like high leverage on your exposed $$!!
Here’s an interesting view. All of the “monster” market caps around tech (FAANGM = fb, aapl, amzn, nflx, googl, msft), and XLK, compared starting from “equal” on 4/23. So only the most recent 6 weeks or so of relative performance.
The order of lines top to bottom (as of Friday) are: AAPL (blue), FB (purple), NFLX (white), AMZN (maroon), XLK (green), MSFT (orange), GOOGL (yellow).
All eyes alert for the start of the minute iv next week, as that will be a multi-day (probably 2-3) pullback, and by comparison the corresponding minute ii retreated 28 points. Could be another excellent spot for a bear spread at the top with intention to cash the short leg and hold the long.
I have a question (Verne and others) about doing such a play with a bear credit call spread vs. bear debit put spread. I would anticipate IV of SPX (which is the VIX => price of SPX options over 15-45 day expiry window) will increase during this minute iv. By using a put debit spread, we’re net long options overall, and the rising IV will drive the option prices higher (more $$ for time premium), thus increasing the net profit of our position. That increase in IV (option prices) will all be in our purchased put, which we sell at the bottom of the minute iv (let’s assume perfection as a thought experiment anyway!). We are left short a put with a depressed price. But now when the minute v kicks in, the put quickly recovers to full profitability (i.e. will expire worthless) not just because of movement of the underlying SPX but also because historical and IV will drop as prices rise. So we are on the right side of volatility in both directions by using a debit spread in this case.
The overall concept being pretty simple: when trading options, we are trading TWO things simultaneously: the price MOVEMENT of the underlying, and the option pricing (which is largely but not solely driven by the historical volatility of the underlying). Best to execute our trades so likely movement in BOTH are in our favor, right?
So why do you use credit spreads here instead Verne? Is it because with a credit spread you are left after closing the short leg with a long option position which has more upside potential vs. a debit spread you are left short an option with a capped profit opportunity? I can understand that logic, but it also seems to be operating “against the tidal forces” a bit.
Thanks for any insights. I’ve been successful using options recently…but am still learning how to really maximize with them! Trading the volatility change in a manner aligned with the underlying change seems critical. Because with options we really aren’t trading the underlying: we are trading the options themselves.
Kevin, my 2 sense….as inhave used it recently.
Reason #1. I use credit because i rather be theta positive since in case im wrong and the mive is nit as pronounced as expected
Reason #2 if my goal is to ride the upside afterwards then being left a call gives unlimited potential but im short theta.
For that reason, I have been using Verne idea with a diagonal spread! I recently tried it and so far so good. Long a 3 month out and selling a short term! Verne will surely shine more lite
Nothing wrong with the put debit spread on an anticipated counter-trend downside move. I take it the aim here is to limit the cost of going short by off-setting the cost of the higher strike put with the credit from sale of the lower priced one.
The other side of the coin, the bear call credit spread I think has the advantage of paying you to make the counter trend trade and seems to me to offer more potential as you will be left holding the long calls for resumption of the uptrend.
You have to time the sale of the long put carefully so as not to put yourself at undue risk with the short put in case price falls more than you anticipated.
With the call spread, the initial profit taking move, namely, buy back of the short calls as they fall in price with the counter-trend move down, does not pose the same risk as you are left holding the long calls, as opposed to being short the puts. You also have a second opportunity to sell the long calls later, (for me, the real purpose of opening the credit spread) as opposed to just letting (hoping) the short puts expire worthless.
You will probably also need another level of permission to trade naked short puts or calls but that should not be a problem if you have already been cleared for trading spreads.
Hi Lara,
Thank you for all your great analysis! I have a question for you and/or anyone else here that wants to share opinion. I also, follow you weekly report which includes oil and gold. I wanted to know if this looks like a reasonable set up to take a speculative position in Gush. It is a leveraged oil and gas etf in the USA. Does this look like an Elliotwave continuation triangle with E incomplete? I was thing of taking a position after a zig zags down (presumably E completion). I may need to post the second photo on next post.
Idea
Sorry for the bad grammar. Maybe D is incomplete?
There may be support now about the bottom of A.
B could also continue higher.
I’d be patiently waiting for a clearer triangle, or hedging.
If you think a triangle is unfolding, it’s essential to have an alternate wave count. Consider a combination, and consider a flat too.
Too many times over the years I’ve thought a triangle is almost complete, or even complete, only to see price whipsaw and invalidate the triangle. It turns out to be something else, usually a combination.
Considering the alternates shows other pathways for price, and may push resistance and support out, making your decisions on where to enter and where to put stops including more scenarios.
I see Oil at this time as within a larger consolidation, and within that beginning a B wave up. They really are the worst of trading opportunities, so unpredictable and so many structures possible.
Thanks Lara,
i’ll wait for clarity. In the mean time i’m doing well trading in and out of spxl and svxy.
Thanks for pointing out this opportunity in GUSH! I will be taking it on a break out (upward) from the current consolidation area. It’s a mover, very high leverage, I like it! But wherefore oil? That’s the big question.