
Upwards movement continues exactly as the main Elliott wave count expects.
Summary: The short term target is at 2,824 or 2,915. The mid to longer term target is at 2,922. The final target for this bull market to end remains at 3,616.
Another strong new all time high from the AD line again prompts me to discard bearish alternate hourly wave counts.
Pullbacks are an opportunity to join the trend. An upwards trend is expected to develop, which has very strong support from new all time highs from the AD line and On Balance Volume.
Always practice good risk management. Always trade with stops and invest only 1-5% of equity on any one trade.
New updates to this analysis are in bold.
The biggest picture, Grand Super Cycle analysis, is here.
Last historic analysis with monthly charts is here, video is here.
ELLIOTT WAVE COUNT
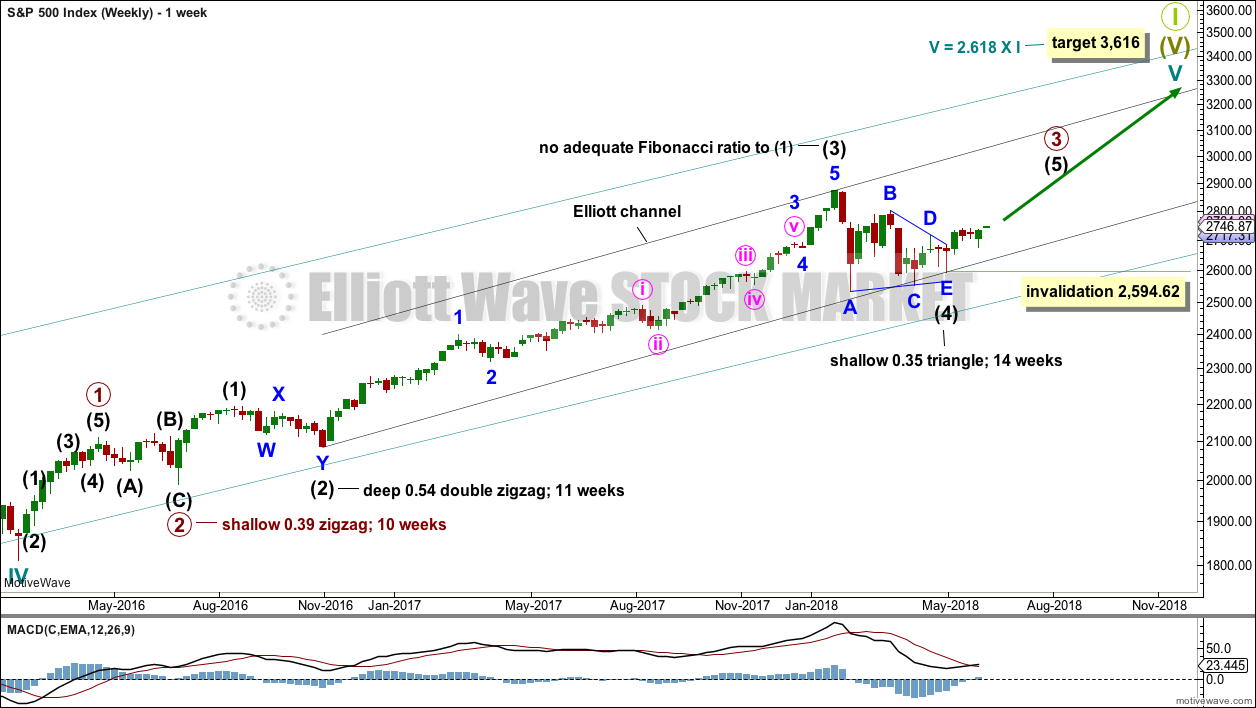
WEEKLY CHART
Click chart to enlarge.
Cycle wave V must complete as a five structure, which should look clear at the weekly chart level and also now at the monthly chart level. It may only be an impulse or ending diagonal. At this stage, it is clear it is an impulse.
Within cycle wave V, the third waves at all degrees may only subdivide as impulses.
Intermediate wave (4) has breached an Elliott channel drawn using Elliott’s first technique. The channel is redrawn using Elliott’s second technique: the first trend line from the ends of intermediate waves (2) to (4), then a parallel copy on the end of intermediate wave (3). Intermediate wave (5) may end either midway within the channel, or about the upper edge.
Intermediate wave (4) may now be a complete regular contracting triangle lasting fourteen weeks, one longer than a Fibonacci thirteen. There is perfect alternation and excellent proportion between intermediate waves (2) and (4).
If intermediate wave (4) were to continue further as either a flat or combination, both possibilities would require another deep pullback to end at or below 2,532.69. With both On Balance Volume and the AD line making new all time highs, that possibility looks extremely unlikely.
If intermediate wave (4) were to continue further, it would now be grossly disproportionate to intermediate wave (2). Both classic technical analysis and Elliott wave analysis now suggest these alternate ideas should be discarded based upon a very low probability.
Within intermediate wave (5), no second wave correction may move beyond the start of its first wave below 2,594.62.
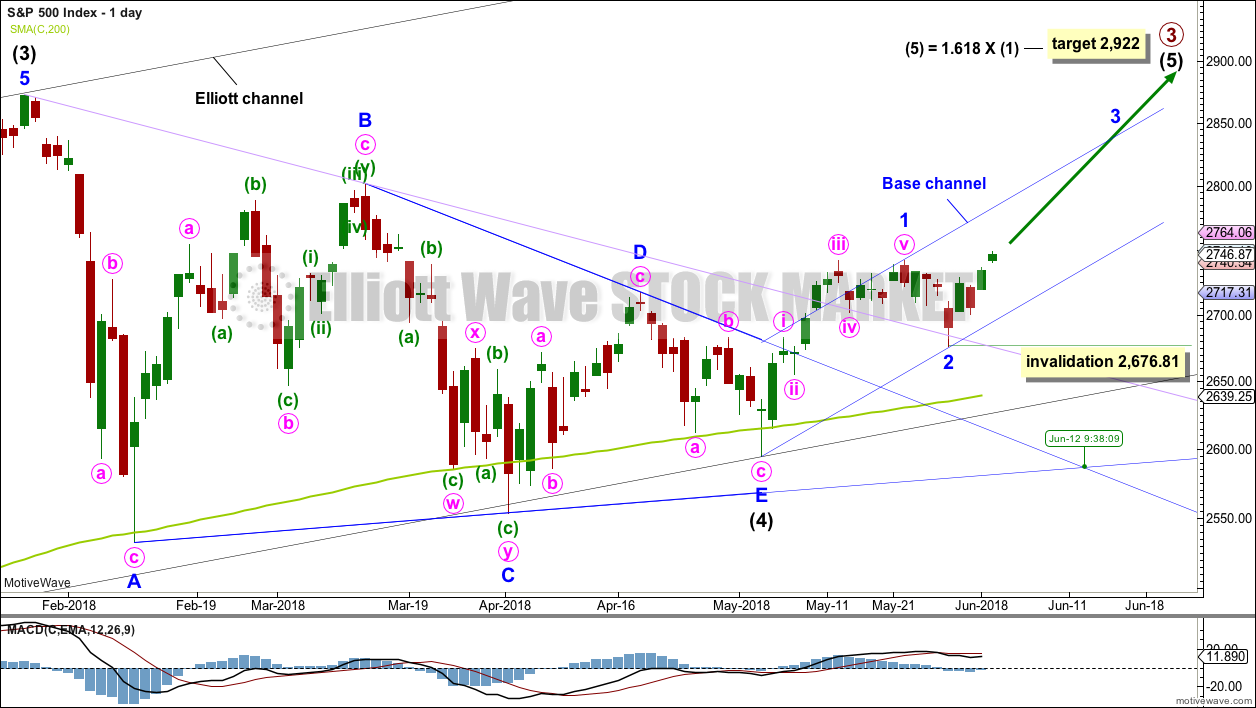
DAILY CHART
Click chart to enlarge.
It is possible that intermediate wave (4) is a complete regular contracting triangle, the most common type of triangle. Minor wave E may have found support just below the 200 day moving average and ending reasonably short of the A-C trend line. This is the most common look for E waves of triangles.
Intermediate wave (3) exhibits no Fibonacci ratio to intermediate wave (1). It is more likely then that intermediate wave (5) may exhibit a Fibonacci ratio to either of intermediate waves (1) or (3). The most common Fibonacci ratio would be equality in length with intermediate wave (1), but in this instance that would expect a truncation. The next common Fibonacci ratio is used to calculate a target for intermediate wave (5) to end.
Price has clearly broken out above the upper triangle B-D trend line. This indicates that it should now be over if the triangle is correctly labelled.
A trend line in lilac is added to this chart. It is the same line as the upper edge of the symmetrical triangle on the daily technical analysis chart. Price has found support about this line at the last two small swing lows. The suppport at this line has reasonable technical significance now that it has been tested twice, and this line should be assumed to continue to provide support until proven otherwise.
Sometimes the point at which the triangle trend lines cross over sees a trend change. A trend change at that point may be a minor one or a major one. That point is now about the 12th of June.
Minor wave 3 may only subdivide as an impulse, and within it the subdivisions of minute waves ii and iv may show up as one or more red daily candlesticks or doji. So far the last red daily candlestick may be minute wave ii.
Within minor wave 3, no second wave correction may move beyond the start of its first wave below 2,676.81.
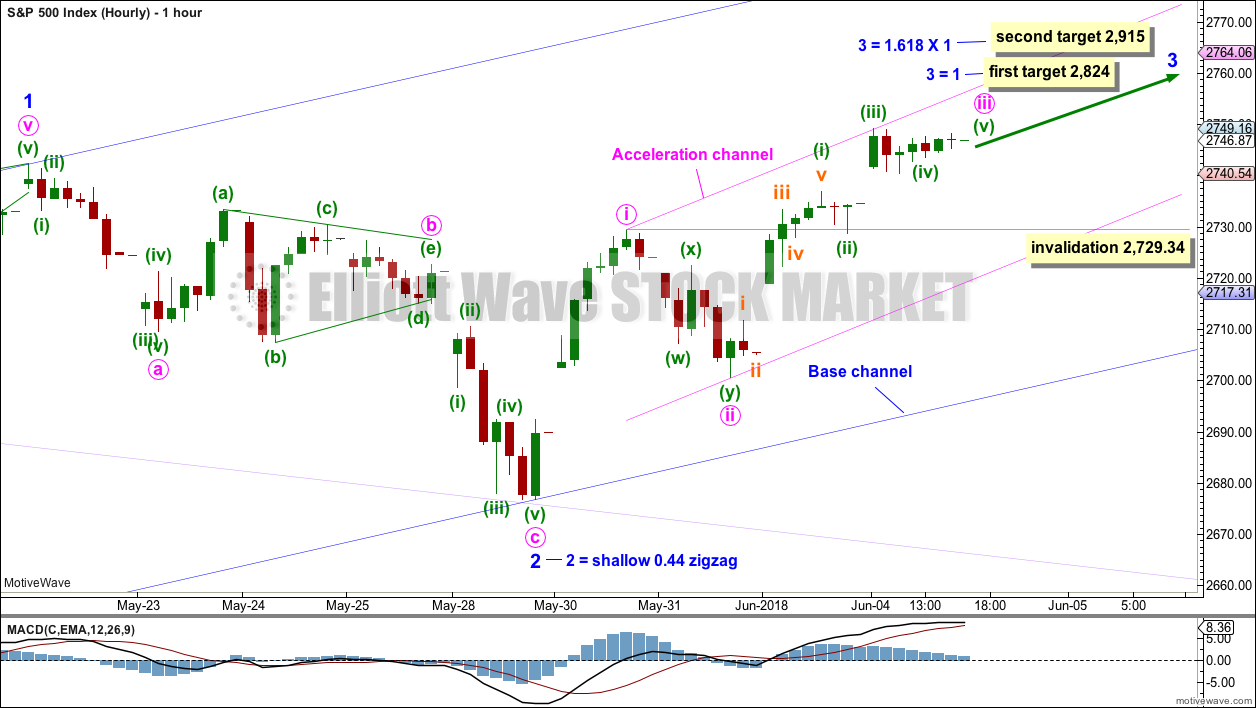
HOURLY CHART
Click chart to enlarge.
Minor wave 2 may be a complete zigzag. There is no adequate Fibonacci ratio between minute waves a and c.
The daily chart is on a semi-log scale. This hourly chart is on an arithmetic scale, and this is why the lilac trend line sits slightly differently on each chart. On this hourly chart, price perfectly found support at the lilac trend line. Minor wave 2 ends with a strong bullish engulfing candlestick pattern.
A base channel is added to minor waves 1 and 2: draw the first trend line from the start of minor wave 1 on the low of the 3rd of May, to the end of minor wave 2, then place a parallel copy on the end of minor wave 1. Corrections should find support about the lower edge of this base channel as minor wave 3 unfolds along the way up.
Minor wave 2 was relatively shallow, less than 0.5 of minor wave 1. Look out for corrections now within minor wave 3 to possibly be more shallow than otherwise expected.
Within minute wave iii, minuette waves (i), (ii), (iii) and now (iv) may be complete. If this labelling is correct, then minuette wave (iii) is shorter than minuette wave (i) by 15.83 points. This limits minuette wave (v) to no longer than equality in length with minuette wave (iii) at 2,764.06, so that the core rule stating a third wave may not be the shortest is met. Minute wave iii may end prior to 2,764.06.
Minute wave iv may not move into minute wave i price territory below 2,729.34.
Add an acceleration channel about minor wave 3 as shown in pink. When minute wave iii is complete and minute wave iv arrives, then the lower edge of this channel may offer support.
Two targets are given for minor wave 3 to end, and both fit with the higher target for primary wave 3 to end on the daily chart. If price keeps on rising after the first target has been reached, or the structure is incomplete, then the second target will be used.
An alternate idea would be to move the degree of labelling within minute wave iii down one degree, so it may be that only minuette wave (i) is coming to an end. The invalidation point for this alternate idea would then be at the start of minute wave iii at 2,700.68 (current labelling). Therefore, if the degree of labelling is moved down one degree, then minuette wave (ii) may not move beyond the start of minuette wave (i) below 2,700.68. The lower edge of the acceleration channel for this idea would be expected to also provide support.
TECHNICAL ANALYSIS
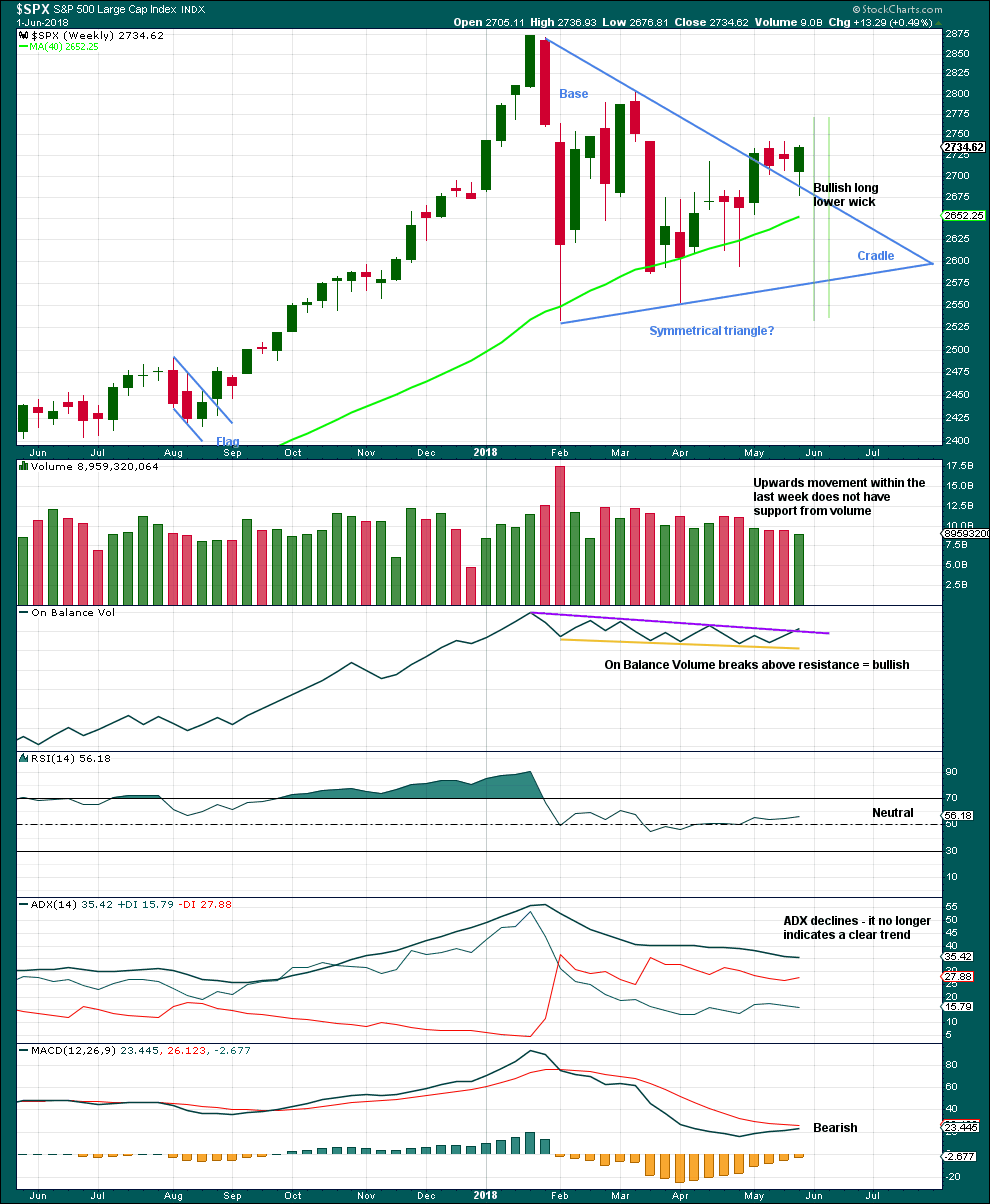
WEEKLY CHART
Click chart to enlarge. Chart courtesy of StockCharts.com.
From Dhalquist and Kirkpatrick on trading triangles:
“The ideal situation for trading triangles is a definite breakout, a high trading range within the triangle, an upward-sloping volume trend during the formation of the triangle, and especially a gap on the breakout.”
For this example, the breakout may have now happened. There was a high trading range within the triangle, but volume declined. Last week may be the end of the pullback, with a long lower wick slightly overshooting the triangle trend line.
The bullish signal from On Balance Volume Last week is reasonable, but really does need to be clearer for confidence. If this week continues upwards, it would be clear and then should be given reasonable weight.
DAILY CHART
Click chart to enlarge. Chart courtesy of StockCharts.com.
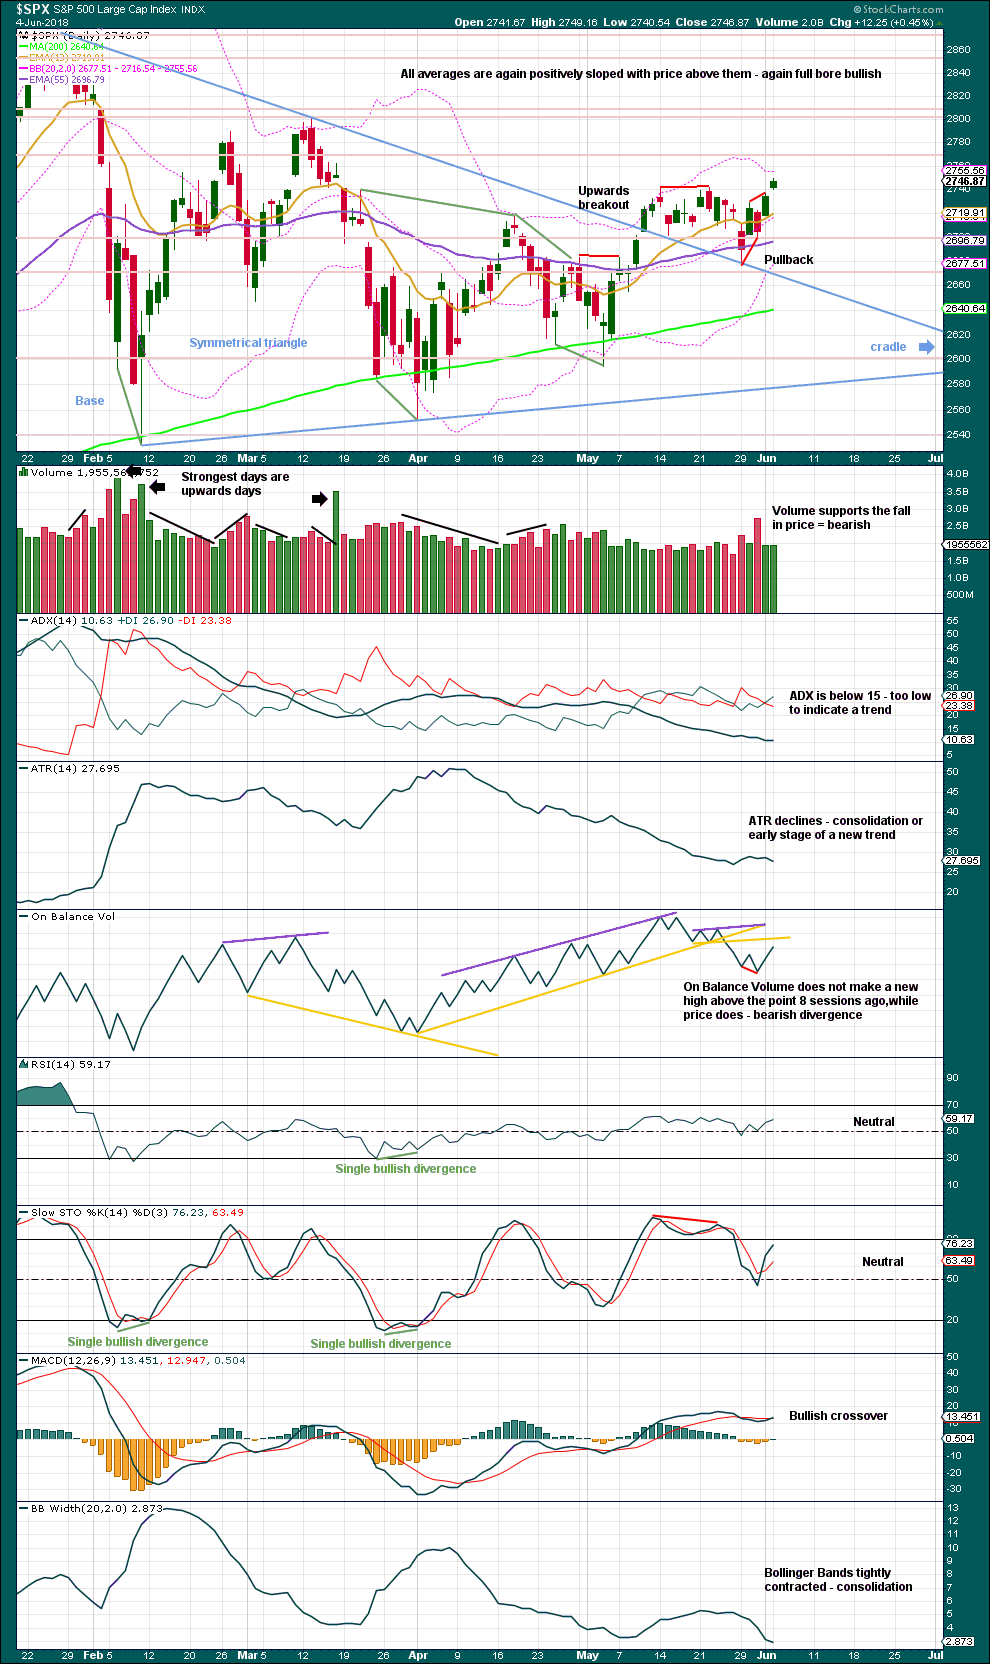
The symmetrical triangle may now be complete, and price has completed an upwards breakout. There may be some small cause for concern that the upwards breakout does not have support from volume. However, in current market conditions only some small concern is had here. Rising price on light and declining volume has been a feature of this market for years, yet price continues to rise.
After an upwards breakout, pullbacks occur 59% of the time. The pullback looks typical. With price now moving up and away from the line, it does look like the pullback may have been over last week.
On Balance Volume made a new all time high on the 14th of May at the daily chart level. This signal remains overall very bullish.
The base distance is 340.18. Added to the breakout point of 2,704.54 this gives a target at 3,044.72. This is above the Elliott wave target at 2,922, so the Elliott wave target may be inadequate.
The short term volume profile remains slightly bearish, but in current market conditions this will not be given much weight in this analysis. On Balance Volume moved higher today with price, but it has not yet made a new high above the prior high of the 14th of May or the 22nd of May, yet price has done so today. With On Balance Volume lagging, this is still a short term bearish signal.
VOLATILITY – INVERTED VIX CHART
Click chart to enlarge. Chart courtesy of StockCharts.com. So that colour blind members are included, bearish signals
will be noted with blue and bullish signals with yellow.
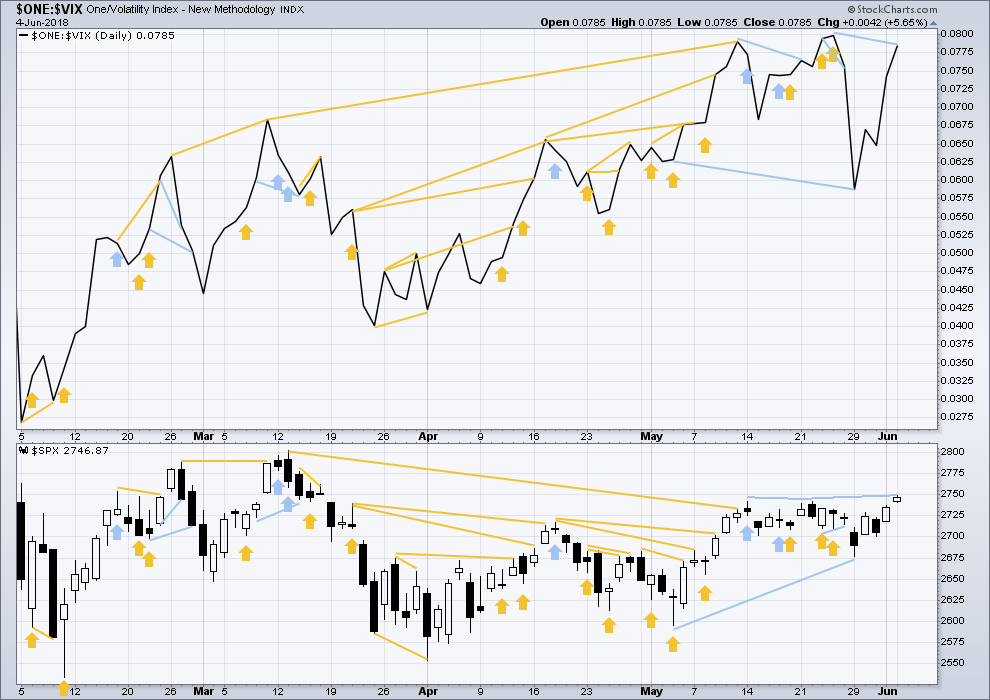
Normally, volatility should decline as price moves higher and increase as price moves lower. This means that normally inverted VIX should move in the same direction as price.
Both price and inverted VIX moved higher today. Price has made a new swing high above the prior point of the 22nd / 24th of May, but inverted VIX has not. This divergence is bearish for the short term.
BREADTH – AD LINE
Click chart to enlarge. Chart courtesy of StockCharts.com.
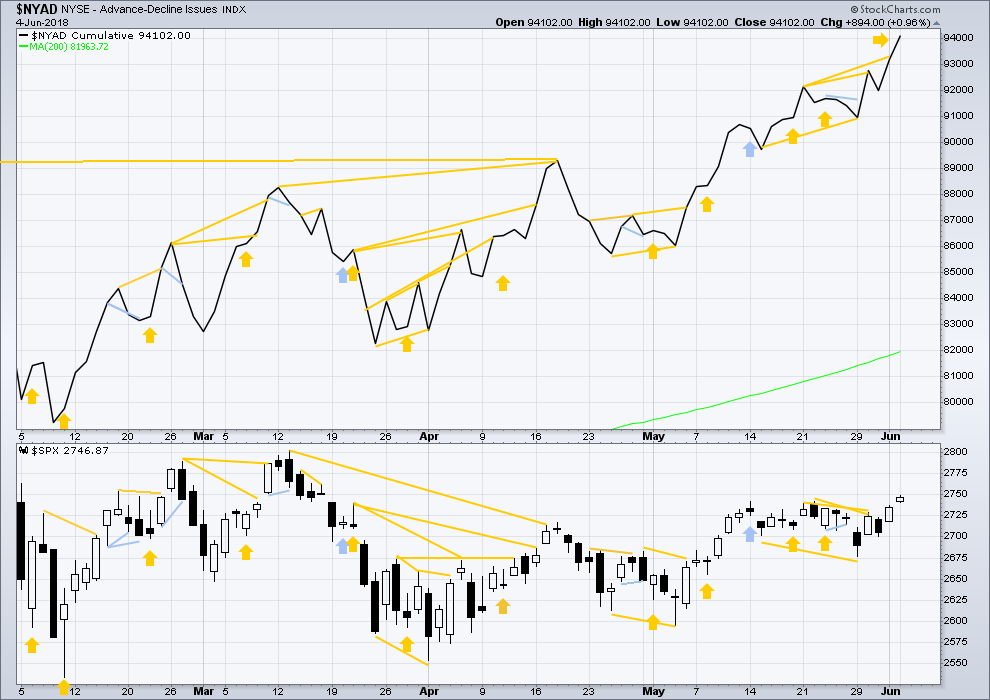
There is normally 4-6 months divergence between price and market breadth prior to a full fledged bear market. This has been so for all major bear markets within the last 90 odd years. With no longer term divergence yet at this point, any decline in price should be expected to be a pullback within an ongoing bull market and not necessarily the start of a bear market. New all time highs from the AD line means that any bear market may now be an absolute minimum of 4 months away. It may of course be a lot longer than that. My next expectation for the end of this bull market may now be October 2019.
Small caps have made another new all time high, but mid and large caps have yet to do so. This divergence may be interpreted as bullish. Small caps may now be leading the market.
Breadth should be read as a leading indicator.
The AD line moves again strongly higher to another new all time high today. This is a very bullish signal and will be given the most weight in today’s analysis. Price is likely to follow within days or a very few weeks.
DOW THEORY
The following lows need to be exceeded for Dow Theory to confirm the end of the bull market and a change to a bear market:
DJIA: 23,360.29.
DJT: 9,806.79.
S&P500: 2,532.69.
Nasdaq: 6,630.67.
At this stage, only DJIA has made a new major swing low. DJT also needs to make a new major swing low for Dow Theory to indicate a switch from a bull market to a bear market. For an extended Dow Theory, which includes the S&P500 and Nasdaq, these two markets also need to make new major swing lows.
Charts showing each prior major swing low used for Dow Theory may be seen at the end of this analysis here.
Published @ 06:23 p.m. EST.
The RUT is on fire!
Why didn’t I buy more?
Good morning everybody.
I can now see a five up complete off the low I’m labelling minor 2. I’m moving it down one degree because when I look at it now on the daily chart it’s just not long enough to be minute waves i, ii and now iii.
The blue base channel about minor waves 1 and 2 should still be where any deeper corrections find support, including minute ii. Minute ii may more shallow than expected.
I’m a tad suspicious of that minuette iv. Could it be continuing as a flat or expanded flat? If so, it will be challenging to differentiate between that and the start of the minute ii.
Some are confident of a sell off here not just for structural reasons (i.e. the pesky minute ii), but due to large players driving down the price of SPY for some accumulation next week going into ex-div on the 15th.
It most certainly could be incomplete Kevin. It’s a very nice zigzag on the 5 minute chart, and that could be only wave A of a flat or wave W of a combination.
Both of those ideas would see it move sideways a bit more tomorrow. Not much lower. (except if it’s an expanded flat, we’ll look out for that)
It’s unlikely to be a double zigzag because that was the structure for minuette (ii), those are sloping corrections so that’s the least likely scenario for tomorrow.
Buying another 50 contracts of VIX 12.00 strike calls expiring June 13.
These guys are really too funny! Way too much bull! 🙂
Keeping stink bids open in case we see a spike down on expiration tomorrow.
Great hanging out!
Have a great evening everyone!
I got 150 hit for July’s, lowest executed today!@! Just silly……Also, throwing in another round of bull put spreads on UVXY. (not trading advice)
From my perspective looking at the SPX daily chart (1st one below) we have a perfect triangle breakout with a test of the upper triangle trend line. I think this is a very bullish chart pattern.
The second chart I’ve included below is a 2 Day candle to show all the way back to the low in early 2016. The EW labeling is not important on this chart. What I see is a nice strong bullish move from ~ 1800 to ~ 2800. A one thousand point move. It looks like a bull flag or bull pennant formation from Feb 2018 through May. If the flag flies at half mast and this is correctly identified as a bull flag, it signals another 1000 SPX point move to come. This is right in line with Lara’s longer term target of ~3600 which is measured from the crossing of the flag pattern lines at 2600 up 1000 points to 3600.
Believe it or not. But you heard it from Lara first!
1st Chart
2nd chart
Great points Rod. I would only note that you also had in the indices a break from a parabolic rise, which took the indices beneath a years-long trend line (we are still beneath it and tagging from beneath). DJI and DJT both moved below the Feb low, and DJT actually had a close below it. While we appear to be to be on our way to reversing the series of lower highs, we are not out of the woods quite yet. Some traders thing we could also be looking at a massive bear flag. I remain mostly market neutral and prepared to ring the register whatever direction Mr. Market chooses to run. I have to say that your prior long entries have been spot on so let’s hope you are right once again! 🙂
Another fascinating thing about the price action of the past few months is that when you back away at look at a daily chart of the indices, with the exception of NDX and RUT, prices have gone absolutely nowhere for months on end. What we have in SPX and DJT is essentially a massive sideways coil!
I find it most interesting that SPX and DJT remain so far below their ATH when compared to NDX and RUT. I thought the same thing about DJT a few years ago and it surprised everyone gong on to new ATH so that certainly could again be in the works.
and small caps at new ATH’s
at the latter stages of a bull market they do have a tendency to lead, or rather, the large caps have a tendency to lag
this is all playing out textbook perfect – mostly – so far
I’ve got a SPY Dec call ratio back spread to take advantage of this set up Rodney. Let’er rip!! How about price just stays on top of that yellow line for two months or so? That’d float my boat!!
Always a good idea to keep an eye on the forest, so we don’t miss it for all the little trees
Haha! Here come our erstwhile friends, driving VIX below 13.00, AGAIN!
Maybe they will hit my stink bid one more time…!
We should get some resolution of the uncertainty today. The downside gap should provide strong support for the bullish case in which case I will be holding my long calls.
If we close the gap and it STAYS closed I will be adding to short positions.
Taking the money and running on the 30% pop on 12 strike VIX calls picked up this morning. Opened another “stink bid” to re-buy if the banksters come a’calling once again! 🙂
BTW, they still sometimes ambush traders holding options through expiration Wednesday with a ridiculous spike down in the am. MFM! Take it! 😀
I took some money and ran close to the top this morn myself. A few things didn’t look and feel right about that pop. Sho’nuf!! Now, where’s the new bottom, I’m looking for the bottom, has any seen the bottom???? Is 2742 now strong support?
Potential double bottom in ES at 2739. We really need to see strong movement up from this point with prices clearing 2750 on the upside and a close above…
agreed, as 2737.84 is the 61.8% retrace of the Jan-Feb high to low! It’s now the the critical pivot and support level here.
The paths and concluding lengths of 4 recent price run ups, the last two higher pivots, and the 78% fibo of the entire 11% A wave down. I expect 2800 pretty quickly within the “cone” and then a consolidation under. Note however the approaching orange bollinger from above, which is going to squeeze and could put a damper on the bull party.
The hourly shows that there’s lots of room to the downside while staying inside even the steepest of these speed lines. There’s something not overly impressive about today’s action and failure to ever post new highs after the initial thrust. Arc of a diver and all that.
I’m thinking that intermediate wave (5) may see a return to rising price on light volume with declining ATR.
Like most of intermediate wave (3). And remember how much distrust of the bull trend that induced.
I’d expect this fifth wave to exhibit some weakness.
But I do have a lot of confidence in a new ATH from price within the next very few weeks. Because breadth is so very bullish.
Re-entering VIX, and shorting IWM, QQQ (Not trading advice)
Welcome aboard! Free money! 🙂
Indeed!!