
A small inside day fits the Elliott wave count.
At the end of the week, VIX and the AD line and On Balance Volume are all giving signals which are in agreement.
Summary: Bearish signals at the end of the week from VIX and the AD line and On Balance Volume all favour the idea that a pullback is not over. Some more sideways and lower movement is expected next week. In the first instance, look for support about 2,701.
If price makes a high above 2,742.24 with signs of strength, then the pullback should be over; expect an increase in upwards momentum as a third wave unfolds.
Pullbacks are an opportunity to join the trend.
The long to mid term Elliott wave target is at 2,922, and a classic analysis target is now at 3,045.
Always practice good risk management. Always trade with stops and invest only 1-5% of equity on any one trade.
New updates to this analysis are in bold.
The biggest picture, Grand Super Cycle analysis, is here.
Last historic analysis with monthly charts is here, video is here.
ELLIOTT WAVE COUNT
WEEKLY CHART
Click chart to enlarge.
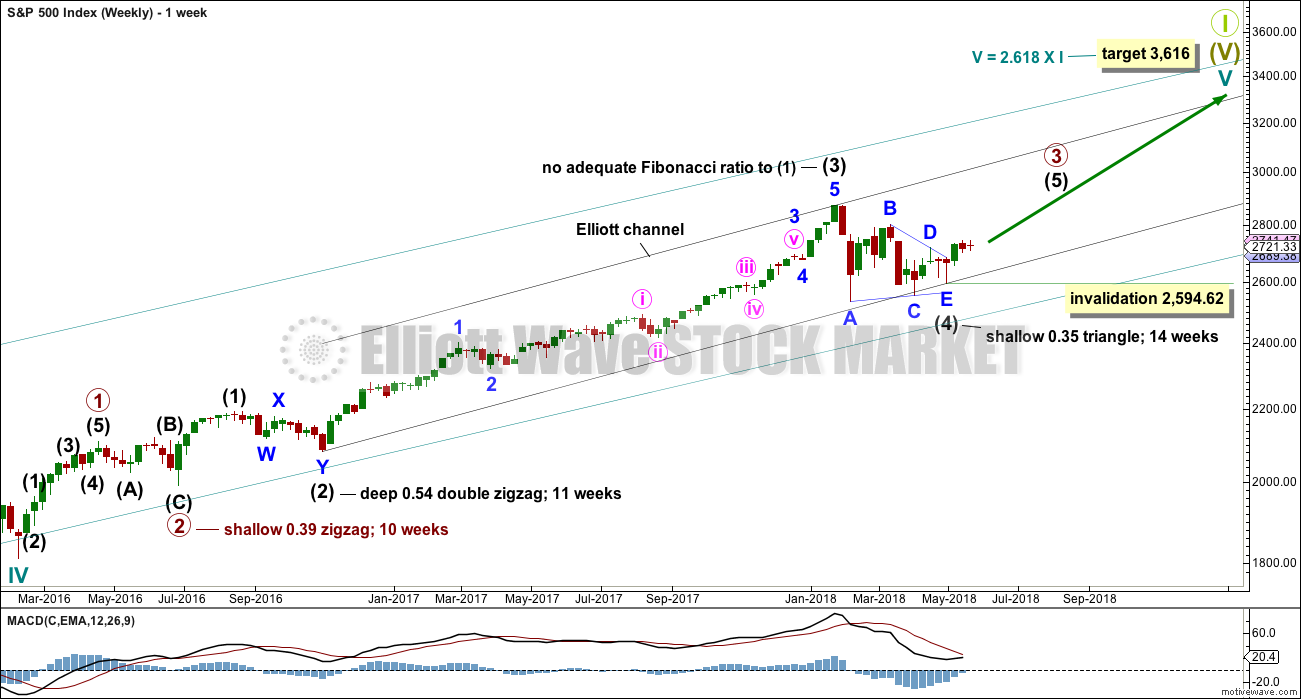
Cycle wave V must complete as a five structure, which should look clear at the weekly chart level. It may only be an impulse or ending diagonal. At this stage, it is clear it is an impulse.
Within cycle wave V, the third waves at all degrees may only subdivide as impulses.
Intermediate wave (4) has breached an Elliott channel drawn using Elliott’s first technique. The channel is redrawn using Elliott’s second technique: the first trend line from the ends of intermediate waves (2) to (4), then a parallel copy on the end of intermediate wave (3). Intermediate wave (5) may end either midway within the channel, or about the upper edge.
Intermediate wave (4) may now be a complete regular contracting triangle lasting fourteen weeks, one longer than a Fibonacci thirteen. There is perfect alternation and excellent proportion between intermediate waves (2) and (4).
If intermediate wave (4) were to continue further as either a flat or combination, both possibilities would require another deep pullback to end at or below 2,532.69. With both On Balance Volume and the AD line making new all time highs, that possibility looks extremely unlikely.
If intermediate wave (4) were to continue further, it would now be grossly disproportionate to intermediate wave (2). Both classic technical analysis and Elliott wave analysis now suggest these alternate ideas should be discarded based upon a very low probability.
Within intermediate wave (5), no second wave correction may move beyond the start of its first wave below 2,594.62.
DAILY CHART
Click chart to enlarge.
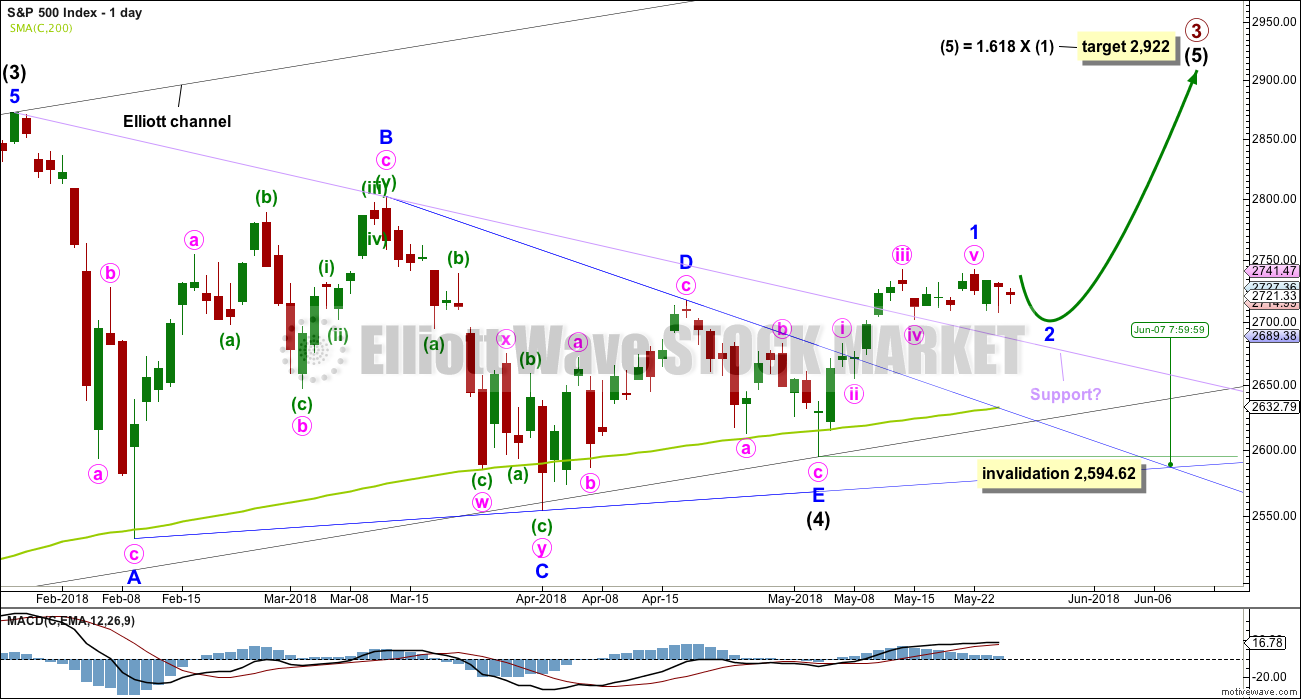
It is possible that intermediate wave (4) is a complete regular contracting triangle, the most common type of triangle. Minor wave E may have found support just below the 200 day moving average and ending reasonably short of the A-C trend line. This is the most common look for E waves of triangles.
Intermediate wave (3) exhibits no Fibonacci ratio to intermediate wave (1). It is more likely then that intermediate wave (5) may exhibit a Fibonacci ratio to either of intermediate waves (1) or (3). The most common Fibonacci ratio would be equality in length with intermediate wave (1), but in this instance that would expect a truncation. The next common Fibonacci ratio is used to calculate a target for intermediate wave (5) to end.
Price has clearly broken out above the upper triangle B-D trend line. This indicates that it should now be over if the triangle is correctly labelled.
A trend line in lilac is added to this chart. It is the same line as the upper edge of the symmetrical triangle on the daily technical analysis chart. Upwards movement has sliced cleanly through this line, finding no resistance before breaking it. This line may offer some support for any pullbacks. Price is finding support at that line so far. A breach of that line does not mean the classic triangle is invalid and that price must make new lows, only that the pullback is deeper. Look for next support at the blue Elliott wave triangle B-D trend line.
Sometimes the point at which the triangle trend lines cross over sees a trend change. A trend change at that point may be a minor one or a major one. That point is now about the 7th of June.
HOURLY CHART
Click chart to enlarge.
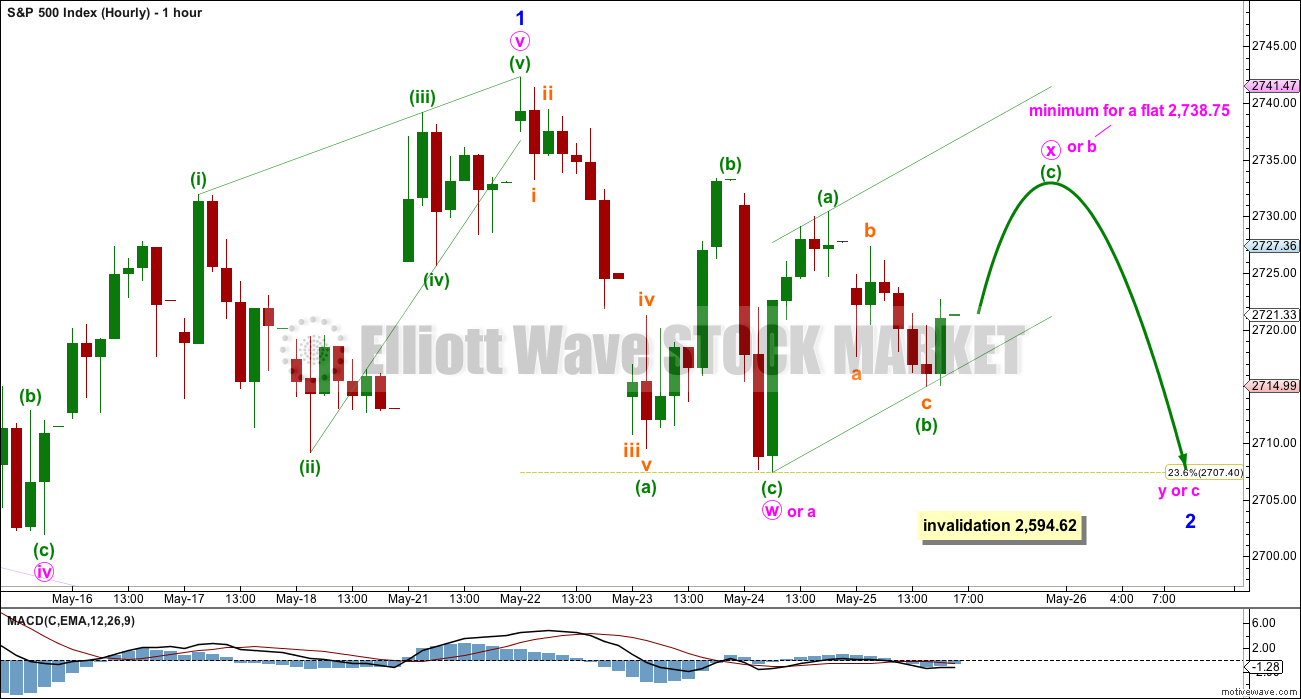
Minor wave 1 may have been over. Now minor wave 2 may be continuing.
Minor wave 2 may still be about halfway through, and it may be either a combination or a flat correction. At this stage, bearish signals from VIX and the AD line and On Balance Volume suggest downwards movement as imminent, so a combination is favoured.
If minor wave 2 is a combination, then the first structure in a double may be a complete zigzag labelled minute wave w. The double may now be joined by an incomplete three in the opposite direction, an incomplete zigzag labelled minute wave x. There is no minimum requirement for X waves within combinations, nor is there a maximum limit. When minute wave x is complete, then the second structure in a double may unfold labelled minute wave y. Minute wave y may be either a flat or triangle that may end close to the same level as minute wave w at 2,707.38, so that the whole structure moves sideways and takes up time.
If minor wave 2 is a flat correction, then within it minute wave b must retrace a minimum 0.9 length of minute wave a at 2,738.75 or above. Minute wave b may make a new high above the start of minute wave a. At the end of this week, bearish signals for the short term from VIX and the AD line and On Balance Volume expect that upwards movement here may be too limited for a flat correction to unfold. This now looks less likely.
Minor wave 2 may not move beyond the start of minor wave 1 below 2,594.62.
ALTERNATE HOURLY CHART
Click chart to enlarge.
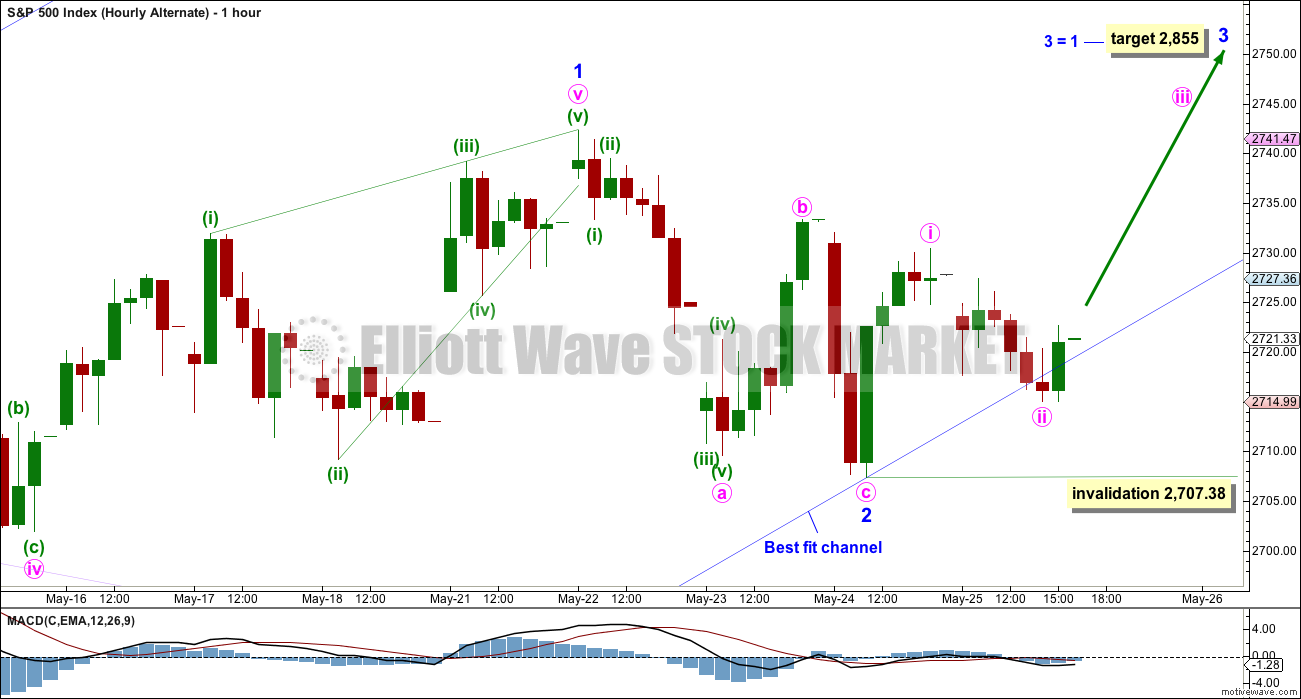
This alternate wave count is identical to the main hourly wave count with the exception of the degree of labelling within minor wave 2.
It is possible that minor wave 2 is over as a very brief and shallow zigzag. Minor wave 3 may have begun. The target for minor wave 3 to end is equality in length with minor wave 1, because minor wave 2 was shallow.
This wave count at this stage must be judged as less likely than the main wave count because of the brevity of minor wave 2.
If price makes a new high above 2,742.24 with support from volume and a bullish signal from one of the AD line or On Balance Volume, then this wave count would increase in probability.
TECHNICAL ANALYSIS
WEEKLY CHART
Click chart to enlarge. Chart courtesy of StockCharts.com.
From Dhalquist and Kirkpatrick on trading triangles:
“The ideal situation for trading triangles is a definite breakout, a high trading range within the triangle, an upward-sloping volume trend during the formation of the triangle, and especially a gap on the breakout.”
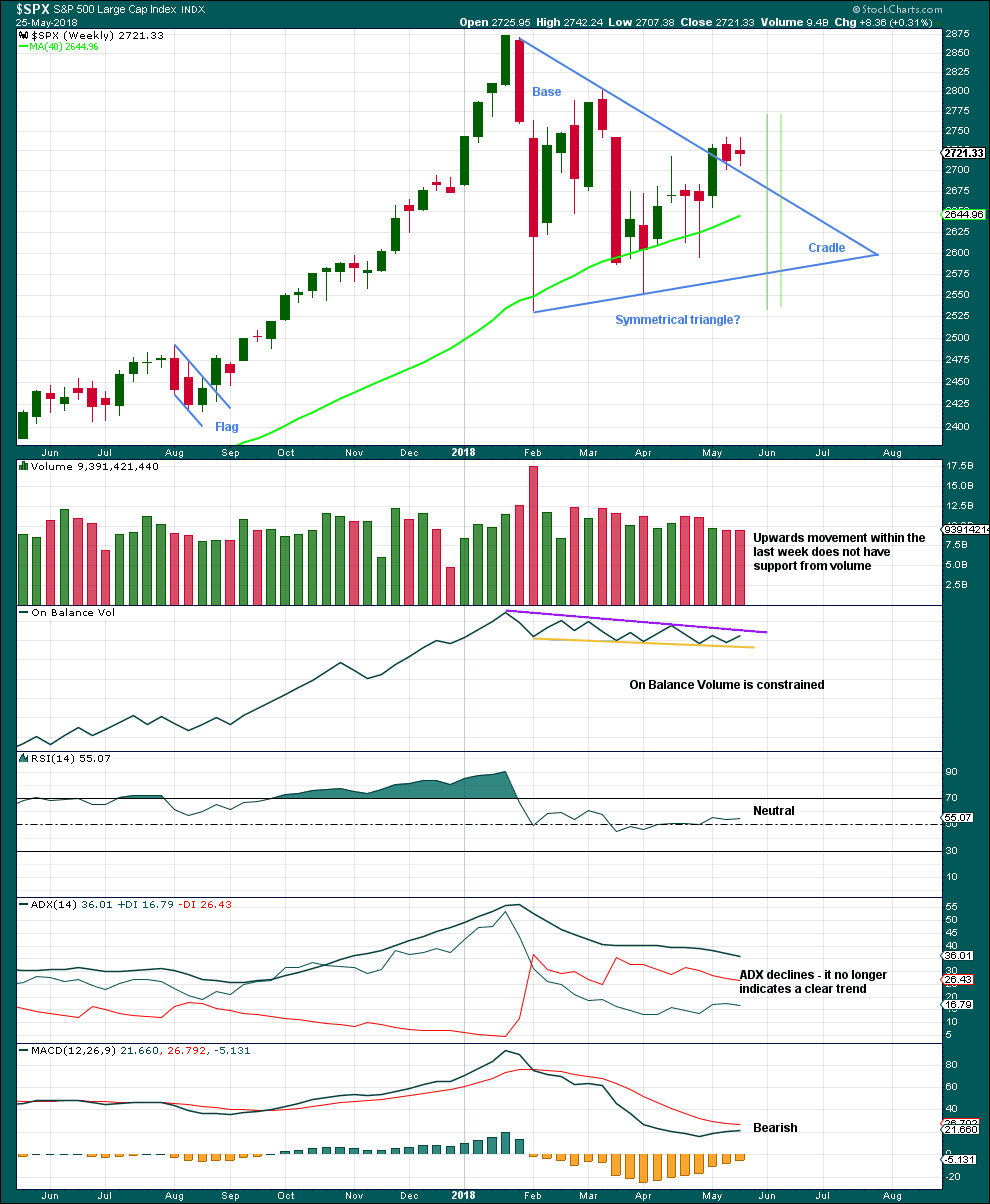
For this example, the breakout may have now happened. There was a high trading range within the triangle, but volume declined. A downwards week may be a typical pullback following the breakout. If the pullback is not over, then expect support still about the upper edge of the symmetrical triangle top trend line.
DAILY CHART
Click chart to enlarge. Chart courtesy of StockCharts.com.
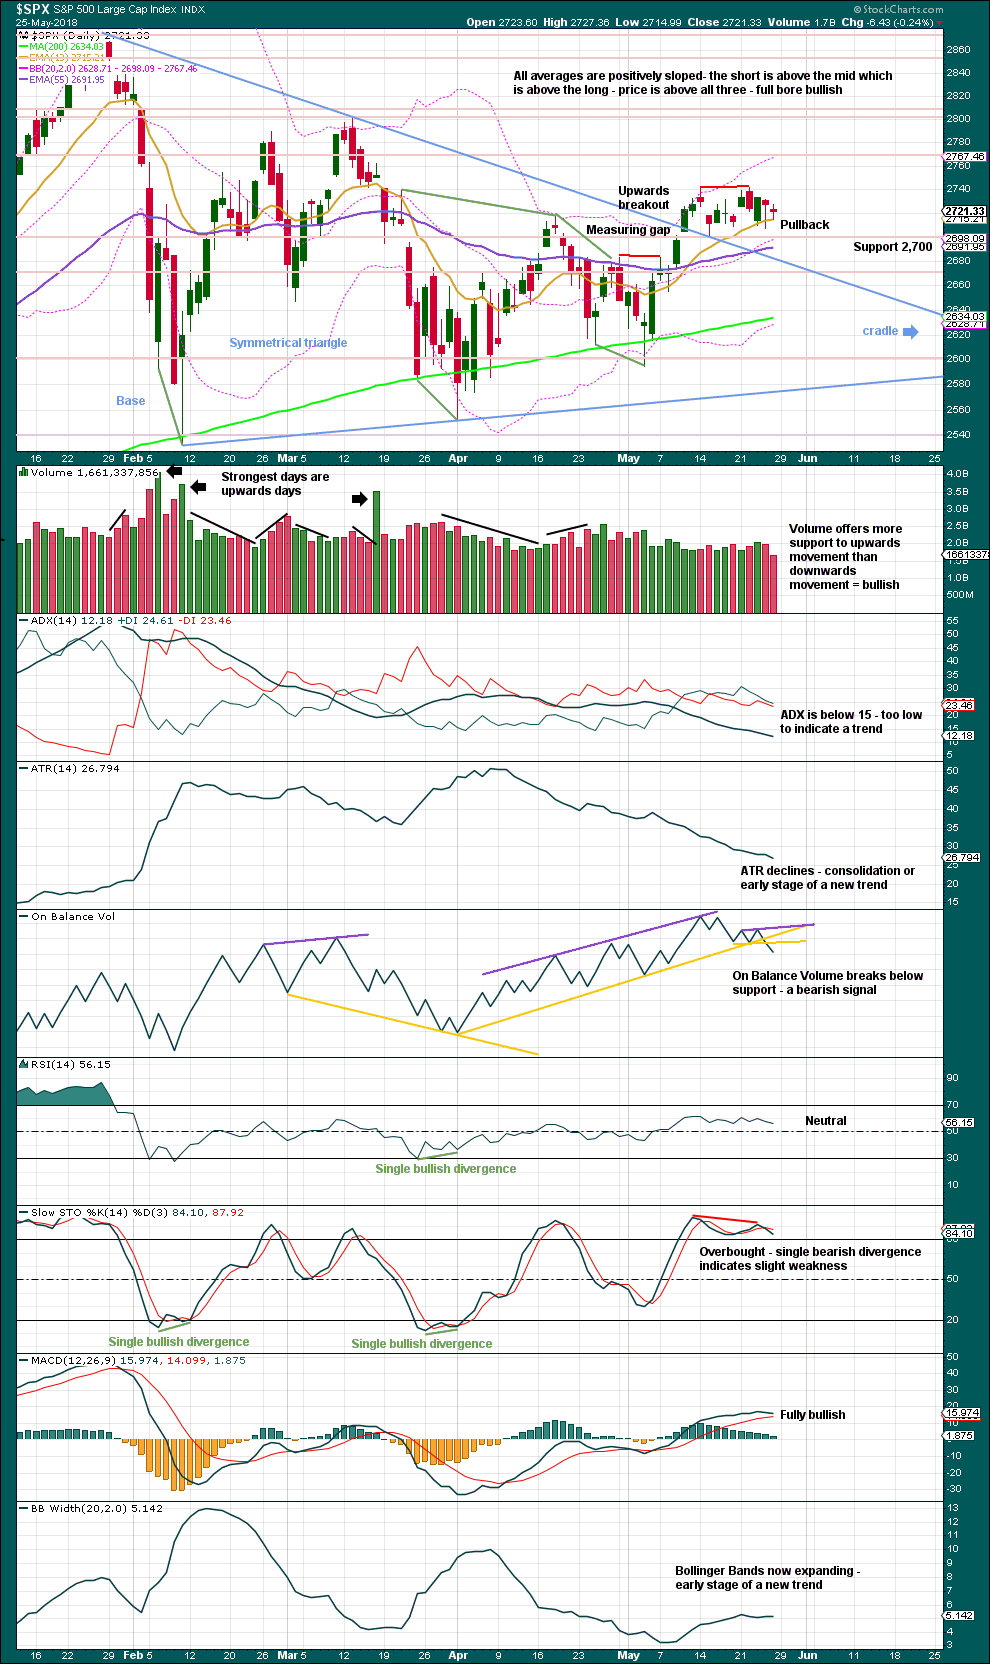
The symmetrical triangle may now be complete, and price has completed an upwards breakout. There may be some small cause for concern that the upwards breakout does not have support from volume. However, in current market conditions only some small concern is had here. Rising price on light and declining volume has been a feature of this market for years, yet price continues to rise.
After an upwards breakout, pullbacks occur 59% of the time. A pullback may find support at the upper triangle trend line and may be used as an opportunity to join a trend.
Symmetrical triangles suffer from many false breakouts. If price returns back into the triangle, then the breakout will be considered false and the triangle trend line will be redrawn.
The base distance is 340.18. Added to the breakout point of 2,704.54 this gives a target at 3,044.72. This is above the Elliott wave target at 2,922, so the Elliott wave target may be inadequate.
For the short term, the next smaller consolidation or pullback may come about 2,811. This shorter term target is calculated using the measuring gap. This gap at 2,701.27 so far this week continues to provide support; expect it may continue to do so next week until proven otherwise.
The short term volume profile remains bullish, but the bearish signal from On Balance Volume should be given more weight. Expect at least some more downwards movement here.
VOLATILITY – INVERTED VIX CHART
Click chart to enlarge. Chart courtesy of StockCharts.com. So that colour blind members are included, bearish signals
will be noted with blue and bullish signals with yellow.
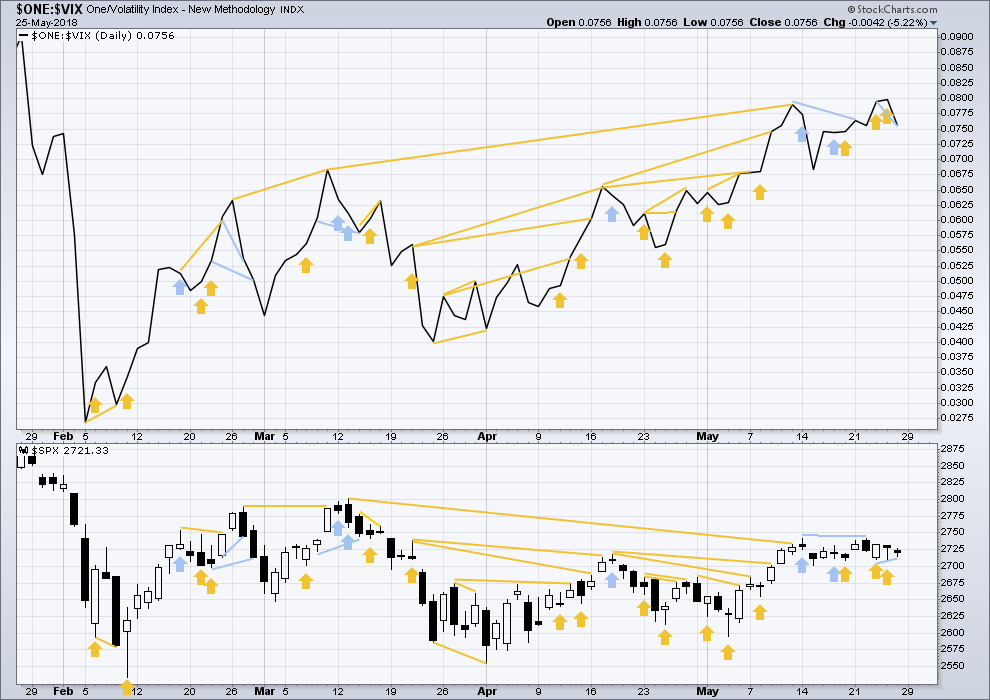
Normally, volatility should decline as price moves higher and increase as price moves lower. This means that normally inverted VIX should move in the same direction as price.
Bullish divergence noted in last analysis has been followed by a small inside day.
Now there is new bearish divergence: inverted VIX has made a new low below the low three sessions prior, but price has not. This may be now followed by one or two downwards days to resolve it.
BREADTH – AD LINE
Click chart to enlarge. Chart courtesy of StockCharts.com.
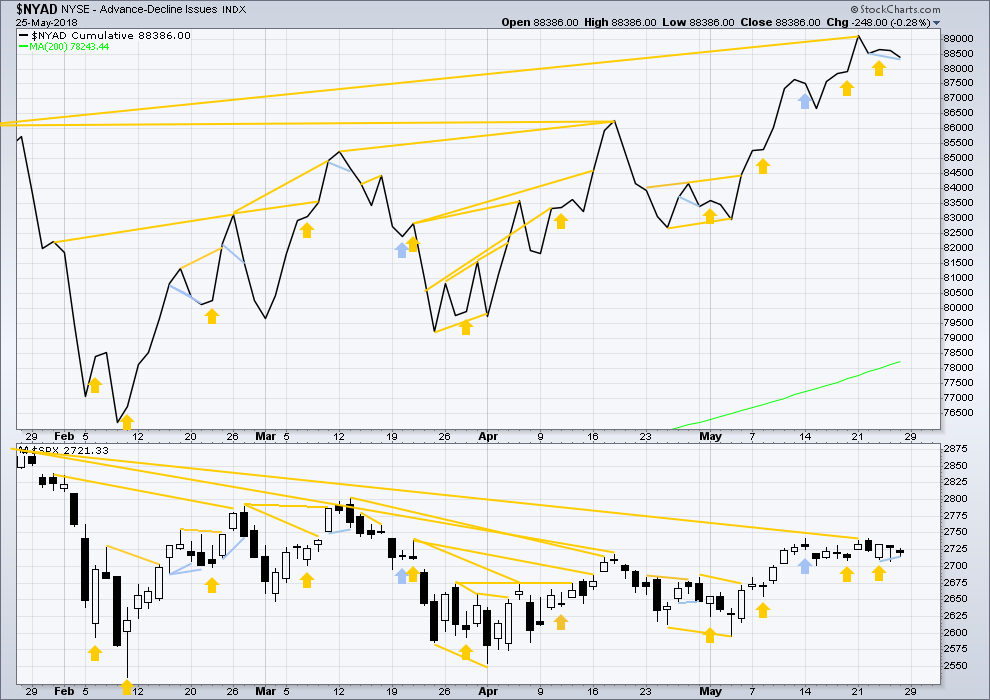
There is normally 4-6 months divergence between price and market breadth prior to a full fledged bear market. This has been so for all major bear markets within the last 90 odd years. With no longer term divergence yet at this point, any decline in price should be expected to be a pullback within an ongoing bull market and not necessarily the start of a bear market. New all time highs from the AD line means that any bear market may now be an absolute minimum of 4 months away. It may of course be a lot longer than that. My next expectation for the end of this bull market may now be October 2019.
Small caps continue to make new all time highs, but mid and large caps have yet to do so. This divergence may be interpreted as bullish. Small caps may now be leading the market.
Breadth should be read as a leading indicator.
There has been a cluster of bullish signals from the AD line in the last few weeks. This also overall offers good support to the main Elliott wave count.
The new strong all time high is extremely bullish and supports the Elliott wave count, which expects price to follow through.
The AD line has made a new small swing low below the low three to four sessions prior, but price has not. This divergence is bearish. Price may follow with a new low.
DOW THEORY
The following lows need to be exceeded for Dow Theory to confirm the end of the bull market and a change to a bear market:
DJIA: 23,360.29.
DJT: 9,806.79.
S&P500: 2,532.69.
Nasdaq: 6,630.67.
At this stage, only DJIA has made a new major swing low. DJT also needs to make a new major swing low for Dow Theory to indicate a switch from a bull market to a bear market. For an extended Dow Theory, which includes the S&P500 and Nasdaq, these two markets also need to make new major swing lows.
Charts showing each prior major swing low used for Dow Theory may be seen at the end of this analysis here.
Published @ 06:00 p.m. EST on 26th May, 2018.
Minor 2 looks like a zigzag.
The last gap is closed, so it’s not a measuring gap, it’s a pattern gap I think.
On an arithmetic scale price is right now right at the lilac trend line, that may provide support. If it does not, then the next target is the 0.618 Fibonacci ratio at 2,651.
This channel may be helpful in telling when minor 2 is over. If minor 2 continues lower I’ll adjusted the channel to contain all of minor 2.
Wow, bond bears getting absolutely obliterated out there. Bulls are within reach of late January levels.
Bulls need to make a run here at EOD or else VIX looking like a mighty strong daily candle. A close above the 50 could be bad news in the short term.
Yes Sir! VIX saying more pain ahead for those frisky bulls….! 🙂
Until some sustained weakness shows up the hard data or banking sectors, you just know U.S. corporations are going to use every dip here to continue buying back shares. Like taking candy from a baby.
OBV presaged this move down and has been a leading indicator through most of this bull market. It has made an ATH much more recently than price… as has breadth.
Exactly.
And in any market, bull or bear, price does not move in a straight line. There are pullbacks in a bull market, that looks like what this is.
Daily MACD on SPX now has a bearish crossover.
DJI 50 day not providing support. ES e-mini short cohort sitting tight.
Looks like a bit more pain for the bulls….
I had a couple hundred short SPY 272 calls probably expiring worthless tomorrow
but went ahead and forked over the moolah to exit them. You know what they say:
Bulls make money, bears make money, but PIGS….well, you know the drill…! 🙂
The battle at 2685 continues. I suspect it will break momentarily. The next stop looks to be 2650 to me. Which would break the current Intermediate 4 triangle upper trend line.
Perhaps the triangle is incomplete. See chart below.
That’s what I was thinking… a zig then a zag… 🙂
D would be very similar to B with C down hard. If so, perhaps E will be down hard and relatively quick as was C.
I was thinking the same thing over the last few days but now that I look at it again today the problem is the 200 day SMA. It’s at 2635. S&P is at 2690 so it’s a drop of 55 points just to GET to the 200 day MA. The 200 SMA has provided strong support since February and although it has been pierced intraday I believe there has only been ONE session where it closed below the 200 day (April 2nd). Plus I believe it has to go below the end of the E wave which is at 2594 which is another 40 point drop. So that’s an almost 100 point drop by the S&P 500 from here if the triangle and intermediate (4) were still going on which is quite a bit. I think that’s why Lara assigns it a low probability. Not impossible, but unlikely.
Of course if you look at the weekly chart and use different trend lines it looks like it could happen easily.
And if you use the RUT, which now seems to be leading the markets, at least as long as there is the possibility of trade problems with China, you see a much more definitive triangle breakout to new all time highs.
Perhaps we see RUT tag top of its own triangle boundary while other indices complete an E wave to the lower boundary? 🙂
Many chartists favor keeping the B/D trend-line tight but it was just not do-able with the distance up that last wave traveled. The wave did appear corrective to me so I has some doubts about whether the triangle was indeed finished. In my experience, E wave completions out of triangles move like a bat out of you-know-where! 🙂
Rodney you changed the upper triangle line. The original TA triangle line was/is lower, and got tapped from above today, a perfect retest!! I thought that was exactly the setup you wanted (and I’ll like it too!). My chart below of “pictures of my projection of a wave 2 low” shows that line. Price missed it by only a point or two at the low today (so far).
As I see it it is getting close to buying the bottom of the 2 time. Perhaps very close indeed.
Yes I did change that line. Just as I noted in my comment this would be if the triangle has not completed. That is why I colored it aqua. Kind of just thinking out loud.
The $NYAD – McClellan Indicator is at a precarious position. The last high in SPX was not accompanied by a new high in the McClellan. In fact, it has been a series of 3 lower highs since mid- March at the top of Minor B.
I can go either way at this point. I am undecided. thus no new positions. I have enough skin in the game as of the triangle breakout. I am trying to develop the disposition and skill of ‘patience’.
The problem then is the subdivisions, particularly of C.
For C to be a single zigzag, there’s a truncation.
Then D can be a double zigzag.
Otherwise… C can be a double ZZ as I have it labelled on the daily chart, but then D has to be a single ZZ.
It could all work, but it wouldn’t look very good.
Bids on long calls starting to perk up. Apparently market makers think we’re done…
I am going to go take a look at the ES shorts, recently at a record 500K contracts, to see if they have taken profits…
Verne, how do u determine that? Open interest? Thx
Much more simple, lol!
I just look at my position to see what they are bid. 🙂
Yep…! I guess
If DJI does not hold its 50 day, I suspect they will all revisit the 200 day. Some indices have yet to do so this time we could see a synchronous tag.
ES putting in a clear shadow. VIX in process of printing a wick. If both wick and tail hold, we may indeed have a bottom.
VIX shooting star on the hourly… I ain’t saying, I’m just saying…
Not technically. Real body too big.
Does not have to be a ST to signal a possible reversal, just a long wick.
The minor 2 could be over right here. Fairly clean hit and turn on the 38% fibo zone.
Or this isn’t over and price will go do 265 area before completing the 2.
multiple 1 min and now a 5 min buy trigger….
Exiting remaining short SPY calls.
Sold DIA 248 strike puts.
Waiting for VIX to tell the tale of the tape.
So far only DJI testing 50 day.
Remember it along with DJT made a new low below the Feb low. Only DJT closed lower.
DJI could be leading the other indices.
It’s been a wonderful Tuesday hasn’t it, lol!!
Slurp! 🙂
Hi Chris. The banksters tried to intimidate the 500+ e mini short contract holders with a futures gap yesterday and had their scalps promptly handed to them…I thought to myself …”Uh Oh!!!” 😀
Tagging out of 90% of VIX position and completely exiting put spread on UVXY; beers on me again Verne…..
Make mine Guinness!
As we say in the islands: “It’s good. And good for you!” 🙂
BTW, it looks to me like a few traders are jumping the gun on a reversal and they are not paying attention to what VIX is doing…I would be berry berry careful if I were they…! 🙂
It’s a very good long set up in development, yup. Tricky and requires patience, as this could be it…but 2’s more often go to 62% levels, which will be 2650ish. Better to be patient and see I think.
I notice the little pullback up today came exactly to the broken channel line and turned. Cute. A break up through that channel line today will give a strong signal the 2 is probably over.
10 year yields, the factor which supposedly triggered the downturn in February, now falling back down below where they were when the correction began.
Nice VIX spike. If not sustained this afternoon, going long SPY by close of the session.
I expect the bottom channel line to hold SPX here.
Nope…maybe the 38% fibo zone in the 2680-2690 range holds. If not…next stop down is an overlapped 50% and 162% at 2768 area. Then its down to the 2650 area for the 62% retrace zone. A week ago I targeted the 38% and the 62% as the like bottoms of this 2.
Here are my projections for a wave 2 low from about a week ago….
I’m taking SPX 2700 as a good time to close SPY short positions and starting to look for entry either this afternoon or tomorrow to start long positions.
US Dollar Index peaked early this morning and is out of momentum. Equities should begin a rally (uptrend).
I see uup pushing up fairly strongly today Steve. Don’t see any “peaking” (turning back down) yet.
Yep. No tradeable turn I can see.
2700 in danger of falling to the vandals. 2685 is next support if it goes. Maybe I will finally be able to add to my longs as we complete the correction at hand.
I have returned from ‘cloudy’ California. It was not sunny and warm. But the wedding was great. The bride was of Indian (Asian) descent. Her family was most gracious and we had all sorts of authentic Indian cusine, dress and dance. Dad is a Silicon Valley cohort and founder of his own company. He has just developed new memory for computers and cell phones etc that never looses its data (even when shut off) and it is instantaneous. His new technology is soon to be in every cell phone and computer.
Gaps up in futures are quite rare and we have seen at least two this month. What us even rarer is a gap that gets filled ahead of the start of the cash session as we saw this week-end.
I will be rolling the remaining short half of my call spreads to a lower strike (by two points) at the open as this move down has the potential to be quite deep. The market signaled this move with the lower low last Thursday.
A few weeks ago I suggested the market could continue to tread sideways after the breakout from the triangle… I was subsequently scoffed at and told that triangles *always* give way to a decisive break one way or the other. Looks like the market had other ideas 🙂 I am not trying to say I told you so, but just point out that since February this has been an options sellers’ market, with no conclusive end in sight.
It was actually possible to chart two triangles in play. I personally am of the opinion that “break-out” and “continue to tread sideways” used with reference to triangles is oxymoronic. While you were correct about ongoing sideways price action, so far as the larger triangle is concerned the sideways action in my mind raises some questions about whether a breakout is underway. Just my two cents!
The embedded energy in this market is very high at the weekly and daily timeframes. It’s going to start getting burned within 2 weeks max, and the market is going to start moving, and keep moving. The real push up probably starts after the SPY ex-div on Jun 15; the big money likes to drive price down (and hold it down, ala this 2 going nowhere fast) to accumulate going into the ex-div, then after the payout, they will drive price up for distribution purposes. Not a bad strategy to draft ’em as they execute their nefarious plan!
GOOGL (daily chart) is a strong buy candidate on break of the R1 and R3 pivots. RSI and energy perfectly set up, a clean bounce off and retest of the 50% fibo establishing strong swing support and a close by low risk/reward exit. Just need proof it’s heading in the right direction! It could sell off more before going to 1050. But it’s going to move soon.
TLT daily. Excellent minor 2 pullback, possibly complete (pinged 62%); could go a little higher to 78% (and overlapped 38% of another swing) before turning. When it breaks the up trend line and reverses polarity, I’ll be adding to shorts, and sometime before that cashing my long position.
I never gave much thought to the psychology of trading until I took a few courses with John Carter and started trading with him. John often states that trading is 10% mechanical, and 90% mental. For example, few traders recognize that the second and third most common mistake we traders make (after proper position sizing) are two sides of the same coin and actually driven by the same emotion.
I am talking of course about not using and adhering to stop losses, and not letting winners run. Both errors are driven by fear. In the first instance, fear of accepting a loss, and in the second fear of loosing a gain. What I have found to be most helpful in avoiding these common mistakes is investing a bit of extra time and effort to be as certain as possible about getting the current trend right.
It goes without saying that in the kind of markets we are dealing with means this has not always been easy. Uncertainty about the trend means a neutral or sidelines position is the smart choice. I also try to find a few patterns and strategies that I can trade with high confidence. High confidence, high probability trades means you can use larger lots on each trade and trade less frequently. Many of us waste precious time trying to follow every little market tick and trade every market instrument, instead of picking our battles and trading more favorable set-ups with much higher ROIs for the trades we do make. Just thinking out loud and wishing everyone a most profitable trading week!
Well said, Verne. Very helpful stuff here. Thank you!
😉