
A little downwards movement was expected for Wednesday’s session. A lower low and a lower high fits the definition of downwards movement.
Summary: A new low now below 2,709.18 would confirm the pullback is not over; the target would be 2,686, although this may be a little too low because there is strong support at 2,701.
A new high above 2,742.24 would shift probability towards seeing the pullback already over and a third wave up at three degrees underway, especially if upwards movement to a new high has support from volume. A more bullish outlook for tomorrow has support from divergence between price and the AD line and VIX, and a bullish short term volume profile.
Pullbacks are an opportunity to join the trend.
The long to mid term Elliott wave target is at 2,922, and a classic analysis target is now at 3,045.
Always practice good risk management. Always trade with stops and invest only 1-5% of equity on any one trade.
New updates to this analysis are in bold.
The biggest picture, Grand Super Cycle analysis, is here.
Last historic analysis with monthly charts is here, video is here.
ELLIOTT WAVE COUNT
WEEKLY CHART
Click chart to enlarge.
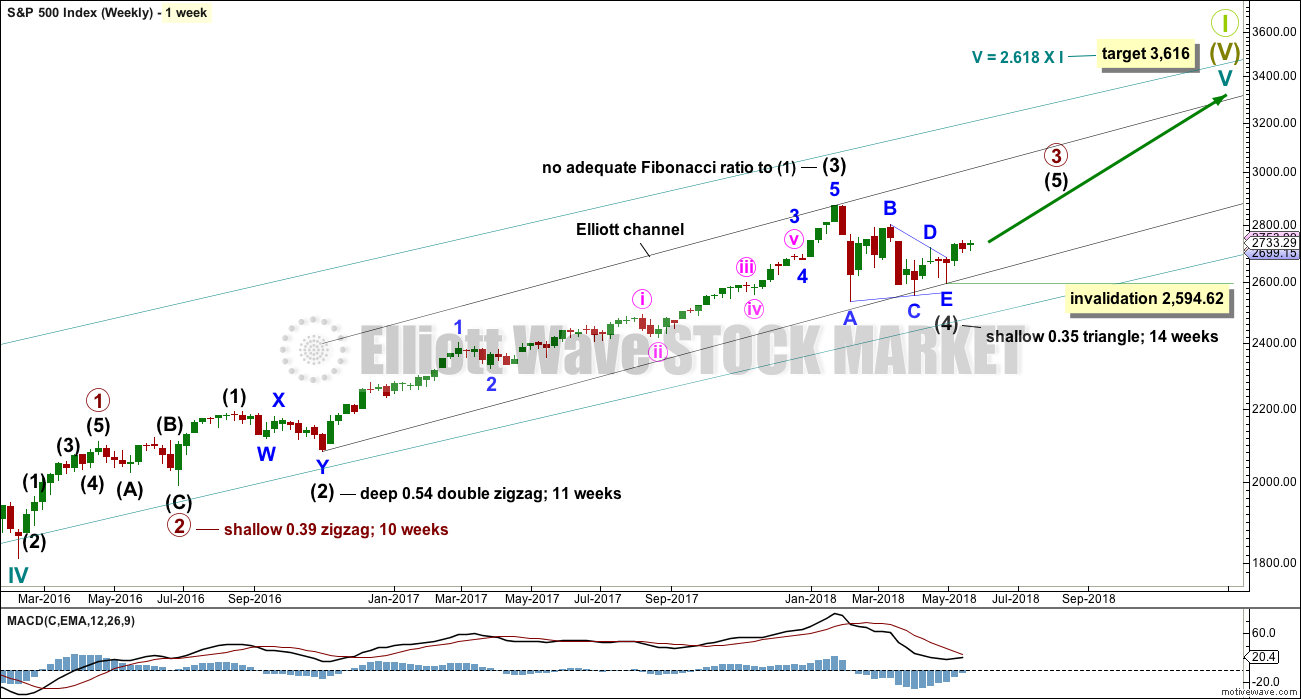
Cycle wave V must complete as a five structure, which should look clear at the weekly chart level. It may only be an impulse or ending diagonal. At this stage, it is clear it is an impulse.
Within cycle wave V, the third waves at all degrees may only subdivide as impulses.
Intermediate wave (4) has breached an Elliott channel drawn using Elliott’s first technique. The channel is redrawn using Elliott’s second technique: the first trend line from the ends of intermediate waves (2) to (4), then a parallel copy on the end of intermediate wave (3). Intermediate wave (5) may end either midway within the channel, or about the upper edge.
Intermediate wave (4) may now be a complete regular contracting triangle lasting fourteen weeks, one longer than a Fibonacci thirteen. There is perfect alternation and excellent proportion between intermediate waves (2) and (4).
If intermediate wave (4) were to continue further as either a flat or combination, both possibilities would require another deep pullback to end at or below 2,532.69. With both On Balance Volume and the AD line making new all time highs, that possibility looks extremely unlikely.
If intermediate wave (4) were to continue further, it would now be grossly disproportionate to intermediate wave (2). Both classic technical analysis and Elliott wave analysis now suggest these alternate ideas should be discarded based upon a very low probability.
Within intermediate wave (5), no second wave correction may move beyond the start of its first wave below 2,594.62.
DAILY CHART
Click chart to enlarge.
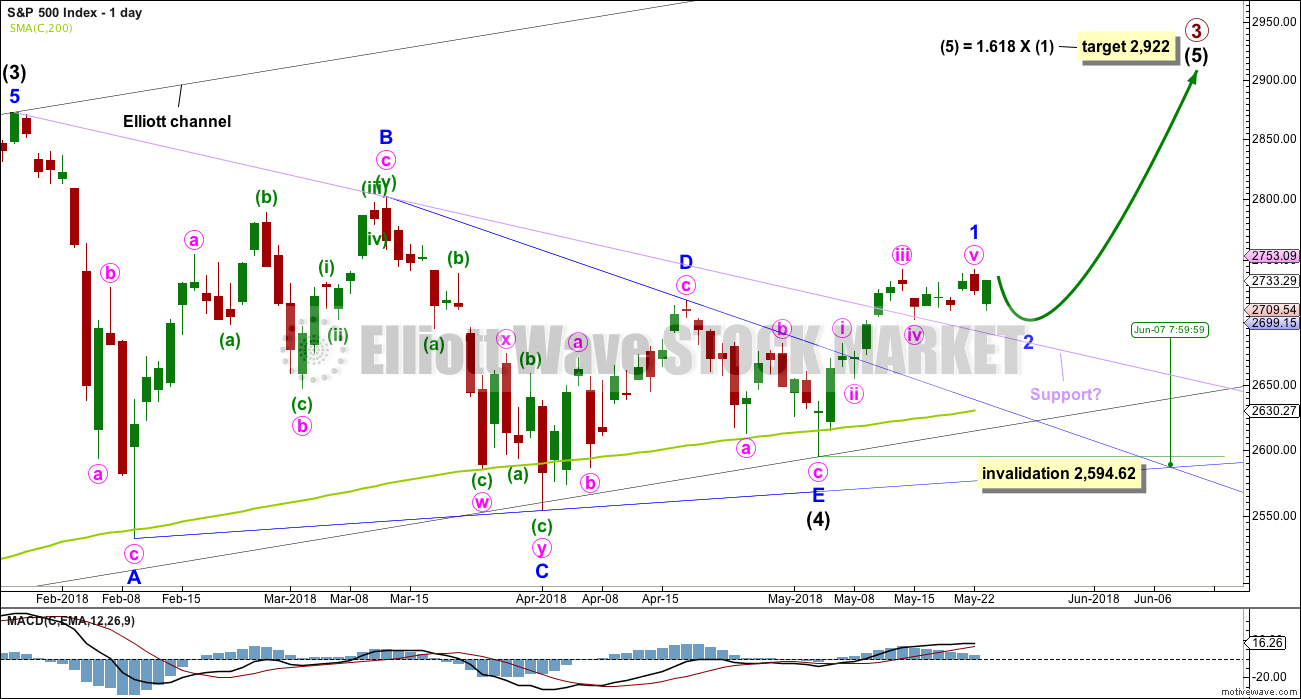
It is possible that intermediate wave (4) is a complete regular contracting triangle, the most common type of triangle. Minor wave E may have found support just below the 200 day moving average and ending reasonably short of the A-C trend line. This is the most common look for E waves of triangles.
Intermediate wave (3) exhibits no Fibonacci ratio to intermediate wave (1). It is more likely then that intermediate wave (5) may exhibit a Fibonacci ratio to either of intermediate waves (1) or (3). The most common Fibonacci ratio would be equality in length with intermediate wave (1), but in this instance that would expect a truncation. The next common Fibonacci ratio is used to calculate a target for intermediate wave (5) to end.
Price has clearly broken out above the upper triangle B-D trend line. This indicates that it should now be over if the triangle is correctly labelled.
A trend line in lilac is added to this chart. It is the same line as the upper edge of the symmetrical triangle on the daily technical analysis chart. Upwards movement has sliced cleanly through this line, finding no resistance before breaking it. This line may offer some support for any pullbacks. Price is finding support at that line so far. A breach of that line does not mean the classic triangle is invalid and that price must make new lows, only that the pullback is deeper. Look for next support at the blue Elliott wave triangle B-D trend line.
Sometimes the point at which the triangle trend lines cross over sees a trend change. A trend change at that point may be a minor one or a major one. That point is now about the 7th of June.
HOURLY CHART
Click chart to enlarge.
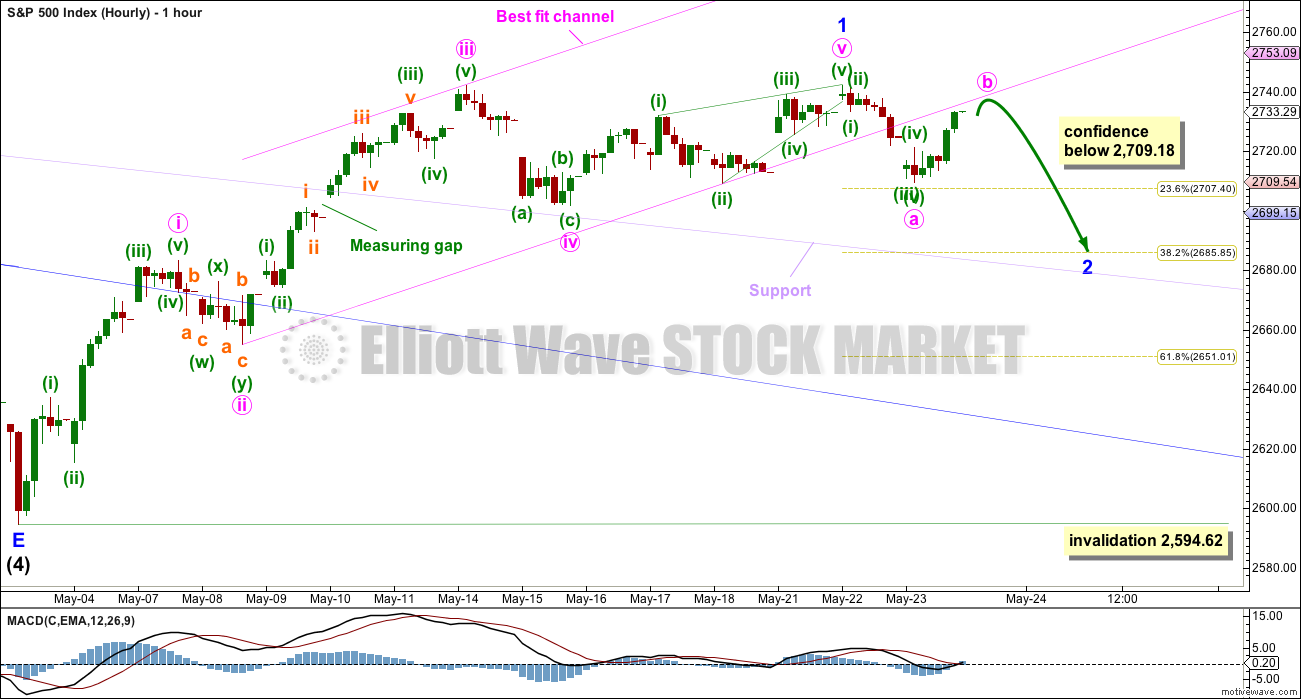
This first hourly chart is the same as yesterday’s hourly wave count. Minor wave 1 may have been over at yesterday’s high, and now minor wave 2 may be continuing.
Minor wave 1 ends with an ending contracting diagonal for minute wave v. This structure meets all Elliott wave rules, but the overshoots of the lower (ii)-(iv) trend line do not look normal.
Minor wave 2 may be unfolding as a zigzag with minute wave a complete as a five wave impulse. If minute wave a is correctly labeled, then minute wave b may not move beyond its start above 2,742.24. It is also possible though to label minute wave a as a zigzag, so minor wave 2 may be a flat correction. Within a flat correction, minute wave b may make a new high above 2,742.24 as in an expanded flat. For this reason there can be no short term upper invalidation point for this wave count.
If minor wave 2 is a flat correction and minute wave b moves above the start of minute wave a, then minute wave b should exhibit weakness. Volume and other indicators would be used then to judge the probability of this wave count.
Minute wave b could be over during this last session, but it looks likely to move at least a little higher. It may be a quick sharp zigzag that is over tomorrow, or it may continue sideways for a few days as one of the sideways corrective structures: a combination, triangle or flat.
Minute wave c may end about the 0.382 Fibonacci ratio of minor wave 1, at about 2,686. However, if the last gap is correctly labeled a measuring gap, then the gap may provide support at 2,701 (the 2,686 target may then be too low).
ALTERNATE HOURLY CHART
Click chart to enlarge.
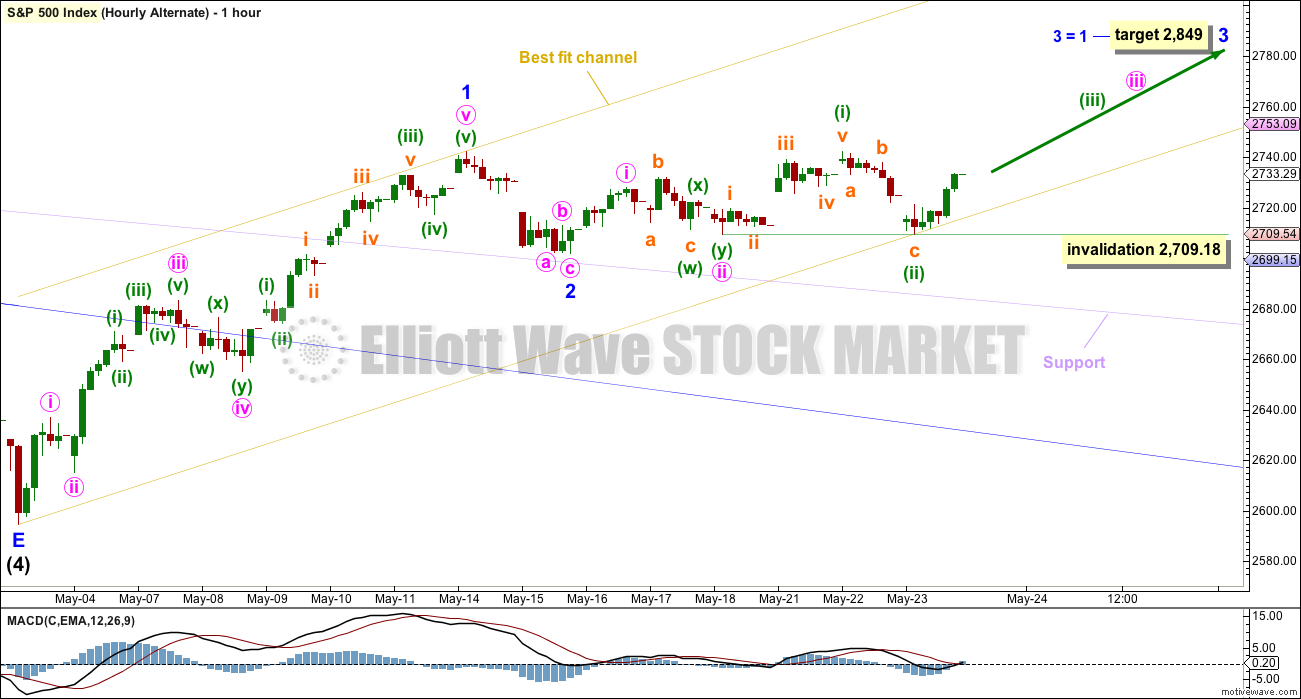
This alternate hourly chart is new.
It is possible that both minor waves 1 and 2 are complete. Here, the subdivisions of minor wave 1 look very good.
Minor wave 3 may have begun. The Fibonacci ratio of equality is used to calculate a target for it to end, because minor wave 2 for this wave count is very shallow and this target fits with the higher target at the daily chart level for primary wave 3 to end.
Within minor wave 3, minute waves i and ii may be complete. Within minute wave iii, minuette waves (i) and (ii) may be complete.
This wave count now sees three overlapping first and second waves complete, and it expects an increase in upwards momentum over the next week or so as a third wave unfolds.
If minuette wave (ii) continues any further, it may not move beyond the start of minuette wave (i) below 2,709.18.
This alternate wave count today has support from bullish signals from both the AD line and VIX.
TECHNICAL ANALYSIS
WEEKLY CHART
Click chart to enlarge. Chart courtesy of StockCharts.com.
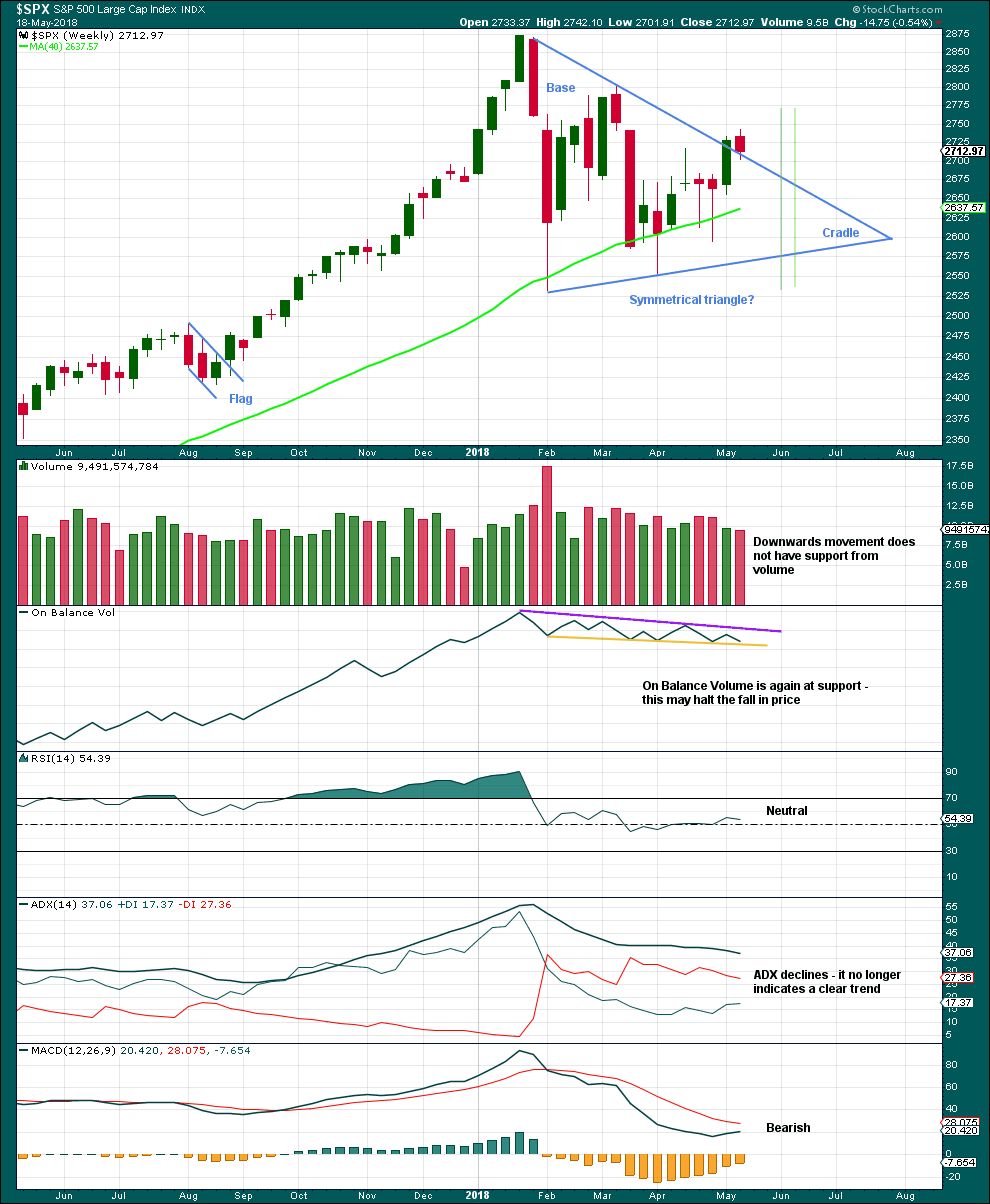
From Dhalquist and Kirkpatrick on trading triangles:
“The ideal situation for trading triangles is a definite breakout, a high trading range within the triangle, an upward-sloping volume trend during the formation of the triangle, and especially a gap on the breakout.”
For this example, the breakout may have now happened. There was a high trading range within the triangle, but volume declined. A downwards week may be a typical pullback following the breakout.
DAILY CHART
Click chart to enlarge. Chart courtesy of StockCharts.com.
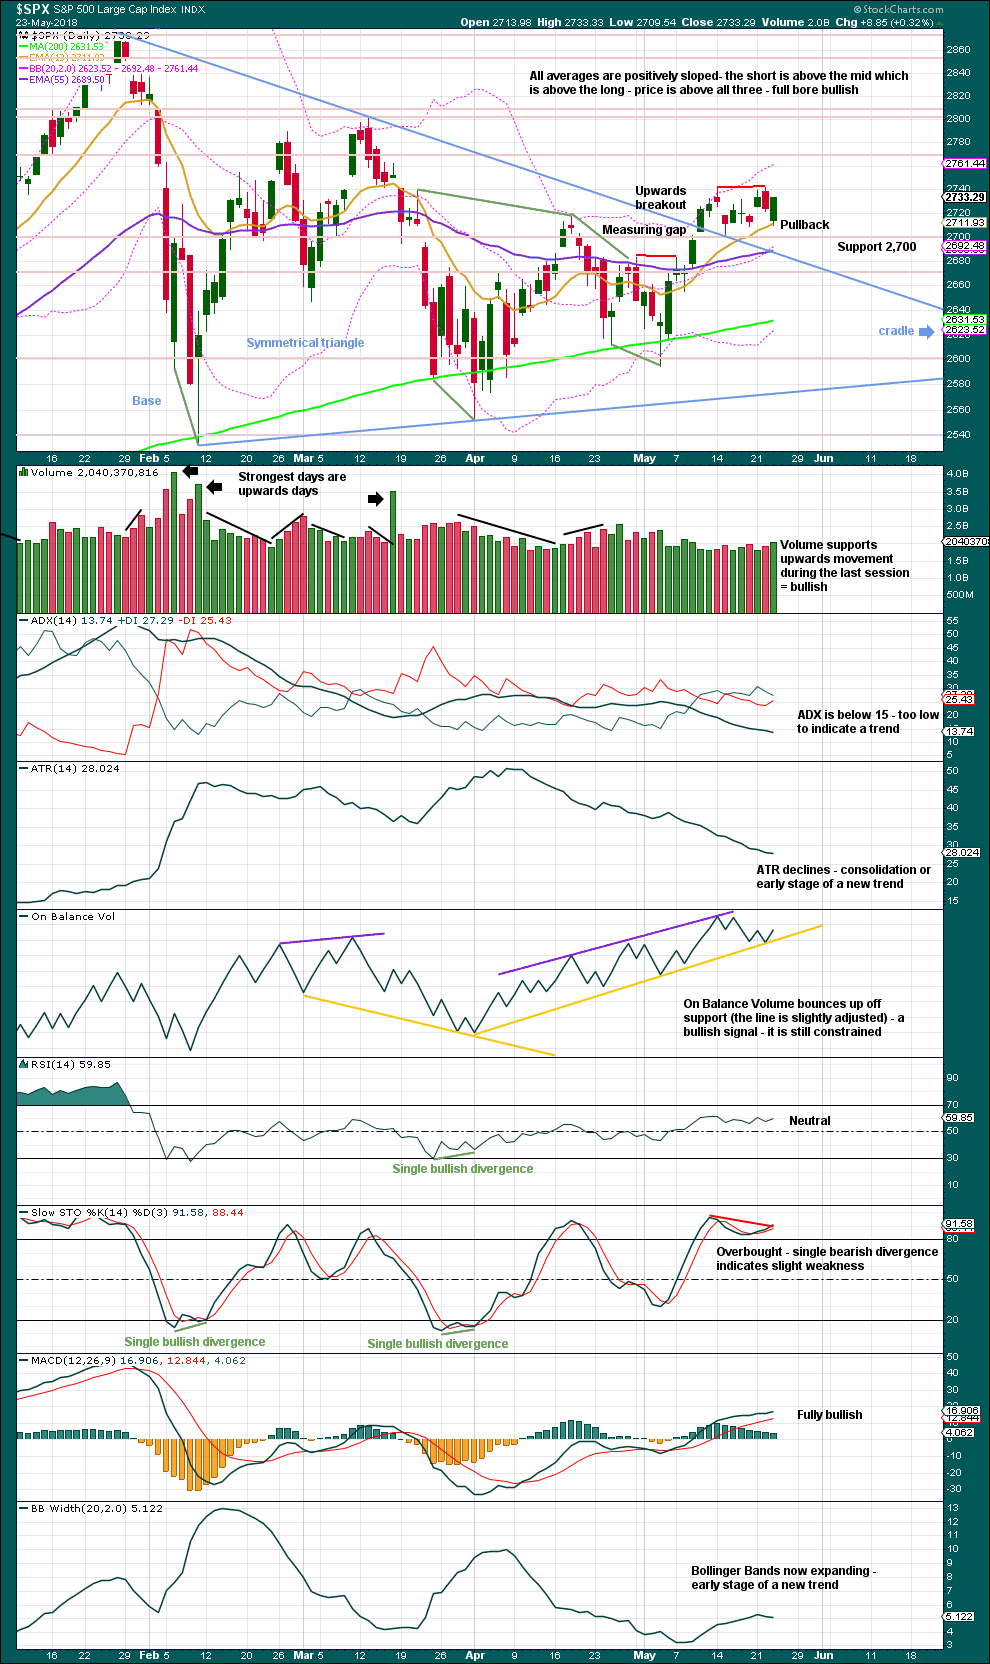
The symmetrical triangle may now be complete, and price has completed an upwards breakout. There may be some small cause for concern that the upwards breakout does not have support from volume. However, in current market conditions only some small concern is had here. Rising price on light and declining volume has been a feature of this market for years, yet price continues to rise.
After an upwards breakout, pullbacks occur 59% of the time. A pullback may find support at the upper triangle trend line and may be used as an opportunity to join a trend.
Symmetrical triangles suffer from many false breakouts. If price returns back into the triangle, then the breakout will be considered false and the triangle trend line will be redrawn.
The base distance is 340.18. Added to the breakout point of 2,704.54 this gives a target at 3,044.72. This is above the Elliott wave target at 2,922, so the Elliott wave target may be inadequate.
For the short term, the next smaller consolidation or pullback may come about 2,811. This shorter term target is calculated using the measuring gap. Look now for the lower end of the gap at 2,701.27 to provide support.
This last session saw downwards movement, but the balance of volume is upwards and the candlestick closed green. Upwards movement during the session has support from volume. With the support line for On Balance Volume now slightly adjusted, it gives a bullish signal. This supports the alternate hourly Elliott wave count.
Stochastics still supports the main hourly Elliott wave count.
VOLATILITY – INVERTED VIX CHART
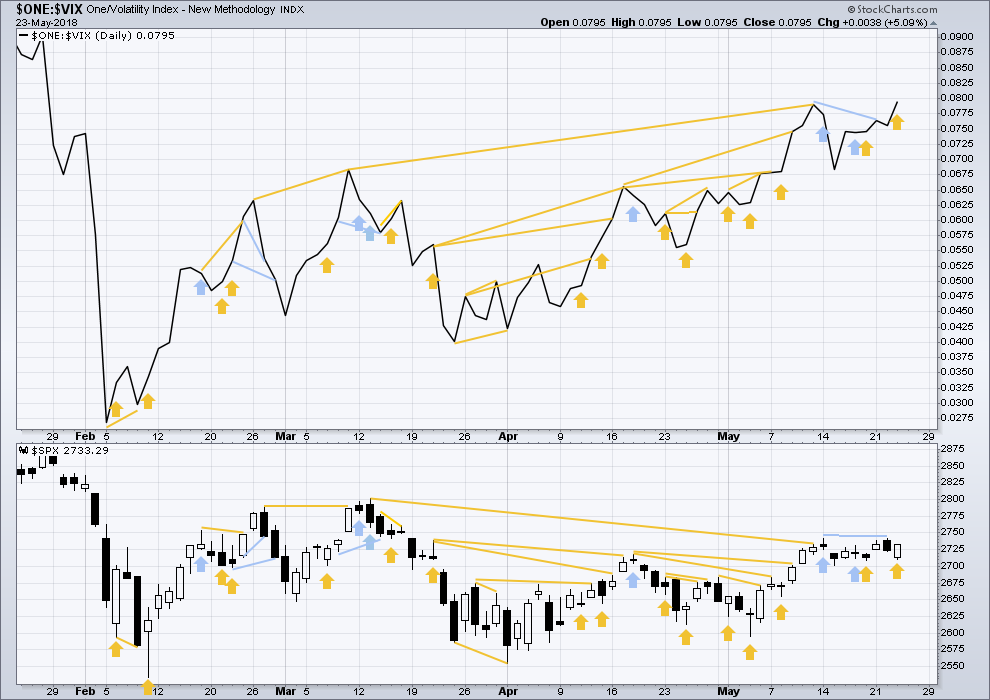
Click chart to enlarge. Chart courtesy of StockCharts.com. So that colour blind members are included, bearish signals
will be noted with blue and bullish signals with yellow.
Normally, volatility should decline as price moves higher and increase as price moves lower. This means that normally inverted VIX should move in the same direction as price.
There is still a cluster of bullish signals on inverted VIX. Overall, this may offer support to the main Elliott wave count.
Inverted VIX is much higher than the prior swing high of the 9th / 13th March, but price is not yet. Reading VIX as a leading indicator, this divergence is bullish.
Price today moved lower, but inverted VIX moved higher. Upwards movement during the session had support from declining market volatility. This divergence is bullish.
BREADTH – AD LINE
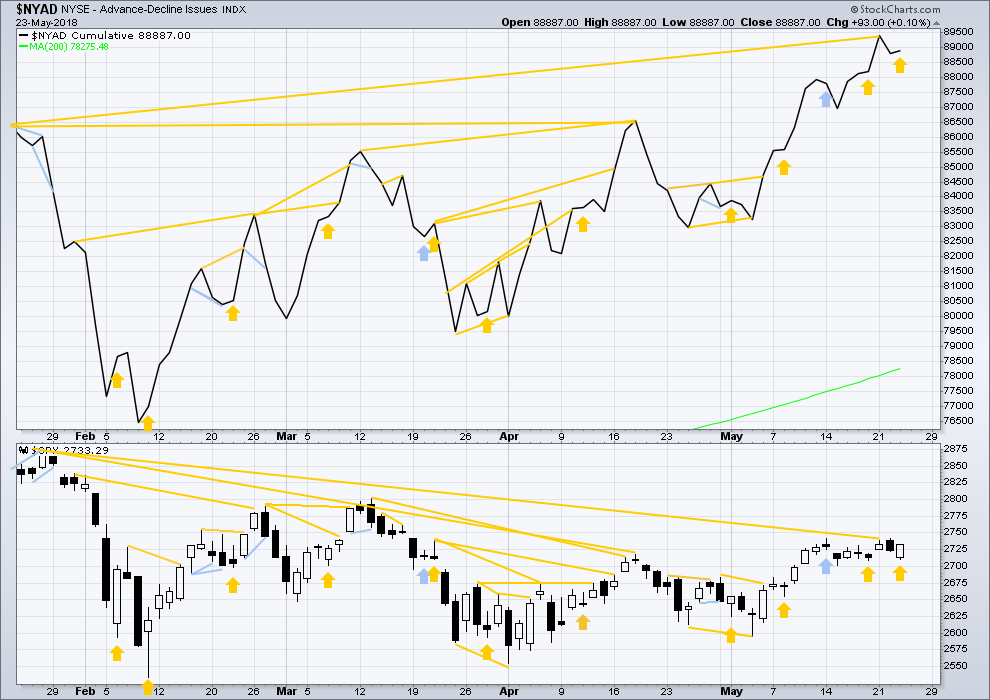
Click chart to enlarge. Chart courtesy of StockCharts.com.
There is normally 4-6 months divergence between price and market breadth prior to a full fledged bear market. This has been so for all major bear markets within the last 90 odd years. With no longer term divergence yet at this point, any decline in price should be expected to be a pullback within an ongoing bull market and not necessarily the start of a bear market. New all time highs from the AD line means that any bear market may now be an absolute minimum of 4 months away. It may of course be a lot longer than that. My next expectation for the end of this bull market may now be October 2019.
Small caps continue to make new all time highs, but mid and large caps have yet to do so. This divergence may be interpreted as bullish. Small caps may now be leading the market.
Breadth should be read as a leading indicator.
There has been a cluster of bullish signals from the AD line in the last few weeks. This also overall offers good support to the main Elliott wave count.
The new strong all time high is extremely bullish and supports the Elliott wave count, which expects price to follow through.
Price today moved lower, but the AD line moved very slightly higher. Upwards movement during the session had support from increasing market breadth. This divergence is bullish.
DOW THEORY
The following lows need to be exceeded for Dow Theory to confirm the end of the bull market and a change to a bear market:
DJIA: 23,360.29.
DJT: 9,806.79.
S&P500: 2,532.69.
Nasdaq: 6,630.67.
At this stage, only DJIA has made a new major swing low. DJT also needs to make a new major swing low for Dow Theory to indicate a switch from a bull market to a bear market. For an extended Dow Theory, which includes the S&P500 and Nasdaq, these two markets also need to make new major swing lows.
Charts showing each prior major swing low used for Dow Theory may be seen at the end of this analysis here.
Published @ 09:10 p.m. EST.
A zigzag is now complete at today’s low. C moved slightly below A, a truncation was avoided.
BUT
While it’s okay that it’s shallow, it’s not okay that it’s that brief for minor 2 to be over there.
I’m going to move it down one degree and label that minute a (or w) or minor 2 as a flat or combination.
If it’s a flat then minute b needs to retrace a minimum 0.9 X minute a at 2,738.75
Both flats and combinations are sideways movements. Except expanded flats. But in this instance I’m now expecting most likely only sideways movement for another few days as it looks like that last gap is providing support.
FANG (energy stock, highly volatile, great trading vehicle) is setting up long on this oil pullback. The ellipse on this daily chart marks what I see as the likely turn zone, for all the usual reasons.
I’m just a little suspicious that the down move today is the complete C wave down of the ABC minor 2 down. I can definitely count a 5 wave structure down off yesterday’s high at the 5 minute level. Could be a lower TF “1” wave down…but I don’t think so. Related, it appears perhaps finance had its blowoff bottom today (XLF).
Yeah Kevin!! Covered to take gains on XLF around 10:30am and exited VIX for another 8% pop. Again, re-loading VIX here.
my view of TLT (20 year bonds). completed a minute i of a minor 5 down, and doing a minute ii push back up. Probable end area: 120, at the 62%. The danger is that in fact it’s not a complete minute i down…but a complete minor 5 down. I have much longer term shorts, and a long now using TMF. Workin’ the churn!!!
Lol! The market makers decided to hang tough on our upping the ante and refused to capitulate yesterday. What a difference a day makes!
Bryan B is truly an amazing trader and I am learning a lot! Nice profits!
The most powerful tool of manipulation in these markets, the synthetic volatility short, just might have been busted this morning…be careful…!
Hey Verne, would you mind ‘splainin this for the class? TIA!
Banksters all over it yet again Verne, thank goodness for sell limits, as I would not have exited VIX at 14 this am based on my opinion. Nonetheless, reloading now and adding bull June put spread on UVXY on top of the futures, which I’m now going out further on duration than the last 2 trades. (not trading advice).
I forced myself to take a little hedging short late yesterday as price stalled around a 62% fibo…trading with the main…good decision!! Took my small profit at the lower channel line hit (hourly main), and will reenter short if it’s broken downward. However, my expectation here is more chop in the short term.
man, nice call on gold…. thanks again
Glad to help; a little lucky but that’s okay!
you think this was 3 up, or did the 5 complete?
I don’t really have a count on it, I just saw the opportunity for the bounce off the primary fibo. Counting gold is sick. Corrections within corrections within corrections. Blech!!
Yeah, tell me about it.
Gold has been really difficult these last couple of weeks. But today, finally, I see the strength I was waiting for.