
Last analysis expected upwards movement. The whipsaw invalidated the hourly wave count, but price remains above the daily invalidation point.
The AD line, VIX and On Balance Volume all give the same signal today.
Summary: The target is now at 2,922.
Traders with a lower risk appetite may set stops just below today’s low. For those comfortable with the possibility of an underwater position for a few days, stops may be just below 2,553.80.
A more cautious approach here may be to wait for an upwards breakout above the triangle B-D trend line before entering another long position.
There is bullish divergence today between price and On Balance Volume, VIX and the AD line. Along with today’s bullish long lower wick, it looks like a low is in place here.
Always practice good risk management. Always trade with stops and invest only 1-5% of equity on any one trade.
New updates to this analysis are in bold.
The biggest picture, Grand Super Cycle analysis, is here.
Last historic analysis with monthly charts is here. Video is here.
An alternate idea at the monthly chart level is given here at the end of this analysis.
An historic example of a cycle degree fifth wave is given at the end of the analysis here.
MAIN ELLIOTT WAVE COUNT
WEEKLY CHART
Click chart to enlarge.
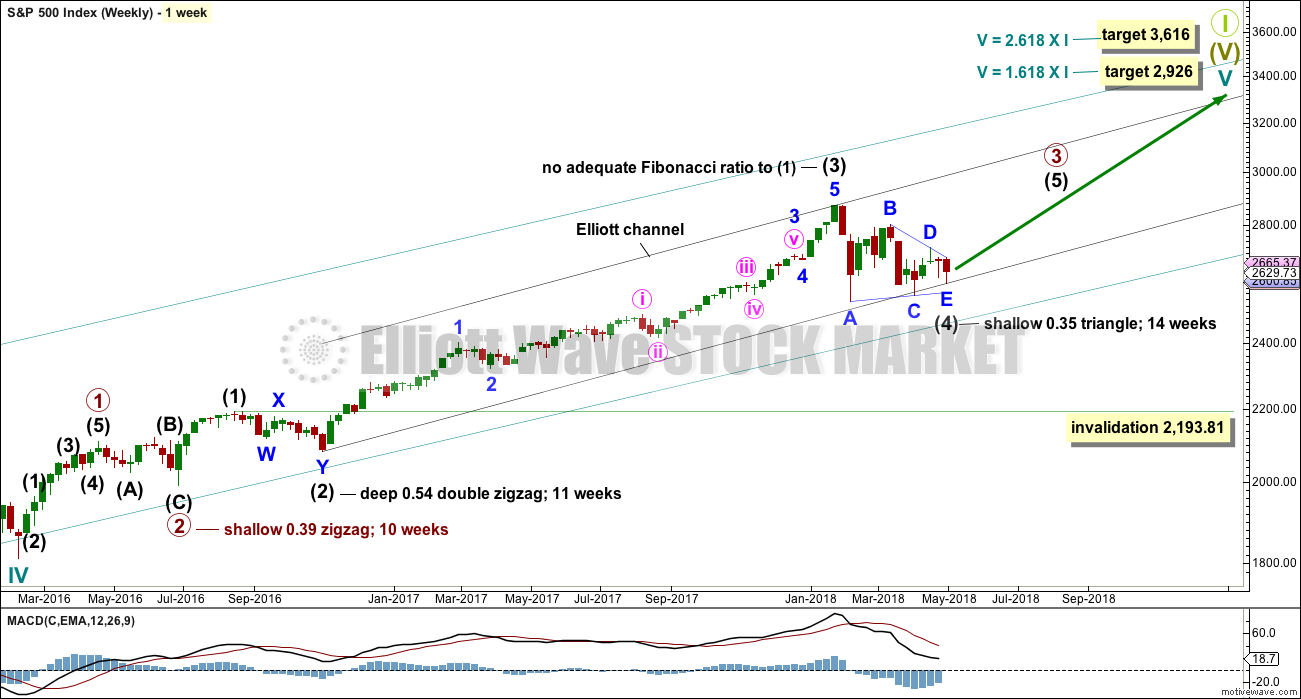
Cycle wave V must complete as a five structure, which should look clear at the weekly chart level. It may only be an impulse or ending diagonal. At this stage, it is clear it is an impulse.
Within cycle wave V, the third waves at all degrees may only subdivide as impulses.
Intermediate wave (4) has breached an Elliott channel drawn using Elliott’s first technique. The channel is redrawn using Elliott’s second technique: the first trend line from the ends of intermediate waves (2) to (4), then a parallel copy on the end of intermediate wave (3). Intermediate wave (5) may end either midway within the channel, or about the upper edge.
At least three wave counts remain valid at the daily chart level. It is possible still that a low may not be in place; intermediate wave (4) could still continue further. Intermediate wave (4) may not move into intermediate wave (1) price territory below 2,193.81. However, it would be extremely likely to remain within the wider teal channel (copied over from the monthly chart) if it were to be reasonably deep. This channel contains the entire bull market since the low in March 2009, with only two small overshoots at the end of cycle wave IV. If this channel is breached, then the idea of cycle wave V continuing higher would be discarded well before the invalidation point is breached.
Intermediate wave (4) may now be a complete regular contracting triangle lasting fourteen weeks, one longer than a Fibonacci thirteen. There is perfect alternation and excellent proportion between intermediate waves (2) and (4).
At this stage, there are still three possible structures for intermediate wave (4): a triangle, a combination, and a flat correction. All three will be published. The triangle is preferred because that would see price find support about the 200 day moving average. While this average provides support, it is reasonable to expect it to continue (until it is clearly breached).
The triangle may be complete now, but the other two possibilities of a flat and combination may be incomplete.
DAILY CHART
Click chart to enlarge.
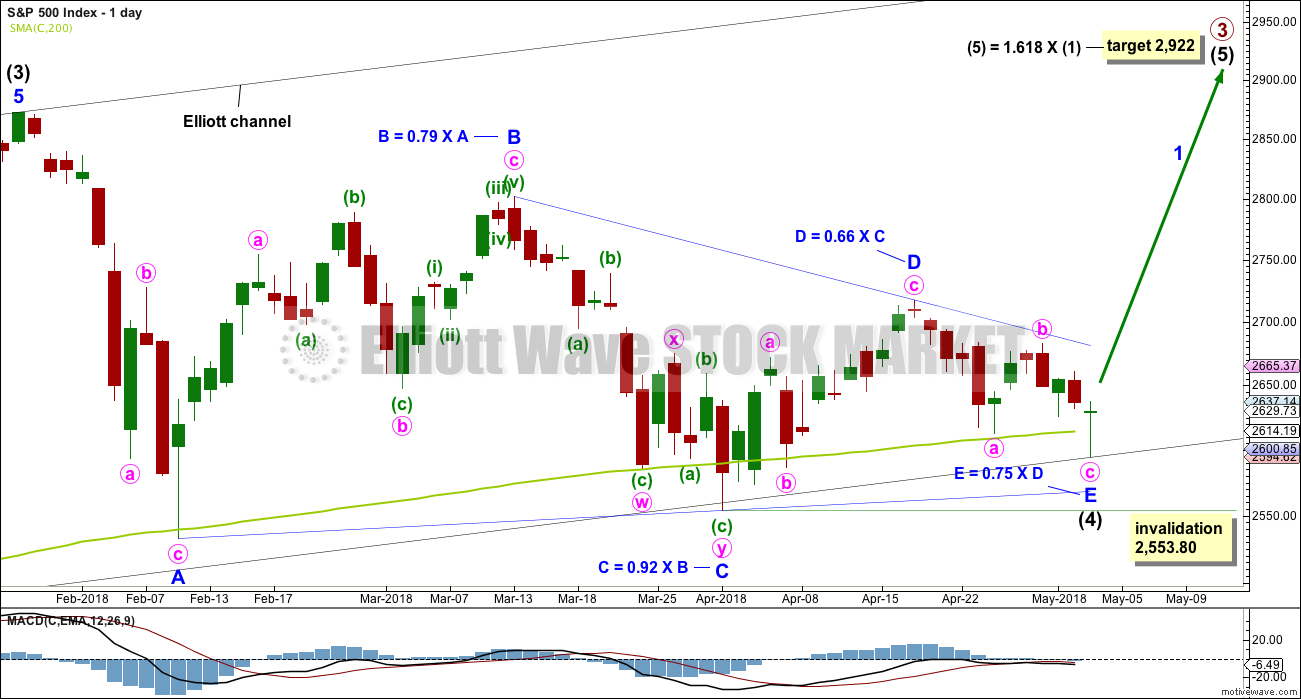
It is again possible that intermediate wave (4) is a complete regular contracting triangle, the most common type of triangle. Minor wave E may have found support just above the 200 day moving average and ending reasonably short of the A-C trend line. This is the most common look for E waves of triangles.
Intermediate wave (3) exhibits no Fibonacci ratio to intermediate wave (1). It is more likely then that intermediate wave (5) may exhibit a Fibonacci ratio to either of intermediate waves (1) or (3). The most common Fibonacci ratio would be equality in length with intermediate wave (1), but in this instance that would expect a truncation. The next common Fibonacci ratio is used to calculate a target for intermediate wave (5) to end.
It must still be accepted that the risk with this wave count is that a low may not yet be in place; intermediate wave (4) could continue lower. For this triangle wave count, minor wave E may not move beyond the end of minor wave C below 2,553.80.
When price has clearly broken out above the upper triangle B-D trend line, then the invalidation point may be moved up to the end of intermediate wave (4).
HOURLY CHART
Click chart to enlarge.
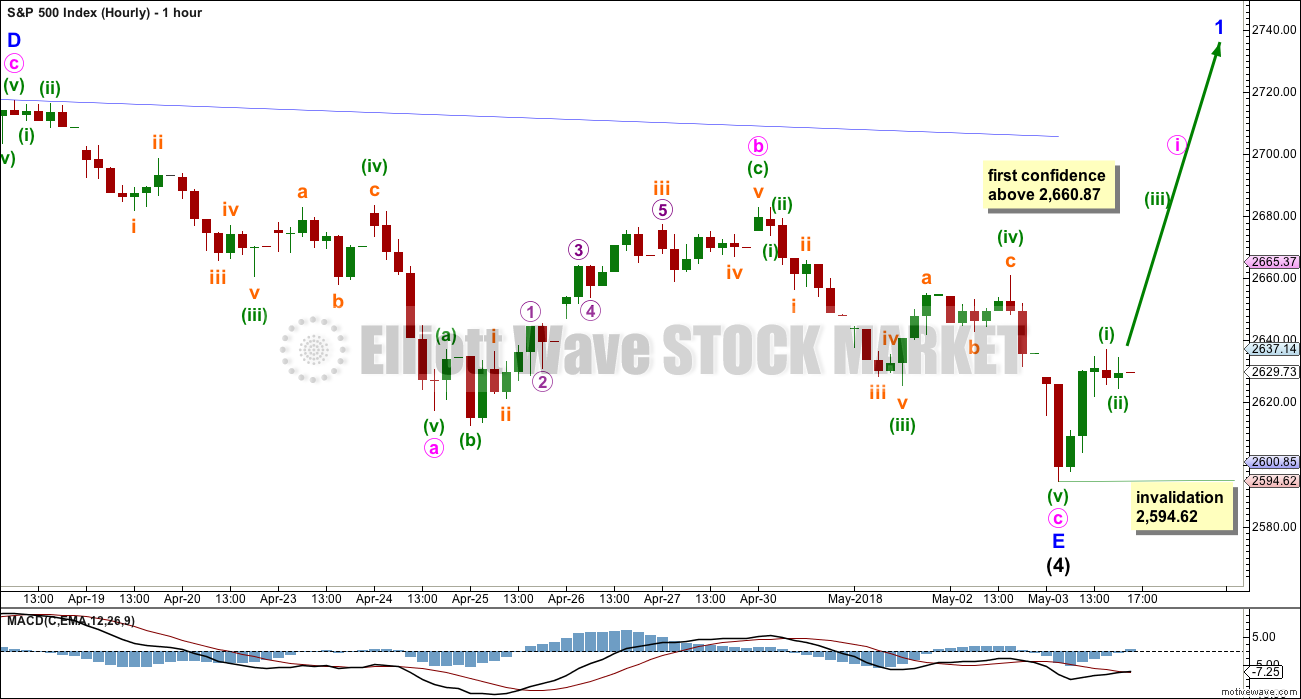
The whipsaw today may have been the end of minor wave E as a single zigzag. Within both of minute waves a and c, there is disproportion between the corrections of minuette waves (ii) and (iv), which gives each wave a three wave look where they should look like fives. Unfortunately, this is a tendency of this market. It does not always have threes that look clearly like threes, nor fives that look clearly like fives.
An alternate way to label this movement is given below.
If minor wave E is over at today’s low, then within intermediate wave (5) no second wave correction may move beyond the start of its first wave below 2,594.62.
A new high above 2,660.87 would invalidate the alternate below and provide first confidence in this main hourly wave count.
ALTERNATE HOURLY CHART
Click chart to enlarge.
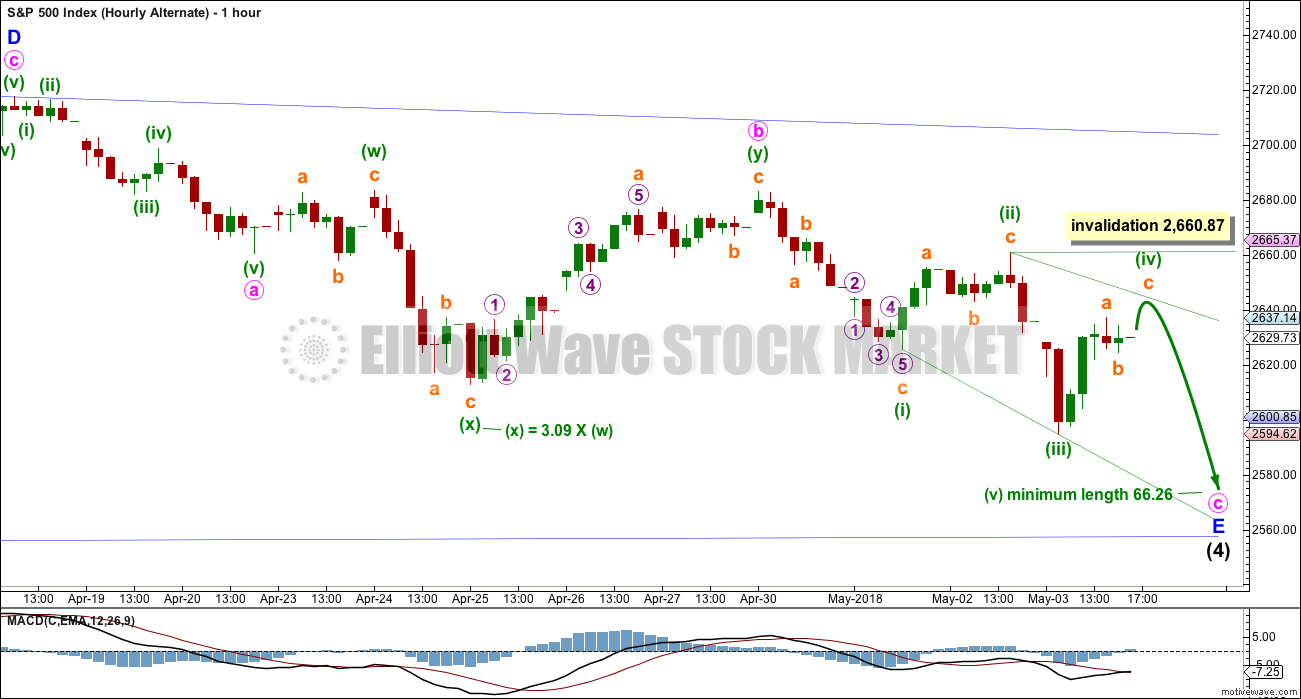
Here, all of minute waves a, b and c are labelled differently.
Minute wave a may have been over sooner. The proportions between minuette waves (ii) and (iv) within it now look good.
Minute wave b may have been a sideways double combination. The first structure in the double may have been an expanded flat labelled minuette wave (w). The double is joined by a three in the opposite direction labelled minuette wave (x). The second structure in the double may be a zigzag labelled minuette wave (y), ending very close to the same level as minuette wave (w). The problem here is the length of minuette wave (x). There is no Elliott wave rule stating a maximum nor minimum length for X waves within combinations, but there is a convention for flat corrections that states their B waves are very rarely more than twice the length of their A waves. That convention may logically be applied to X waves within combinations, as they are analogous to B waves within flats. Here, minuette wave (x) is much longer than twice the length of minuette wave (w) and that reduces the probability of this wave count.
All rules are met.
Minute wave c may be an ending expanding diagonal. Minuette wave (iv) must move a little higher for the trend lines to diverge, and it may not move beyond the end of minuette wave (ii) above 2,660.87. Thereafter, minuette wave (v) must be longer than equality in length with minuette wave (iii), which was 66.25 points.
Minor wave E may end with one more low tomorrow or Monday. It would most likely end short of the lower blue A-C triangle trend line.
ALTERNATE WAVE COUNTS
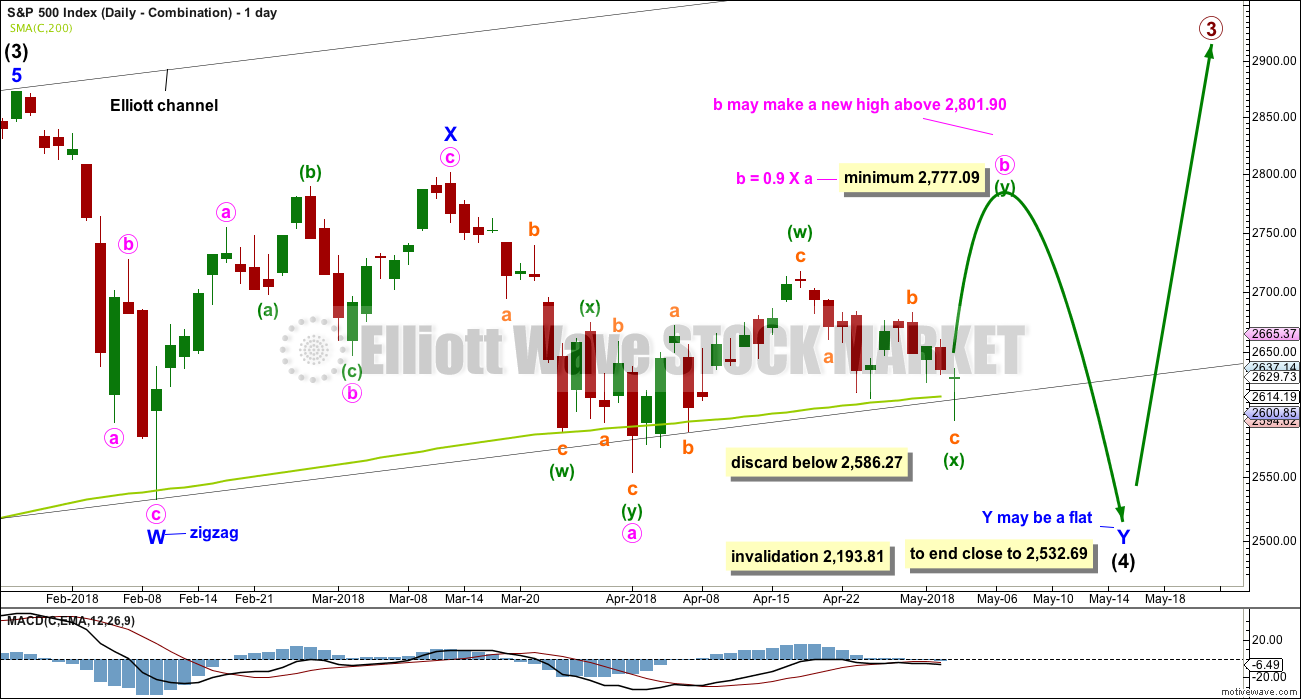
DAILY CHART – COMBINATION
Click chart to enlarge.
I have charted a triangle a great many times over the years, sometimes even to completion, only to see the structure subsequently invalidated by price. When that has happened, the correction has turned out to be something else, usually a combination. Therefore, it is important to always consider an alternate when a triangle may be unfolding or complete.
Double combinations are very common structures. The first structure in a possible double combination for intermediate wave (4) would be a complete zigzag labelled minor wave W. The double should be joined by a three in the opposite direction labelled minor wave X, which may be a complete zigzag. X waves within combinations are typically very deep; if minor wave X is over at the last high, then it would be a 0.79 length of minor wave W, which is fairly deep giving it a normal look. There is no minimum nor maximum requirement for X waves within combinations.
The second structure in the double would most likely be a flat correction labelled minor wave Y. It may also be a triangle, but at this stage the expected direction for that idea does not differ now from the main wave count.
A flat correction would subdivide 3-3-5. Minute wave a must be a three wave structure, most likely a zigzag. It may also be a double zigzag.
Minute wave b must now reach a minimum 0.90 length of minute wave a. Minute wave b may be unfolding as a double zigzag. Within a double zigzag, the second zigzag exists to deepen the correction when the first zigzag did not move price deep enough. Double zigzags normally have a strong slope like single zigzags. To achieve a strong slope the X wave within a double zigzag is normally brief and shallow, most importantly shallow (it rarely moves beyond the start of the first zigzag). A new low now below 2,586.27 should see the idea of a double zigzag for minute wave b discarded.
The purpose of combinations is to take up time and move price sideways. To achieve this purpose the second structure in the double usually ends close to the same level as the first. Minor wave Y would be expected to end about the same level as minor wave W at 2,532.69. This would require a strong overshoot or breach of the 200 day moving average, which looks unlikely but does have precedent in this bull market.
Minute wave b may make a new high above the start of minute wave a if minor wave Y is an expanded flat. There is no maximum length for minute wave b, but there is a convention within Elliott wave that states when minute wave b is longer than twice the length of minute wave a the idea of a flat correction continuing should be discarded based upon a very low probability. That price point would be at 3,050. However, if price makes a new all time high and upwards movement exhibits strength, then this idea would be discarded at that point. Minute wave b should exhibit obvious internal weakness, not strength.
At this stage, the very bullish signal last week from the AD line making a new all time high puts substantial doubt on this wave count. It has very little support from classic technical analysis.
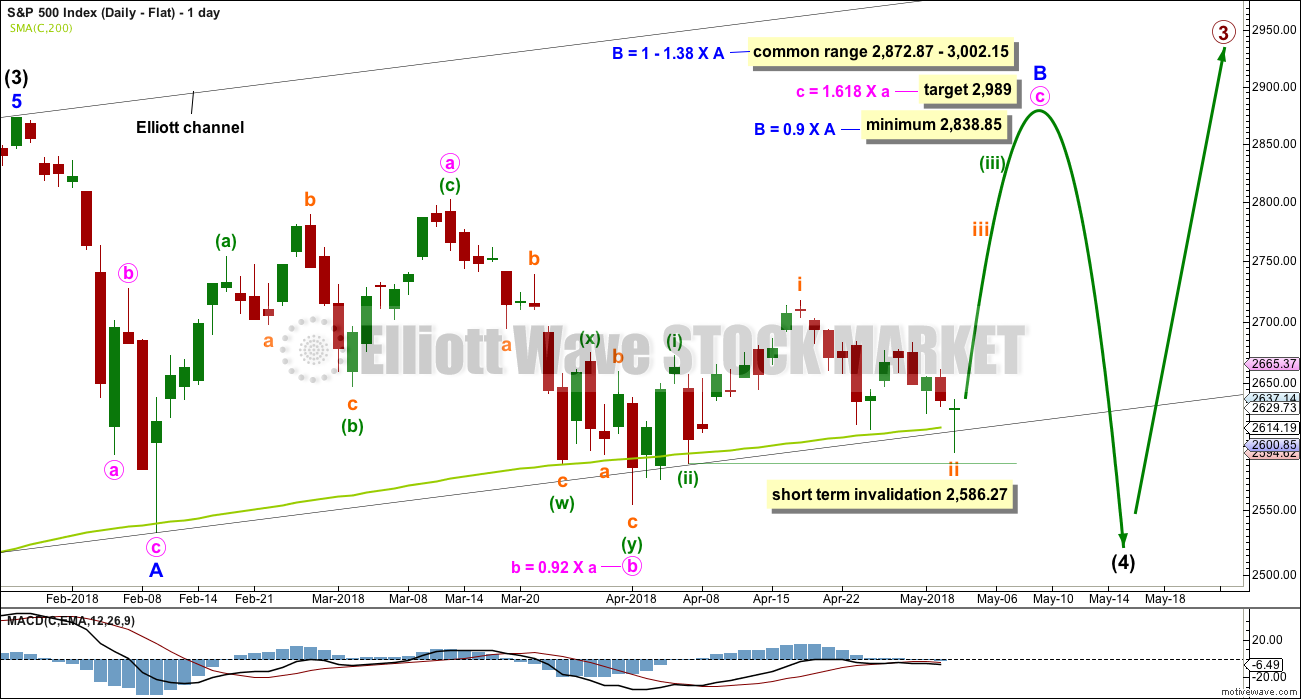
DAILY CHART – FLAT
Click chart to enlarge.
Flat corrections are very common. The most common type of flat is an expanded flat. This would see minor wave B move above the start of minor wave A at 2,872.87.
Within a flat correction, minor wave B must retrace a minimum 0.9 length of minor wave A at 2,838.85. The most common length for minor wave B within a flat correction would be 1 to 1.38 times the length of minor wave A at 2,872.87 to 3,002.15. An expanded flat would see minor wave B 1.05 times the length of minor wave A or longer, at 2,889.89 or above. A target is calculated for minor wave B to end, which would see it end within the common range.
Minor wave B may be a regular flat correction, and within it minute wave a may have been a single zigzag and minute wave b may have been a double zigzag. This has a very good fit.
However, minute wave c must be a five wave structure for this wave count and now the depth and duration of subminuette wave ii looks wrong. The probability that minute wave c upwards is unfolding as an impulse is now reduced. It is possible that it could be a diagonal, but that too has a relatively low probability as the diagonal would need to be expanding to achieve the minimum price target for minor wave B, and expanding ending diagonals are not very common.
At its end minor wave B should exhibit obvious weakness. If price makes a new all time high and exhibits strength, then this wave count should be discarded.
This wave count would require a very substantial breach of the 200 day moving average for the end of intermediate wave (4). This is possible but may be less likely than a smaller breach. The bullish signal from the AD line making a new all time high puts substantial doubt on this wave count.
TECHNICAL ANALYSIS
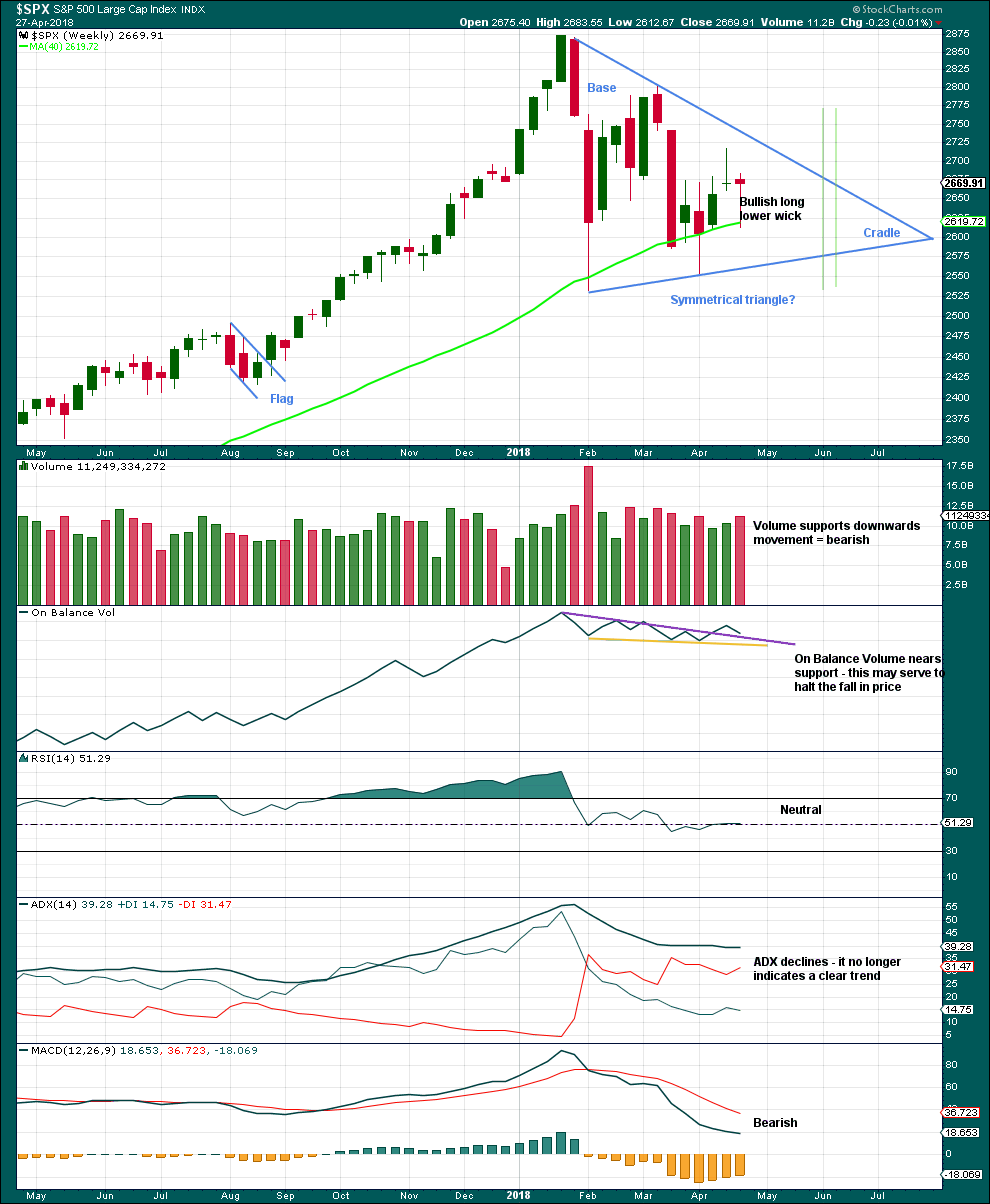
WEEKLY CHART
Click chart to enlarge. Chart courtesy of StockCharts.com.
A classic symmetrical triangle pattern may be forming. These are different to Elliott wave triangles. Symmetrical triangles may be either continuation or reversal patterns, while Elliott wave triangles are always continuation patterns and have stricter rules.
The vertical green lines are 73% to 75% of the length of the triangle from cradle to base, where a breakout most commonly occurs.
From Dhalquist and Kirkpatrick on trading triangles:
“The ideal situation for trading triangles is a definite breakout, a high trading range within the triangle, an upward-sloping volume trend during the formation of the triangle, and especially a gap on the breakout.”
For this example, the breakout has not yet happened. There is a high trading range within the triangle, but volume is declining.
The triangle may yet have another 6 – 7 weeks if it breaks out at the green lines.
A bullish long lower wick and support here or very close by for On Balance Volume suggest the pullback last week may be over, despite volume increasing. Looking inside the week at daily volume gives a clearer picture of where greatest support was.
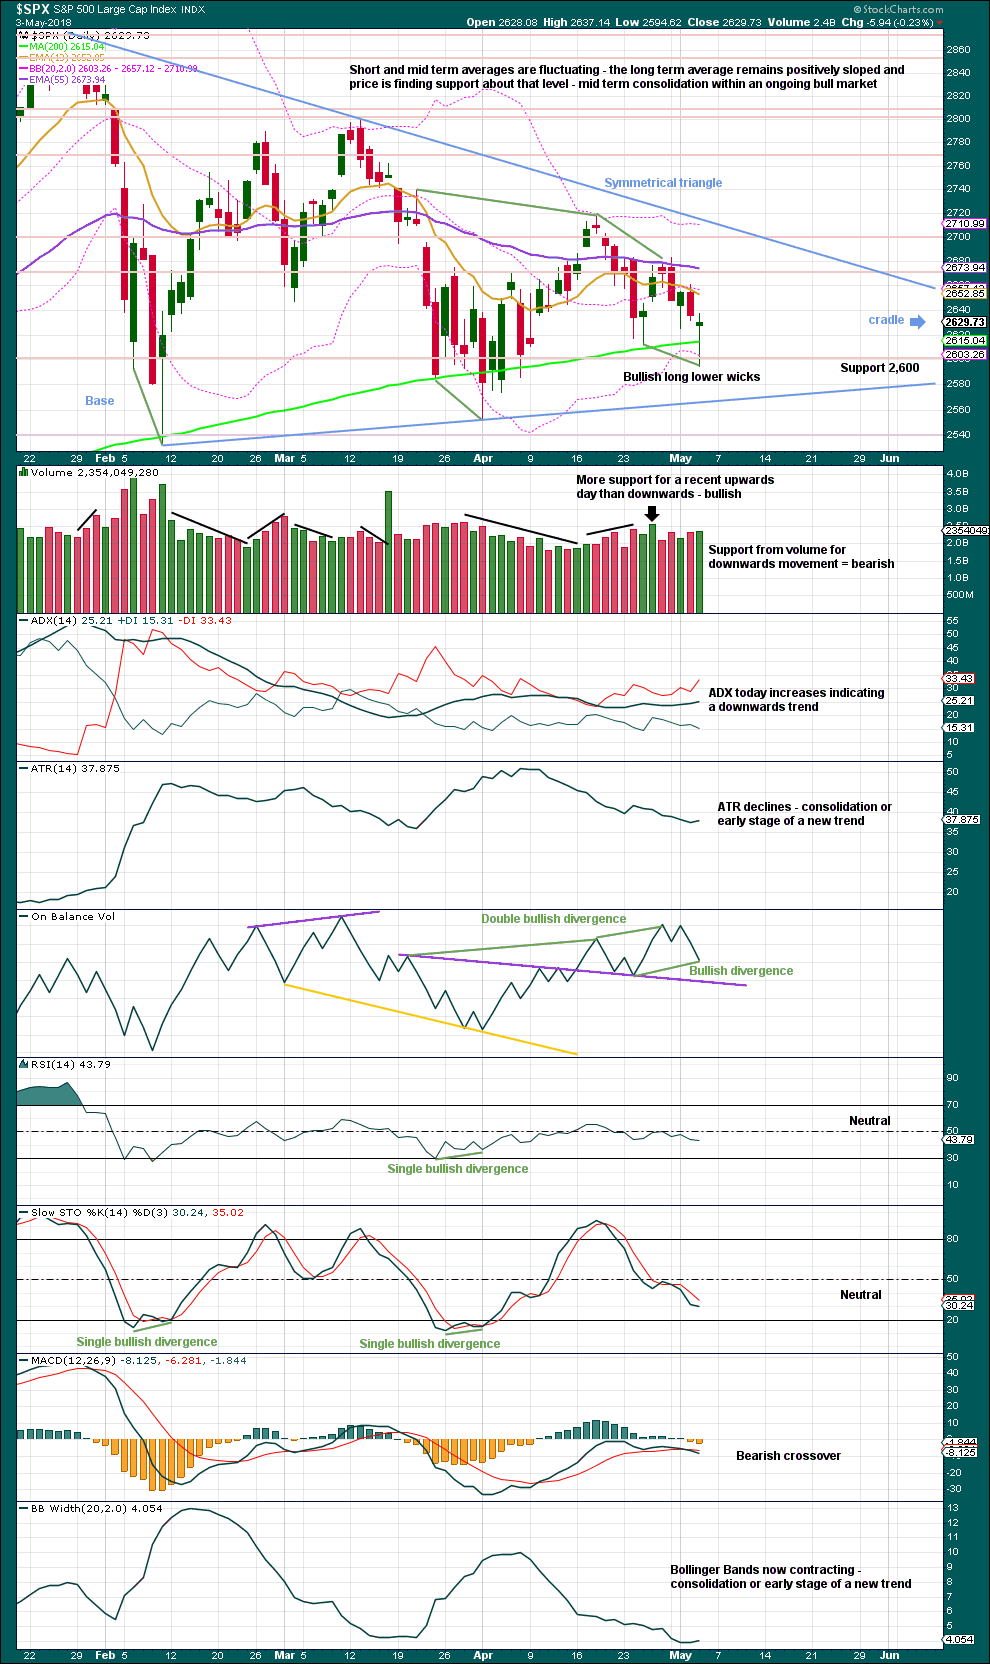
DAILY CHART
Click chart to enlarge. Chart courtesy of StockCharts.com.
During this large consolidation, there are two green daily candlesticks with strongest volume:
1. the 6th of February was a downwards day, but it closed green and the balance of volume that day was upwards; this has the strongest volume during the consolidation.
2. the 16th of March was an inside day, which closed green and has the balance of volume upwards; this has the next strongest volume.
This market has been range bound since the last all time high. Volume suggests an upwards breakout is more likely than downwards. With price coiling in an ever decreasing range, it looks like a classic symmetrical triangle is forming. These are similar but not completely the same as Elliott wave triangles. Symmetrical triangles may be either continuation or reversal patterns while Elliott wave triangles are always continuation patterns.
Breakouts from symmetrical triangles most commonly occur from 73% to 75% of the length from base to cradle. In this instance, that would be in another 19 to 21 sessions. A breakout should be a close above or below the triangle trend lines, and an upwards breakout should have support from volume for confidence.
After an upwards breakout, pullbacks occur 59% of the time. After a downwards breakout, throwbacks occur 37% of the time.
After a breakout, the base distance (the vertical distance between the initial upper and lower reversal point prices) may be added to the breakout price point to calculate a target. Here, the base distance is 320.28 points.
For most recent days, it is the upwards day of the 26th of April that has strongest volume. This is bullish. But for the last two days volume supported downwards movement, which is bearish.
This chart is mixed. Bearish are ADX, today’s volume and MACD. Bullish are the short term volume profile, On Balance Volume and support continuing about the 200 day moving average.
There are now two instances of recent bullish divergence between price and On Balance Volume. Price today has made a new swing low below the prior low of the 25th of April, but On Balance Volume has not. This indicates weakness in price and is bullish.
Today’s long lower wick is very bullish.
VOLATILITY – INVERTED VIX CHART
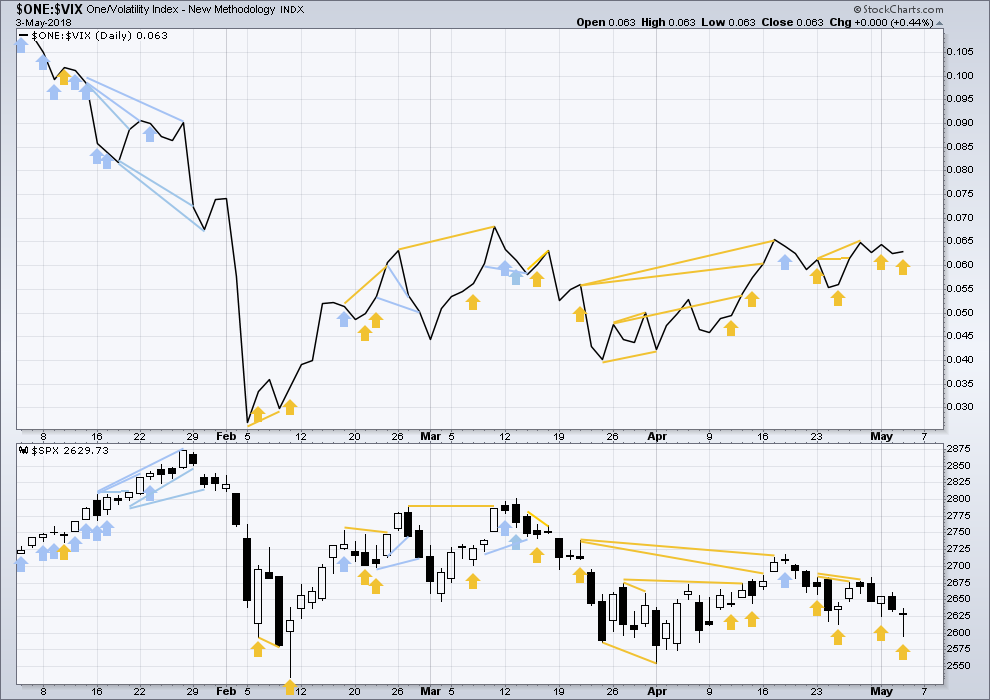
Click chart to enlarge. Chart courtesy of StockCharts.com.
So that colour blind members are included, bearish signals will be noted with blue and bullish signals with yellow.
Normally, volatility should decline as price moves higher and increase as price moves lower. This means that normally inverted VIX should move in the same direction as price.
There is still a cluster of bullish signals on inverted VIX. Overall, this may offer support to the main Elliott wave count.
Price today moved lower, but inverted VIX has moved higher. The fall in price has not come with a normal corresponding increase in market volatility; volatility has declined. This divergence is bullish.
BREADTH – AD LINE
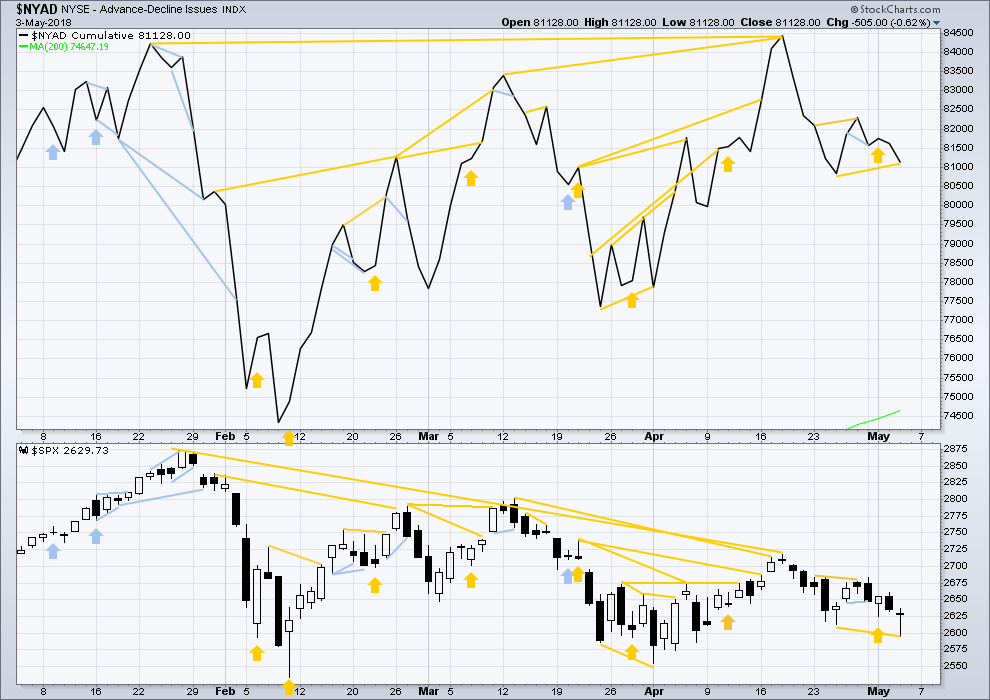
Click chart to enlarge. Chart courtesy of StockCharts.com.
There is normally 4-6 months divergence between price and market breadth prior to a full fledged bear market. This has been so for all major bear markets within the last 90 odd years. With no longer term divergence yet at this point, any decline in price should be expected to be a pullback within an ongoing bull market and not necessarily the start of a bear market. A new all time high from the AD line this week means that any bear market may now be an absolute minimum of 4 months away.
For most recent days, only mid and large caps have made new swing lows below the prior low of the 1st of May. Small caps have today not made a new small low. This pullback today does not have broad support from falling market breadth.
Breadth should be read as a leading indicator.
The new all time high from the AD line remains very strongly bullish and supports the main Elliott wave count.This new all time high from the AD line will be given much weight in this analysis. This is the piece of technical evidence on which I am relying most heavily in expecting a low may be in place here or very soon.
There has been a cluster of bullish signals from the AD line in the last few weeks. This also overall offers good support to the main Elliott wave count.
While both price and the AD line moved lower today, price has made a new swing low below the prior low of the 25th of April, but the AD line has not. This divergence is bullish, and it indicates weakness here within price.
DOW THEORY
The following lows need to be exceeded for Dow Theory to confirm the end of the bull market and a change to a bear market:
DJIA: 23,360.29.
DJT: 9,806.79.
S&P500: 2,532.69.
Nasdaq: 6,630.67.
At this stage, only DJIA has made a new major swing low. DJT also needs to make a new major swing low for Dow Theory to indicate a switch from a bull market to a bear market. For an extended Dow Theory, which includes the S&P500 and Nasdaq, these two markets also need to make new major swing lows.
Charts showing each prior major swing low used for Dow Theory may be seen at the end of this analysis here.
Published @ 07:08 p.m. EST.
Oh well…a deeper fourth…glad I got out earlier.
Have a great weekend “real traders”! hehe!
Namely, anyone who has lost money! Bye!
Here we go. Final move up back over DJI 400 to put a cherry on top! 🙂
A fourth underway, one more ramp…
Agreed! Was just looking at that on the hourly. The 2 was about 2 hours long. Not enough time to complete the 4 and go again today I suspect; the 4 needs to go quite a bit deeper to have proportion with the 2 (maybe to 2655 or so). Monday, another opening below market, a bit of selling, then another strong rally to complete this motive wave up.
If i may: thx to Lara, Kevin and Verne and all who posted…agreeing or disagreeing. I learned a lot and more importantly made some $$ tis week
Thank you for letting me know. It’s always great to hear when members are able to translate my analysis into profits.
Good morning everybody! I’m relieved to see those nice green candlesticks marching higher today.
Look out for resistance ahead at the triangle B-D trend line. It’s just ahead.
So far I can see a (i)-(ii)-(iii) upwards complete. Now for (iv). If it’s deep it may find support about the lower edge of the small green Elliott channel
Yes Maam!!
I always manage to post over you Lara lol!
LOL
and that wee fourth wave correction turned up right on time in the last hour of the session….
Thankfully, a nice profitable day trade has gotten me mostly dug out of yesterday’s “oops” that had a longer time horizon, and therefore a wider stop.
But I’m not doing a victory dance like some of the more dramatic “real traders” around here tend to do. Just sayin’ …
And why not? You earned it! 🙂
Lol…..ah go ahead and do a lap it the end of the week, you deserve it
🙂
I do so hope that others have managed to recoup some losses from that unexpected whipsaw yesterday.
They are going to run this baby up another hundred points into the close.
Exiting the short leg of my warehouse full of bull put credit spreads. Thank you banksters! 🙂
I’m extremely doubtful about that. The decidedly lower swing low on the 1 minute, combined with the turn at a 62% fibo, indicate that the run looks cooked for the day. But on my toes in case wrong!
resistance is ahead…
You all are awesome. Thanks for taking time to post during the day!
I was up at 5:30 am today. So may as well jump in here and be on hand….
My insomnia can sometimes be advantageous.
Yes indeed! I agree with Jonathan. Thank you so much, Lara!
SPX has hit 61.8% retrace of the downmove starting Apr 17 and the upper BB/keltners on the hourly too; indications are th-th-th-that’ll be all for today. I hope this day didn’t surprise anyone. This is the normal kind of thing after a big (BIG!) oops day that nails key fibo support as well.
Scaled calls today. Will probably buy some puts at close if this rips higher into close. Would love to hedge a little around 50ma. Have a good weekend everyone!!!
I see GLD is back at the bottom of it’s very large (123.5 to 129) range it’s been gryating in since Jan. I’ve started scaling in myself.
Nice ….. should be interesting to see what the commercials have done during this dip. I’m guessing they cut there short position and maybe added some longs. One of these days wham, zoom….going to the moon.
Maybe! But the way gold’s been going, we could all have expired before this range is exceeded!!! I’ll take 62% of the way up the range and call it a “thank you ma’am!” myself.
Gold Commercials were took about 30 k off the short side. Silver was about 20 k off the short positions. Silver large specs are now net short. Now we need someone to light that fuse.
http://news.goldseek.com/COT/1525462225.php
I’ve been watching gold too. I’ve started long positions on GDX and SLV… If you think gold is going higher, silver is a good bet right now with gold/silver ratio around 80!
At the minimum we will likely get a swing high on gold/silver as the USD corrects from its current very overbought condition…
Yep. We are probably headed back to at least the triangle’s upper boundary. I expect to see a price acceleration into the close and looking to unload some calls by the close.
I expect the 50 day to once again prove resistance.
Folks this market is proceeding exactly as Hoyle says it should after a pretty massive reversal day like yesterday, completing a perfect 1.27% extension of the prior “a” wave. And a Larry Williams “oops” day as well! Bam, strong continuation to the upside, which I did suggest was a likely scenario yesterday around the close. Now the question is: what does it mean for the immediate future? Well, nominally we should expect several more days of up, generally, though the momentum won’t likely keep up at this pace. BUT the steepest triangle downtrend line isn’t far away!!!! So something has to give. Note that there is ANOTHER triangle downtrend line higher up. I don’t know if it’s “proper” from an EW perspective, but I am considering the potential that the D wave never completed, and will only complete when that higher downtrend line is hit. (And note that the upper bollinger/keltner will line up well with that upper downtrend line around the time price will likely hit it.) THEN an E wave down, and THEN a launch of the new intermediate 5. This also will help “fill in” the triangle, as suggested is necessary per Lara’s TA at the daily/weekly level. I just do not think that this set up is going to crash and turn against the lower steep downtrend line; I suspect price pushes right through that next week. Cheers!!!
Interesting perspective, Kevin, that D may still be incomplete. Without deeply analyzing it, the idea seems plausible. Hopefully Lara will give us her reaction when she can.
I know I am going to get another visit from the guys at the SEC lol!
Did any one see that incredible spike down on VIX this morning??!!
Well, somebody got their head handed to them as I had a contingent/limit order to sell 18.00 strike puts at a limit of 3.75 just for giggles and BOO-YAH!!
Who ARE those morons??!!! 🙂
Maybe its due to investigation they’re starting on them due to manipulation complaints… There was some news on that issue yesterday.
They used to do it every Wednesday on expiration. I guess they have moved the ambush to Friday to throw people off guard lol! 🙂
Let me guess: you quickly put on your rabbit suit and answer the door with “What’s up, Doc?” ……
That has been assigned to one well-armed Mr. Fudd… 🙂
This is not the way you want the day to start if you are a bull.
I have some grave reservations about the US stock markets, intermediate term. If yesterday’s low is broken, the next level of concern is 2554, the low currently labeled Minor C. If that goes we are looking at a move to 2450, imo.
Perhaps my primary concern is that every market technician and their brother (sister too) can see the triangle from January’s high. If the market strives to fool the most and do the most damage, it would indicate another strong and long leg down. It is from a capitulation that the next move up, Intermediate 5 can start. I am sitting on hands.
In the past the fed lowering rates in the face of a serious sell off is what gets the market turned around. While this game can’t last forever I would be surprised if the fed didn’t go to this in the face of a broad, scary sell off. I don’t think it will work for long.
I have to smile every time I hear people asserting that the FED is somehow reducing their bloated balance sheet. I have wondered why folk are so incurious about exactly to whom the FED is selling. There are not, after all, too many entities that can take them off the FED’s hands, and the fact of the matter is that they have continued to add MBS instruments.
Potential buyers of course, would be other central banks. Perhaps a few hedge funds. Perhaps some pension funds.
We know that other central banks are already up to their eyeballs in debt related so-called assets. Remember they were all the buyers of last resort during the last crisis. I doubt central banks will be taking that stuff off the FED’s hands. The buying power of hedge funds and pension funds is nowhere near sufficient to soak up that many assets. Baby boomers are retiring at the rate of 10K daily and many pension funds are actually going to have to start liquidating assets to meet the retirement needs of these retirees.
Who is the FED going to sell this stuff to??
What do you think is going to happen to real estate prices in an environment of rising interest rates AND and ageing population that tends to downsize as they approach retirement? As the economist Harry Dent observes, what you will have increasingly is many more die-rs than buy-ers.
Bad news for MBS.
Now I know that some assets can be “rolled off” the books as they mature and reduction can happen that way but not all of it. What about the rest?
Looking quite bullish now I’d say. Nothing unexpected: a little 2, then pushing higher past the open. Sideways/up overall for a few days at least, to the descending trend line. Then, we’ll see.
As I said end of day yesterday, the combination of a structurally complete correction off the April 18 high, and the strong reversal off the daily lower squeezed bollinger band, and the weekly momentum being “up”, all strongly indicated a shift back to “bull mode”, and that’s exactly what we have today. It’s clear to me price is staying in the daily/weekly level up channel for a while (many days to several weeks) now. And this could be the ideal time to take longer term longs, WITH STOPS GETTING RAISED as it goes. Because as many have noted, this could turn around after going higher, maybe a lot higher, and then tank back below the 200. I believe a move to at least the sharpest descending triangle line is very likely now, and perhaps well beyond. But as Lara points out, “it won’t be a straight line”.
Kevin, if you dont mind sharing: wat indicators do u use for determining the “weekly momemtum is up”
StochasticRSI. Chart attached. StochRSI across bottom, right-most green up arrow is the long (momentum up) signal.
To be clear, this is a pure momentum signal. My TREND indicator (combination of CCI and ADX, generated 5 levels of trend: strong and mild up and down, and neutral: see the attached weekly chart with color bars) is still “mild downtrend” at the weekly level (if it was “strong downtrend”, the red would be bright blood red, not that milder orange/red). Also mild downtrend still at the daily level. The hourly has just in the last 2 hours from from mild downtrend to neutral. Of course the 5 minute is strong to mild up most of today. So technically…”mixed signals”, as you would expect in giant churning intermediate 4 wave!
Thx!!! Appreciate it
The whipsaw is out early today ….
I believe that’s the 2 following yesterday’s afternoon 1. A buying opportunity should set up shortly.
Some of you I know are wondering:
“Why is Verne talking about failed bullish signals? Is he off on another of his “conspracy theory”rants?”
I was going to save this comment for later but may as well get it out there now as I may not have time to post tomorrow
First. A question.
How many savvy traders do you think have been watching this triangle coil the past few months and are expecting a powerful break from it?
You all know the answer to that one.
Also. how many of that number do you think are confident the break will come with a penetration of the upper or lower boundary line?
Again, you can probably venture a pretty good guess.
Furthermore, how many of that number do you think will wait for a suucessful back test of the broken boundary line?
You would be correct in guessing “probably a minority”
Now, here is the 64K question.
How many of those disciplined enough to wait for a succesful back test will be alert to anticipate the POSSIBILITY, that even an apparently successful back test could ultimately FAIL, trapping untold numbers of unsuspecting traders who have confidently gone “all in”? with a brutal revetsal from which there can be no recovery?
Just thinking outside the box.
Trade Safe
Trade Smart.
All the Best.
And..what’s that look like? It looks like the combination structure or flat structure Lara’s been showing as alt’s for weeks. Break up through the upper triangle line, proceed a little ways or even a lot, come back down for the “retest” per the “obvious triangle”…and WHOOPS!!! Oh yea. More likely in the end than the triangle in my estimation. Only after the final “gotcha!!!” massive sell off (and final big ringing of the cash register by the goldman sacks trading desk on this overall 4 wave) does a bull market reemerge, after a final big (bigger) spike of fear. Well…one day at a time.
I’ll even go so far as to guess the final bottom price of that final flat or combination C or Y wave down: it’s going to be around 2460-70, where C = the initial big A. But who knows, maybe it just exits the triangle up and never looks back. I just don’t think so, not that it really matters in the end. In the end the intermediate 5 will eventually launch, be it from triangle, combo, or flat. This we know with very high probability.
Has anyone else noticed that lately normally bullish signals being thrown off by the markets are not being confirmed by subsequent bullish price action? I have noted several glaing examples very recently and am strarting to wonder. Some obvious recent examples have been OBV, the A/D line, and very recently long lower shadows. Donwards movement tmorrow will see this very strange anomaly persist and I think this quite strange, and frankly somewhat disconcerting…any thoughts?
Primarily a function of being in massive 4 wave triangle? Those indicators are getting whipsawed just like a lot of investors. The market isn’t under the control of the bulls vis a vis continuous buying pressure like all of 2018. Nor continuous selling pressure. So it’s under the control of big trading money, and they are “doing their thing” and generally raking the public. The nature of a 4, and hence the triangle. Until buying pressure or selling pressure from the broader crowd takes control. Then those indicators will work better, again. That’s how I view it.
I am voting for the Alt Daily Combination. I am accumulating upside call spreads about a month out and also short vol in a few different ways. It feels like we are coiling for a rally but overall I am pessimistic. Again, I don’t see this market at ATH with rates higher and the FED continuing to hike and trim balance sheet. I just can’t see ATH. Around 2700 – 2750 I’m a seller as per Alt wave count. Reserve the right to change all my views tomorrow of course with new information and Lara’s guidance!
You may be inclined to dismiss my opinions due to “inexperience”, but I am inclined to trust Lara’s assertion that every bear market for the last 100 years has been preceded by divergence between price and the AD line. If that is indeed the case, I find it unlikely that this market will be the exception. Not to say that it could not happen, but it would be the first time since the end of World War I.
It won’t be the exception. Market isn’t in nor headed toward a bear market yet. If it heads that way…those indicators will fire, first. You have to go by the sign posts on your way to bear country, they can’t really be dodged, right Rodney? But this market can still fall, a lot, before even getting to those sign posts, and in fact still be in a legitimate intermediate 4 structure here. I really like Lara’s lower 8 year+ trend line as another key early bear indicator.
Noticed! Investors may be satisfied with portfolios on the sidelines since their unrealized gains/(losses) don’t keep them up at night. Or investors are satisfied with low yield, low risk bonds due to various current event factors (insert financial news channel of choice here). I’m puzzled as to why the 1st Qtr earnings season hasn’t drawn as much attention to raise the indices off the 200-day moving average by now. Selling pressure is strong, almost unreasonably strong.
This month, I’m focusing on individual equities poised for a bull run and I’ll be glad to share my current watchlist below. These stocks have “survived” the February through April months and may be worth evaluating to add to your portfolios. Call options with a June 2018 expiration and a strike at 75% ITM are my personal preference. Starting with small positions now (1% of portfolio) and increasing once we receive confirmation from Lara’s EW count that signals a macro uptrend has resumed. I subscribe to Lara’s EW to gain a sense for the macro trends, which I am grateful!
Watchlist:
Visa (V)
Sarepta Therapeutics (SRPT)
Palo Alto (PANW)
Constellation Brands (STZ)
TD AmeriTrade (AMTD)
E*Trade Financial (ETFC)
BetaShares Global Cybersecurity ETF (HACK)
If you like this type of post, I’ll be glad to share more of my personal watchlist as the month of May unfolds.
I’m interested in if and when you think one of your watch list stocks is in a good buy position, and why. I see all are on monster runs on the weekly charts. Which also means they are significant risk of a major profit taking sell off. What’s your criteria for a potential buy on these kinds of insane bull runners, and what indications do you use to trigger in and execute?
Kevin, since February 2018, this is a work in progress and is actually firming up to become something I’d like to share with this group. The stocks I keep on my watchlist actually move in step with the major indices, but these stocks hold much better support levels than the major indices. Take a look at each of these stock’s weekly charts. For each stock, entry is based a little bit on the S&P Short Range Oscillator for oversold conditions in SPX. Now I’ve grown to appreciate Lara’s EW targets for SPX and I’ve found them to be reliable. Based on a variety of inputs: 1) Lara’s daily analysis, 2) oversold conditions in SPX becoming apparent, or 3) a bottom is likely in place for SPX, I buy the call option for the stocks on my watchlist with 45 days til expiration and 75% in the money. Very small position sizes since it is a naked call option and I’m aware of the 100% max loss since there’s no hedge. Speaking of risk and exiting, I’d rather place a mental stop loss at 15% of the cost basis of the call option contract and realize the small loss if the stock price moves against me rather than buying a hedge in every trade. Again, max loss is 100% and would be realized at expiration if the stock price doesn’t recover, so tight stop losses are essential. To exit for profit.. it depends. Since the stocks on the watchlist follow SPX closely, then when level II depth on SPX looks like more deaths than a Rambo movie, then sell.
Honestly, keeping a close eye on the SPX price action tells us when to sell these stocks. When VIX spikes on the 5 min chart following a news event, then sell with the intention to wait out the market noise (about 24 hours) and then buy the call option again. I prefer to keep stocks on the watchlist that increase gradually over time. It’s odd that there are a few stocks out there that actually perform like this even in the current market conditions. [knocking on the most solid piece of oak as I say this]
Today was ideal for SRPT. From 9:30 AM to 9:40 AM it went vertical. If I see vertical on a chart, this is a sign to take profits. By 9:45 AM it ran out of steam and level II confirmed this. From reading the weekly chart for one year back, this stock spikes then goes into a couple weeks of range bound price action. Another entry will be… it depends. Mainly looking to enter when SPX goes into oversold territory (I used to look at Slow Stochastics, RSI, MACD, etc. now just looking at the S&P Short Range Oscillator and following Lara’s daily analysis).
The main reason I’m attracted to these stocks is from their ability to hold excellent support levels. For Lara’s EW analysis, I am grateful. It is providing targets to anticipate in the S&P 500, which can be used for directional trades as we see fit.
For Kevin, I’m glad you asked the question, because I’ve never had to write this down before! Lol The trading plan is a work in progress, but one of the crucial tools as a leading indicator is Lara’s EW analysis. Again, rare to stumble on stocks that follow the SPX and have solid support below. When the main count has exhausted the macro bull run, I know I will have to discard this trading plan, as it will not necessarily work in a downtrending SPX. Perhaps the watchlist then becomes stocks that follow SPX when bearish. Buy put options and reverse the directional trades completely. I’ll be here when it comes, so I hope to share what the trading plan evolves into by then. 🙂
Please don’t take this as advice for anyone to act on, this is just my perspective on one way to trading this current market. Glad I joined this group, as Lara’s EW and all of your comments have turned around my 2018 trading for the better!
(sorry for the long winded response. I guess I should have just said I use judgement to enter and exit Lol)
THanks for the answer. Seems straight forward enough. I used to promote my own system that focused strictly on super high and consistent momentum stocks(the old IBD 100), utilizing a strategy of “all trading risk capital in” across 10 positions at all times, constantly taking 3% profits immediately (limit profit sells), and fully reinvesting in the next trade. With VERY deep stops (15%), driving the win rate to the mid 80%’s or even higher for periods. Compounds like the dickens in bull markets with high price (historical) volatility instruments. I’m starting to redeploy it now using a segment of my trading equity, anticipating this 5 wave action. (As an aside I have an Amazon ebook on the system I’m happy to give to anyone interested, “The Spec-K Trading System”.) These are great stocks to add the potential portfolio, thank you!
Anticipating this 5 wave action in SPX is precisely why I’ve been hunting stocks that follow SPX but have significantly better support levels. During the 5 wave up to Lara’s target of SPX 2,922 is plenty of time to benefit from a watchlist like the stocks I’ve been researching.
Kevin, thank you for mentioning the eBook “The Spec-K Trading System”. I would like to receive a copy. Please send to
Would be nice timing if the 5 wave action has started right around 5/5 (cinco de mayo) 🙂
First!!! I like the alternative hourly chart. May have one more day of downside.
Futures confirming…
I like it too Sundeep. Good to have a roadmap of what’s happening should it tumble again tomorrow!
Sundeep,
Some are saying the timing window for trend change was May 3-5 (others are now piling on to say May 7-9 but that has plus or minus a day or so on either side. This would imply in the current market break to the higher grounds.
Overall, I do see the markets dropping significantly post June/July for a few years and much lower to about 2430 ish at minimum. But before that a ramp higher will occur in May. Watching to see if the turn window does show up today (or might have happened yesterday).