
Price gapped higher but did not reach the short term target before turning a little lower in a mostly sideways day for Friday.
At the end of this week, there are signals from On Balance Volume, the AD line, and VIX that support the Elliott wave counts.
Summary: A multi week consolidation may be over. An upwards breakout may be imminent. The target is at at 2,940. However, the risk still remains that a low is not yet in place. If price does move a little lower, then risk is at 2,553.80.
For the short term, expect some sideways / lower movement for Monday to a short term target at 2,653. Thereafter, expect an increase in upwards momentum.
Always practice good risk management. Always trade with stops and invest only 1-5% of equity on any one trade.
New updates to this analysis are in bold.
The biggest picture, Grand Super Cycle analysis, is here.
Last historic analysis with monthly charts is here. Video is here.
An alternate idea at the monthly chart level is given here at the end of this analysis.
An historic example of a cycle degree fifth wave is given at the end of the analysis here.
MAIN ELLIOTT WAVE COUNT
WEEKLY CHART
Click chart to enlarge.
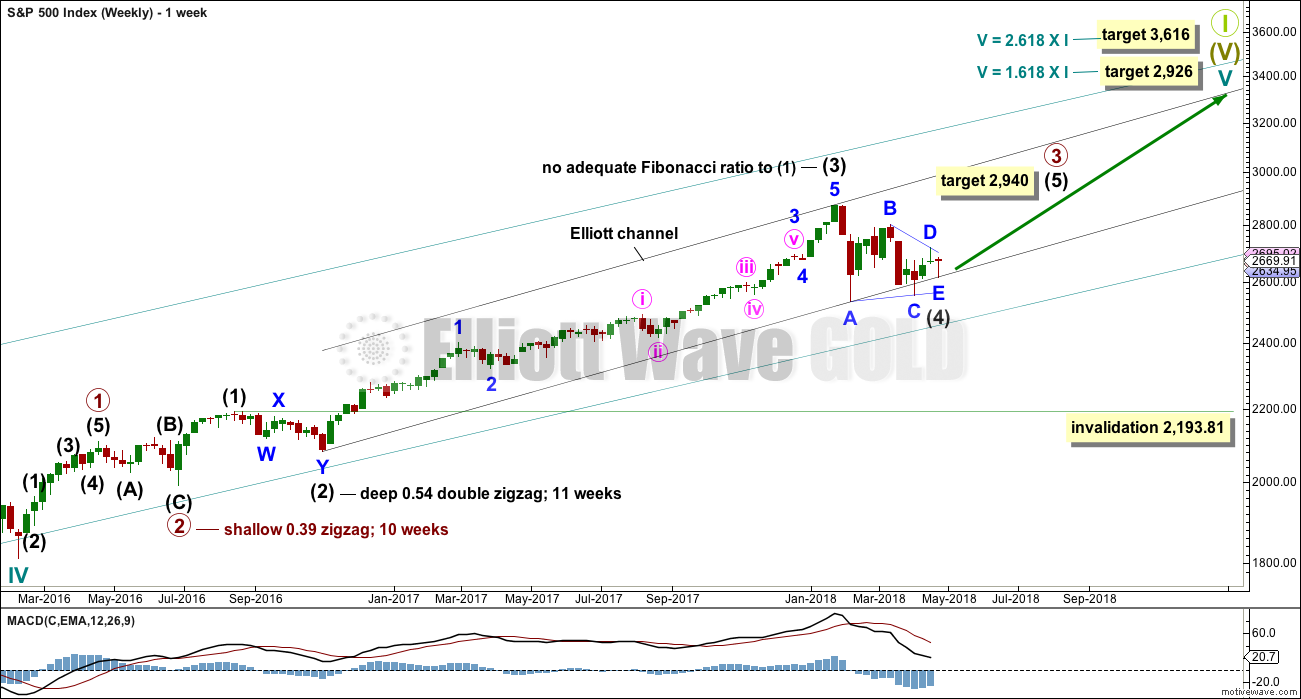
Cycle wave V must complete as a five structure, which should look clear at the weekly chart level. It may only be an impulse or ending diagonal. At this stage, it is clear it is an impulse.
Within cycle wave V, the third waves at all degrees may only subdivide as impulses.
Intermediate wave (4) has breached an Elliott channel drawn using Elliott’s first technique. The channel is redrawn using Elliott’s second technique: the first trend line from the ends of intermediate waves (2) to (4), then a parallel copy on the end of intermediate wave (3). Intermediate wave (5) may end either midway within the channel, or about the upper edge.
At least three wave counts remain valid at the daily chart level. It is possible still that a low may not be in place; intermediate wave (4) could still continue further. Intermediate wave (4) may not move into intermediate wave (1) price territory below 2,193.81. However, it would be extremely likely to remain within the wider teal channel (copied over from the monthly chart) if it were to be reasonably deep. This channel contains the entire bull market since the low in March 2009, with only two small overshoots at the end of cycle wave IV. If this channel is breached, then the idea of cycle wave V continuing higher would be discarded well before the invalidation point is breached.
If intermediate wave (4) ends anytime within this week, then it would total a Fibonacci 13 weeks. It would have excellent proportion with intermediate wave (2), and there would be perfect alternation if it is over as a shallow triangle.
At this stage, there are still three possible structures for intermediate wave (4): a triangle, a combination, and a flat correction. All three will be published. The triangle is preferred because that would see price continue to find support about the 200 day moving average. While this average continues to provide support, it is reasonable to expect it to continue (until it is clearly breached).
DAILY CHART
Click chart to enlarge.
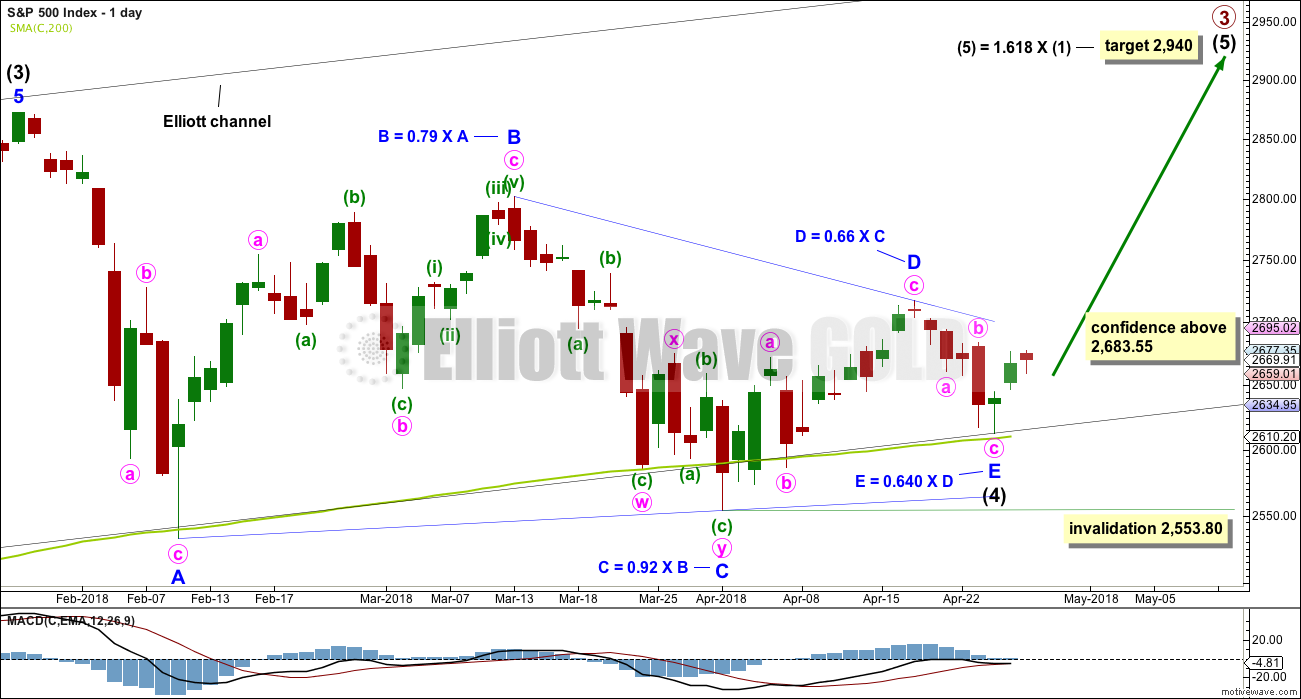
It is possible that intermediate wave (4) is a complete regular contracting triangle, the most common type of triangle. Minor wave E may have found support just above the 200 day moving average and ending reasonably short of the A-C trend line. This is the most common look for E waves of triangles.
Intermediate wave (3) exhibits no Fibonacci ratio to intermediate wave (1). It is more likely then that intermediate wave (5) may exhibit a Fibonacci ratio to either of intermediate waves (1) or (3). The most common Fibonacci ratio would be equality in length with intermediate wave (1), but in this instance that would expect a truncation. The next common Fibonacci ratio is used to calculate a target for intermediate wave (5) to end.
It must still be accepted that the risk with this wave count is that a low may not yet be in place; intermediate wave (4) could continue lower. For this triangle wave count, minor wave E may not move beyond the end of minor wave C below 2,553.80.
HOURLY CHART
Click chart to enlarge.
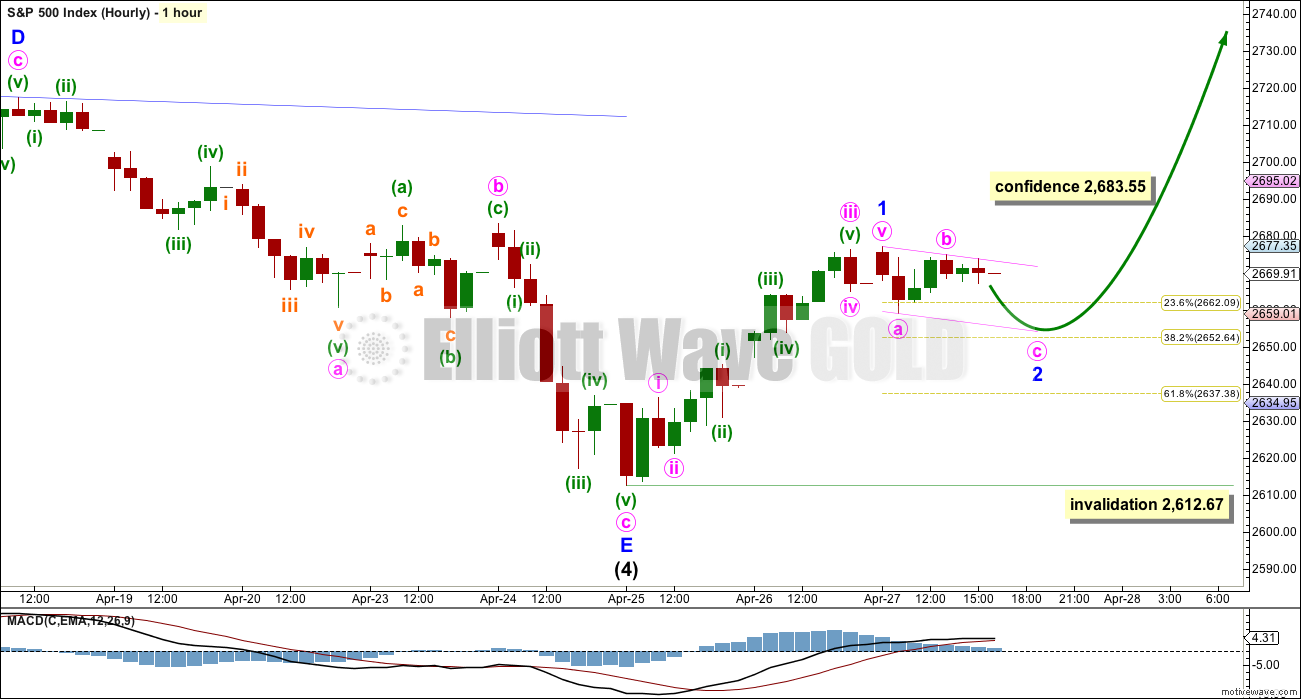
Minor wave E subdivides as a complete zigzag.
A new high above 2,683.55 would add further confidence that a low may be in place. This point is the start of minute wave c within minor wave E. A new high above the start of minute wave c could not be a second wave correction within minute wave c, so at that stage minute wave c would have to be over.
Intermediate wave (5) must subdivide as a five wave structure. At the hourly chart level, the structure should begin to unfold with a five up. So far this is labelled minor wave 1, which may now be complete.
Sideways movement during Friday’s session has taken price out of the channel drawn in last analysis. The movement looks too big to be another correction within minor wave 1; it looks like a new separate wave, which may be the start of minor wave 2.
Minor wave 2 may be a zigzag. If minute wave c ends about the lower edge of the small Elliott channel, then minor wave 2 may only reach about the 0.382 Fibonacci ratio at 2,653.
When minor wave 2 may be complete, then an increase in upwards momentum for minor wave 3 may be expected. This may provide an upwards breakout out of the triangle trend lines.
ALTERNATE WAVE COUNTS
DAILY CHART – COMBINATION
Click chart to enlarge.
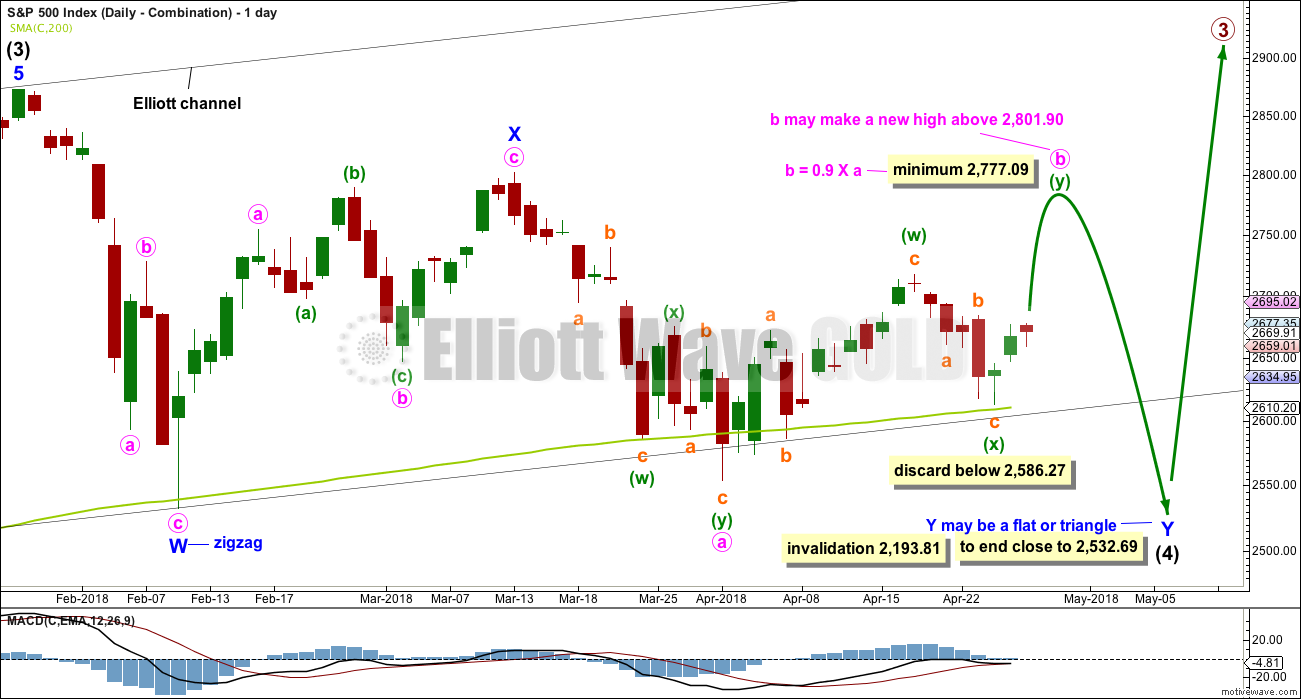
I have charted a triangle a great many times over the years, sometimes even to completion, only to see the structure subsequently invalidated by price. When that has happened, the correction has turned out to be something else, usually a combination. Therefore, it is important to always consider an alternate when a triangle may be unfolding or complete.
Double combinations are very common structures. The first structure in a possible double combination for intermediate wave (4) would be a complete zigzag labelled minor wave W. The double should be joined by a three in the opposite direction labelled minor wave X, which may be a complete zigzag. X waves within combinations are typically very deep; if minor wave X is over at the last high, then it would be a 0.79 length of minor wave W, which is fairly deep giving it a normal look. There is no minimum nor maximum requirement for X waves within combinations.
The second structure in the double would most likely be a flat correction labelled minor wave Y. It may also be a triangle, but in my experience this is very rare, so it will not be expected. The much more common flat for minor wave Y will be charted and expected.
A flat correction would subdivide 3-3-5. Minute wave a must be a three wave structure, most likely a zigzag. It may also be a double zigzag.
Minute wave b must now reach a minimum 0.90 length of minute wave a. Minute wave b may be unfolding as a double zigzag. Within a double zigzag, the second zigzag exists to deepen the correction when the first zigzag did not move price deep enough. Double zigzags normally have a strong slope like single zigzags. To achieve a strong slope the X wave within a double zigzag is normally brief and shallow, most importantly shallow (it rarely moves beyond the start of the first zigzag). A new low now below 2,586.27 should see the idea of a double zigzag for minute wave b discarded.
The purpose of combinations is to take up time and move price sideways. To achieve this purpose the second structure in the double usually ends close to the same level as the first. Minor wave Y would be expected to end about the same level as minor wave W at 2,532.69. This would require a strong overshoot or breach of the 200 day moving average, which looks unlikely but does have precedent in this bull market.
Minute wave b may make a new high above the start of minute wave a if minor wave Y is an expanded flat. There is no maximum length for minute wave b, but there is a convention within Elliott wave that states when minute wave b is longer than twice the length of minute wave a the idea of a flat correction continuing should be discarded based upon a very low probability. That price point would be at 3,050. However, if price makes a new all time high and upwards movement exhibits strength, then this idea would be discarded at that point. Minute wave b should exhibit obvious internal weakness, not strength.
At this stage, the very bullish signal this week from the AD line making a new all time high puts substantial doubt on this wave count. It has very little support from classic technical analysis.
DAILY CHART – FLAT
Click chart to enlarge.
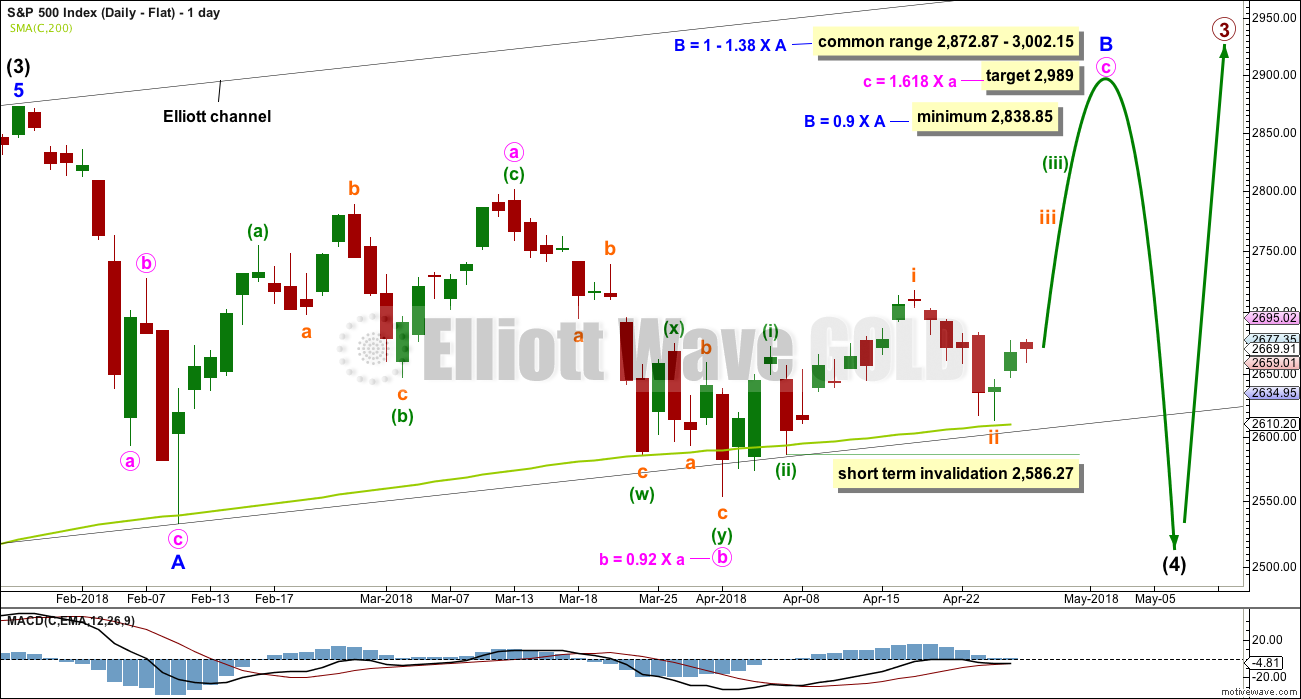
Flat corrections are very common. The most common type of flat is an expanded flat. This would see minor wave B move above the start of minor wave A at 2,872.87.
Within a flat correction, minor wave B must retrace a minimum 0.9 length of minor wave A at 2,838.85. The most common length for minor wave B within a flat correction would be 1 to 1.38 times the length of minor wave A at 2,872.87 to 3,002.15. An expanded flat would see minor wave B 1.05 times the length of minor wave A or longer, at 2,889.89 or above. A target is calculated for minor wave B to end, which would see it end within the common range.
Minor wave B may be a regular flat correction, and within it minute wave a may have been a single zigzag and minute wave b may have been a double zigzag. This has a very good fit.
However, minute wave c must be a five wave structure for this wave count and now the depth and duration of subminuette wave ii looks wrong. The probability that minute wave c upwards is unfolding as an impulse is now reduced. It is possible that it could be a diagonal, but that too has a relatively low probability as the diagonal would need to be expanding to achieve the minimum price target for minor wave B, and expanding ending diagonals are not very common.
At its end minor wave B should exhibit obvious weakness. If price makes a new all time high and exhibits strength, then this wave count should be discarded.
This wave count would require a very substantial breach of the 200 day moving average for the end of intermediate wave (4). This is possible but may be less likely than a smaller breach.
TECHNICAL ANALYSIS
WEEKLY CHART
Click chart to enlarge. Chart courtesy of StockCharts.com.
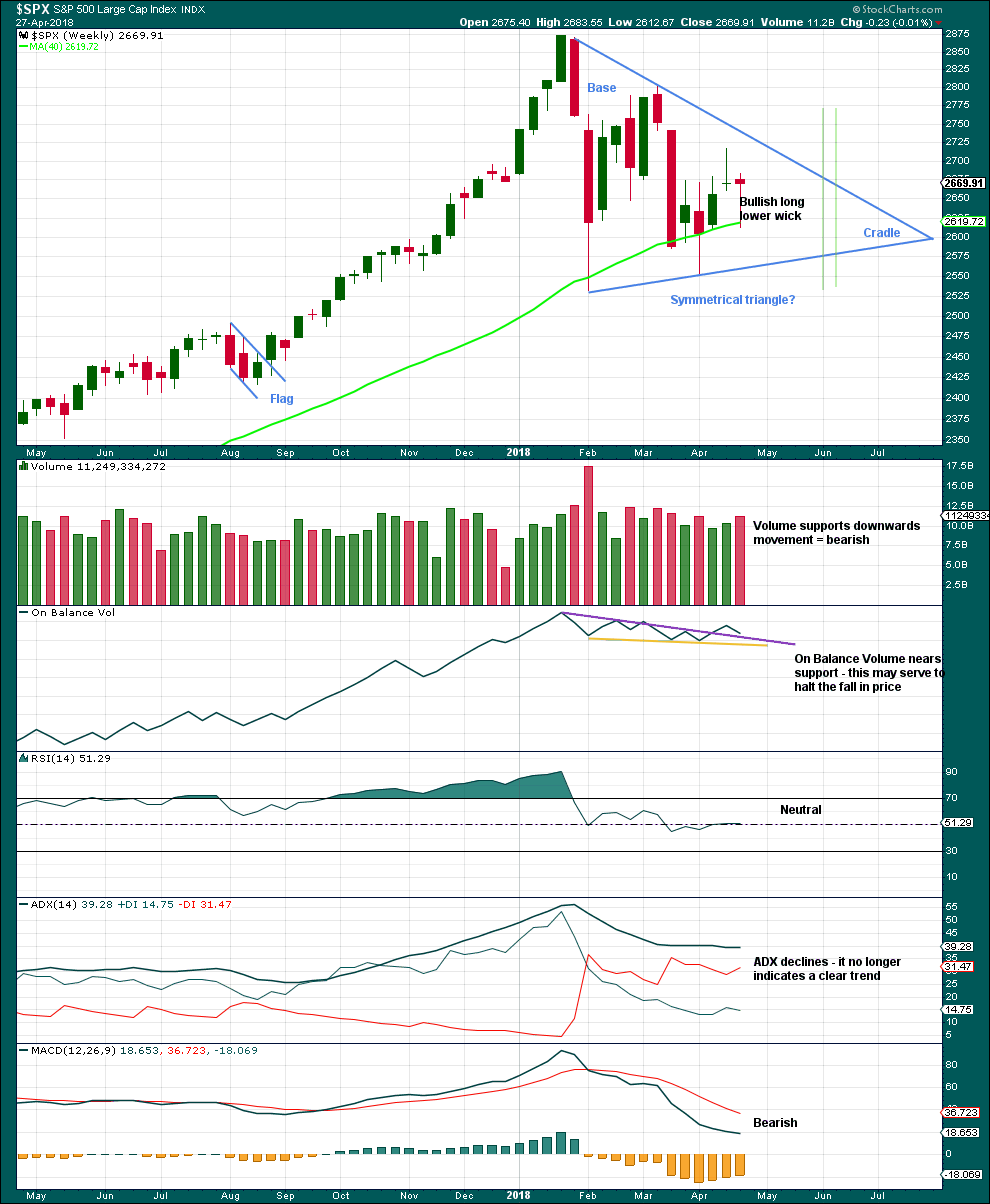
A classic symmetrical triangle pattern may be forming. These are different to Elliott wave triangles. Symmetrical triangles may be either continuation or reversal patterns, while Elliott wave triangles are always continuation patterns and have stricter rules.
The vertical green lines are 73% to 75% of the length of the triangle from cradle to base, where a breakout most commonly occurs.
From Dhalquist and Kirkpatrick on trading triangles:
“The ideal situation for trading triangles is a definite breakout, a high trading range within the triangle, an upward-sloping volume trend during the formation of the triangle, and especially a gap on the breakout.”
For this example, the breakout has not yet happened. There is a high trading range within the triangle, but volume is declining.
The triangle may yet have another 6 – 7 weeks if it breaks out at the green lines.
A bullish long lower wick and support here or very close by for On Balance Volume suggest the pullback this week may be over, despite volume increasing. Looking inside the week at daily volume gives a clearer picture of where greatest support was this week.
DAILY CHART
Click chart to enlarge. Chart courtesy of StockCharts.com.
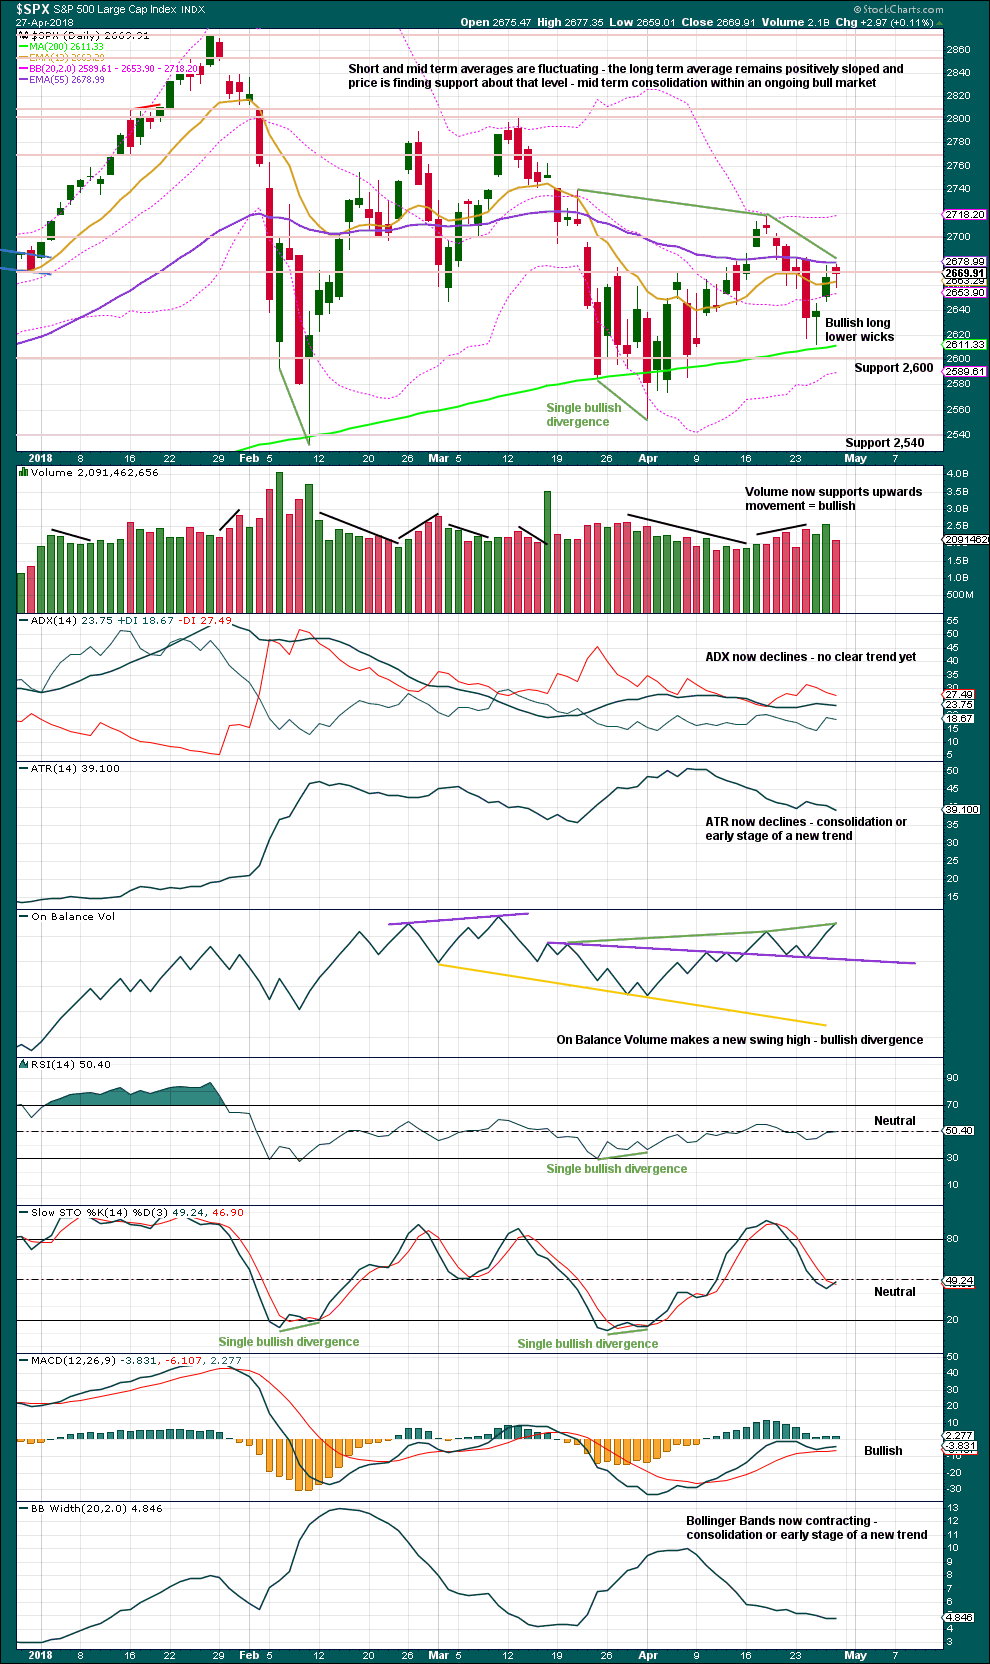
Within the last few days, there is more support for upwards days than downwards.
Friday’s upwards movement did not make a new high for price above the prior swing high of the 18th of April, but On Balance Volume has made a new high. This divergence is bullish as On Balance Volume should be read as a leading indicator. This supports the Elliott wave counts.
VOLATILITY – INVERTED VIX CHART
Click chart to enlarge. Chart courtesy of StockCharts.com.
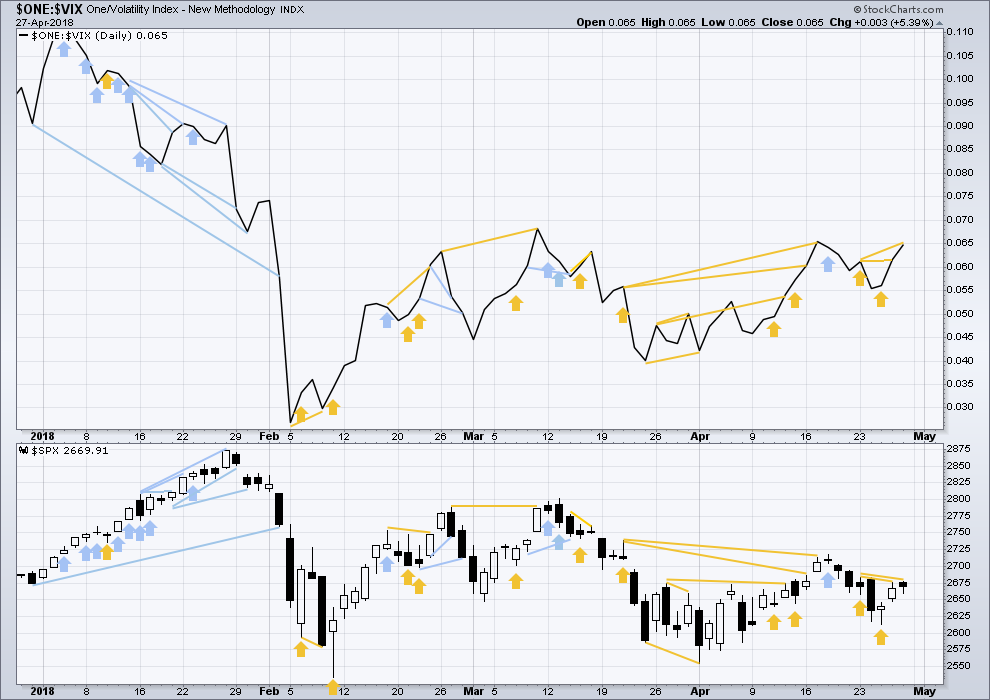
So that colour blind members are included, bearish signals will be noted with blue and bullish signals with yellow.
Normally, volatility should decline as price moves higher and increase as price moves lower. This means that normally inverted VIX should move in the same direction as price.
Inverted VIX has made another small new swing high above the prior high of the 23rd of April, but price has not. If VIX is a leading indicator, then this divergence is bullish.
BREADTH – AD LINE
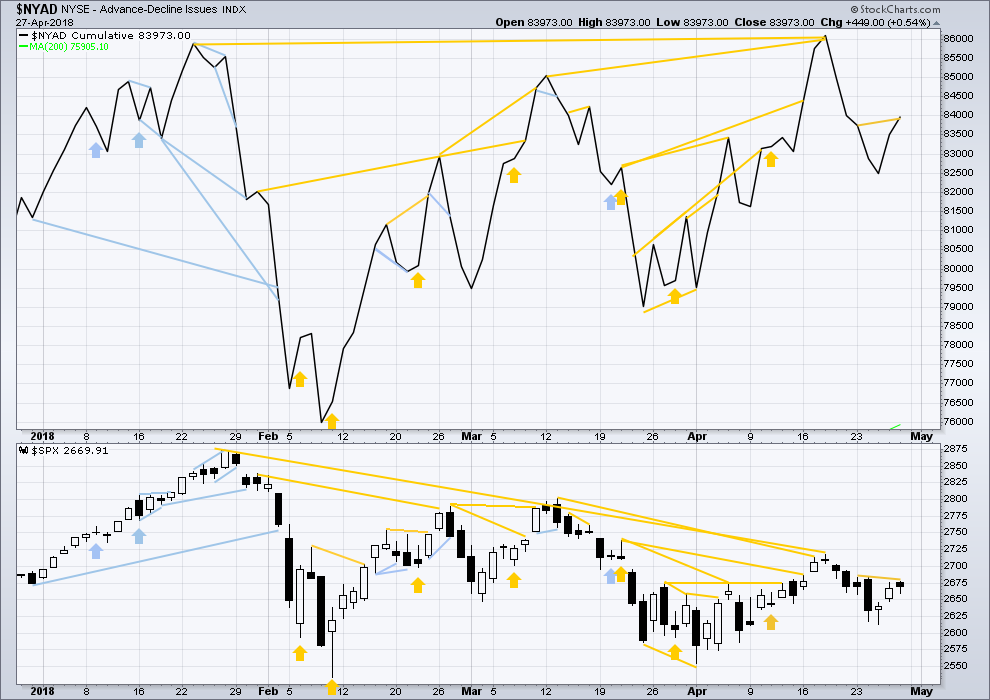
Click chart to enlarge. Chart courtesy of StockCharts.com.
There is normally 4-6 months divergence between price and market breadth prior to a full fledged bear market. This has been so for all major bear markets within the last 90 odd years. With no longer term divergence yet at this point, any decline in price should be expected to be a pullback within an ongoing bull market and not necessarily the start of a bear market. A new all time high from the AD line this week means that any bear market may now be an absolute minimum of 4 months away.
All of small, mid and large caps have made at least slight new lows below their prior swing lows of the 13th of April. This pullback has support from falling market breadth.
Breadth should be read as a leading indicator.
The new all time high from the AD line remains very strongly bullish and supports the main Elliott wave count.This new all time high from the AD line will be given much weight in this analysis. This is the piece of technical evidence on which I am today relying most heavily in expecting a low may be in place here or very soon.
There has been a cluster of bullish signals from the AD line in the last few weeks. This also overall offers good support to the main Elliott wave count.
The AD line has made a new swing high above the prior high of the 23rd of April, but price has not. This divergence is read as bullish as the AD line is read as a leading indicator.
DOW THEORY
The following lows need to be exceeded for Dow Theory to confirm the end of the bull market and a change to a bear market:
DJIA: 23,360.29.
DJT: 9,806.79.
S&P500: 2,532.69.
Nasdaq: 6,630.67.
At this stage, only DJIA has made a new major swing low. DJT also needs to make a new major swing low for Dow Theory to indicate a switch from a bull market to a bear market. For an extended Dow Theory, which includes the S&P500 and Nasdaq, these two markets also need to make new major swing lows.
Charts showing each prior major swing low used for Dow Theory may be seen at the end of this analysis here.
Published @ 11:24 p.m. EST.
Two short “squeeze, tap and turn” set ups today on the SPX 5 minute, both worked perfectly. I got one…somehow missed the other.
Anyone thinks that the gap open from 2639.40 from April 23/26 will be closed before we move up from here? As close as we are, I keep thinking we will reach that before a blast off…
it could provide support…
not all gaps get closed
FWIW, this not usually the way VIX trades just ahead of a third wave higher. Of course that could change by the close with a new low and strong VIX reversal, so not a bad idea to stay alert. I am still holding profitable bear call spreads on SPY for a VIX reversal signal.
Have a great evening everyone!
Possibly. The high side of that gap is exactly at the 50%. But 62% retraces are far more common that 50%. Here’s the model I’m continuing to consider, along with Lara’s update, the one I described this morning.
Yep. I suspect we are not quite done….
the 50% approacheth…and once there, the 62% is going to be like a black hole sucking price down I’d guess.
this level in here by the way is quite supportive/resistive over the last 2 months, draw a line check it out.
btw a perfect squeeze approach tap and turn set up with 21 period bb’s and keltner’s on the spx 5 minute. Sadly I didn’t take it…next time!!!
Updated hourly chart:
When I look at minor 2 on the 5 minute chart, minute b fits well as a zigzag, and now minute c fits well as a completed impulse.
I like the start of 3’s…may one start right here and now! No sign yet…
We got a new low. Took profits on day trades. We likely get a nice bounce into tomorrow but I would be cautious as it could be corrective.
Anybody else took the VIX free money this morning?! 🙂
Yep. Now in a probable fourth. Tomorrow will see monthly inflows so we are likely to see a bounce at the very least. I think we see one more low today.
Clear impulse down on SPX 5 minute, with wave 5 in process (but stalled at 38% fibo, could b be done there). Again I expect a 3 wave up B then a C down, to at least the 50% at 2648 and probably to the 2639.6 62%. I’ll be looking to short the C wave down, should it set up and trigger as expected.
FWIW, here is how I currently have the last couple of days labeled.
Yep…
that’s exactly what I see too Rodney
an expanded flat
If this can close below that number of 2640.0 Leaving 3 Red Months in a row then
Next stop for next month target might be 2442 – 2470
14 – 15% Correction from ATH
If it closes tomorrow below that number that would be ok because its in a new month and there would be a little bit more wiggle room there on a Monthly Basis time recognition pattern.
But then again price can’t just stay at this level neither for to long if so that can also be a big negative for the chart pattern as well.
We are at some major cross roads here in this market.
DJI, SPX, and NDX all continue to trade below their respective 50 day while RUT and DJT finding support there. This makes for a very uncertain near term diagnosis for equities. I am still mostly market neutral.
It does appear that the dollar is in a new uptrend. Short FXE, long UUP.
Happy hunting!
2 done or B wave ?
I don’t know. I view the market today as “range bound” rather than trending, and a good day to either fade the extremes or just stay out. The current push down might be a good entry point for a long fade on the turn. The lower 21 period keltner is in a half squeeze and is close, and the BB isn’t far below that.
Hi Kevin
I think it would be a very bearish case if this closes below 2640.8 Today.
Which I think is highly unlikely.
If it does close below there today I would expect the selloff to continue to a new low below the 2532 level or at least equal that.
But looking at past performances on the charts monthly term for the past few decades. Would strongly suggest a new low.
If we can hold above that key level today that might offer better chart pattern recognition.
Please share
Thank You
Yes. This has been the case for some time. If you look at a daily chart, what you clearly have is a multi month sideways coil that we entered after an impulse down. Is is so easy to loose sight of the bigger picture when we get too close to the daily gyarations.
Perhaps the initial push up this morning was the END of the 1 wave up, and THIS sell off is the 2. I.e., the April 27 action wasn’t the 2, it was the iv of the five wave 1. The 62% retrace of the Apr 25 low to the high this morning is 2639.4. If this is a 2, it certainly could end up turning down there today or tomorrow. The sellers have control…
Perhaps this…
Could finished much higher as well, the 38% or 50%. So far I only see an A wave at the hourly level. So careful with that axe eugene when this initially turns up…
Is it time to consider the rare possibility that the intermediate 4 is indeed a combination with a TRIANGLE Y in process (instead of a flat)?
this is what that would look like
pretty much no divergence in terms of expected direction from price between this and the main wave cont at this stage
After I looked at it in more detail, those were pretty much my thoughts too; can’t tell the difference with the large triangle model.
Good day mates. I hope everyone has a great weekend.
I was not able to spot any bears the past couple of days. I’ll try again mid next month. I need to go deeper into the wilderness and to much higher elevations which are currently under deep snow.
It was nice to come home and see I made good profits on SPX while off in the wilderness playing around.
Say hello to my little friend, Doc…! 🙂
I dink I see ah double setup!!!…
Welcome back Rodney
Do bears hibernate until about October? Maybe another trip to find our bear then?
Lara,
The bears in North America that hibernate begin sometime around late October or early November. They come out of their dens in March and April for the most part. This is impacted by the winter weather and the latitude, the farther northern areas of course are longer winters.
of course, silly me!
living down here at the bottom of the world in opposite land, I sometimes forget our summer is your winter
🙂