
Again, upwards movement continues as expected from last analysis.
Summary: Expect upwards movement this week. The target is now a range within 2,752 – 2,766. When there is more upwards structure to analyse, then a smaller target may be calculated.
Another bullish signal from the AD line supports this upwards bounce. Resistance at On Balance Volume may initiate a pullback with the bounce here or very soon.
Do not expect this upwards swing to move in a straight line. Look out for a pullback for a B wave within it.
Always practice good risk management. Always trade with stops and invest only 1-5% of equity on any one trade.
New updates to this analysis are in bold.
The biggest picture, Grand Super Cycle analysis, is here.
Last historic analysis with monthly charts is here. Video is here.
An alternate idea at the monthly chart level is given here at the end of this analysis.
An historic example of a cycle degree fifth wave is given at the end of the analysis here.
MAIN ELLIOTT WAVE COUNT
WEEKLY CHART
Click chart to enlarge.
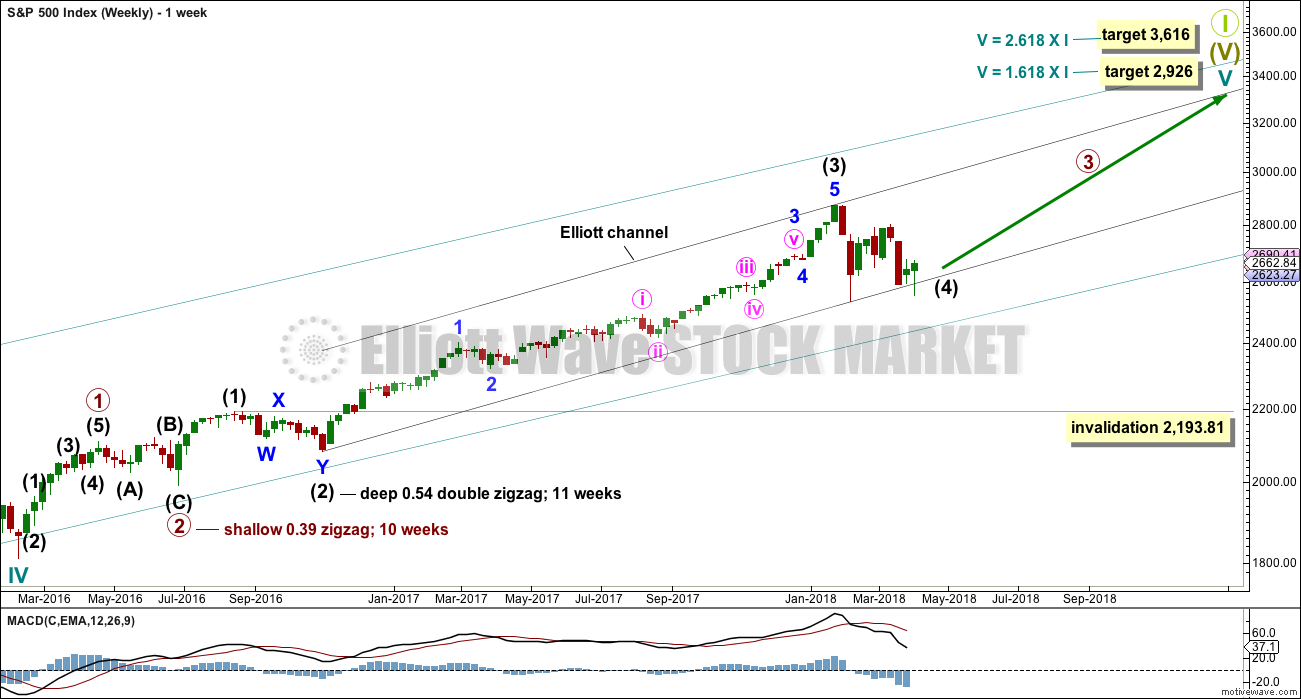
Cycle wave V must complete as a five structure, which should look clear at the weekly chart level. It may only be an impulse or ending diagonal. At this stage, it is clear it is an impulse.
Within cycle wave V, the third waves at all degrees may only subdivide as impulses.
Intermediate wave (4) has breached an Elliott channel drawn using Elliott’s first technique. The channel is redrawn using Elliott’s second technique as if intermediate wave (4) was over at the first swing low within it. If intermediate wave (4) continues sideways, then the channel may be redrawn when it is over. The upper edge may provide resistance for intermediate wave (5).
Intermediate wave (4) may not move into intermediate wave (1) price territory below 2,193.81. However, it would be extremely likely to remain within the wider teal channel (copied over from the monthly chart) if it were to be reasonably deep. This channel contains the entire bull market since the low in March 2009, with only two small overshoots at the end of cycle wave IV. If this channel is breached, then the idea of cycle wave V continuing higher would be discarded well before the invalidation point is breached.
At this stage, it now looks like intermediate wave (4) may be continuing further sideways as a combination, triangle or flat. These three ideas are separated into separate daily charts. All three ideas would see intermediate wave (4) exhibit alternation in structure with the double zigzag of intermediate wave (2).
A double zigzag would also be possible for intermediate wave (4), but because intermediate wave (2) was a double zigzag this is the least likely structure for intermediate wave (4) to be. Alternation should be expected until price proves otherwise.
DAILY CHART – TRIANGLE
Click chart to enlarge.
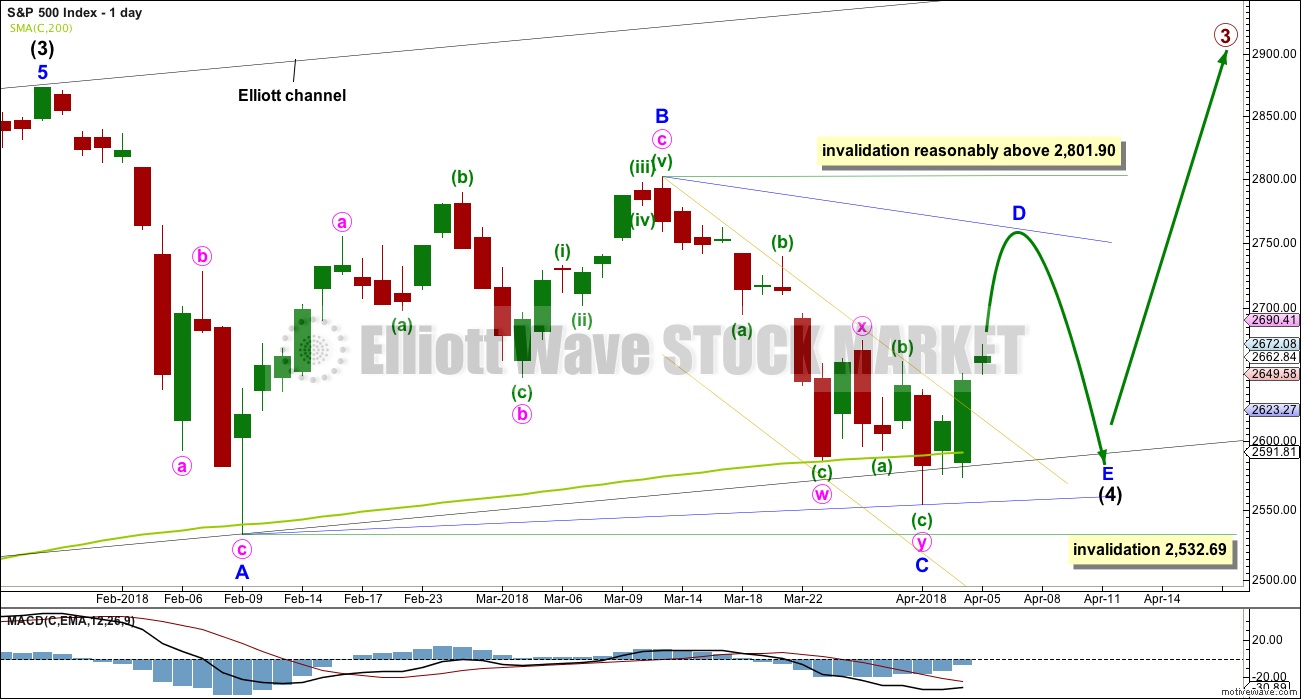
This first daily chart looks at a triangle structure for intermediate wave (4). The triangle may be either a regular contracting or regular barrier triangle. Within the triangle, minor waves A, B and C may be complete.
If intermediate wave (4) is a regular contracting triangle, the most common type, then minor wave D may not move beyond the end of minor wave B above 2,801.90. Minor wave D would be very likely to end about 0.80 to 0.85 the length of minor wave C.
If intermediate wave (4) is a regular barrier triangle, then minor wave D may end about the same level as minor wave B at 2,801.90. As long as the B-D trend line remains essentially flat a triangle will remain valid. In practice, this means the minor wave D can end slightly above 2,801.90 as this rule is subjective.
When a zigzag upwards for minor wave D is complete, then this wave count would expect a final smaller zigzag downwards for minor wave E, which would most likely fall reasonably short of the A-C trend line.
If this all takes a further four weeks to complete, then intermediate wave (4) may total a Fibonacci 13 weeks and would be just two weeks longer in duration than intermediate wave (2). There would be very good proportion between intermediate waves (2) and (4), which would give the wave count the right look.
The lower wick of the candlestick for the 2nd of April overshoots the black channel and the 200 day moving average. This is entirely acceptable for this wave count; the overshoot does not mean price must now continue lower. The A-C trend line for this wave count should have a slope, so minor wave C should now be over.
HOURLY CHART
Click chart to enlarge.
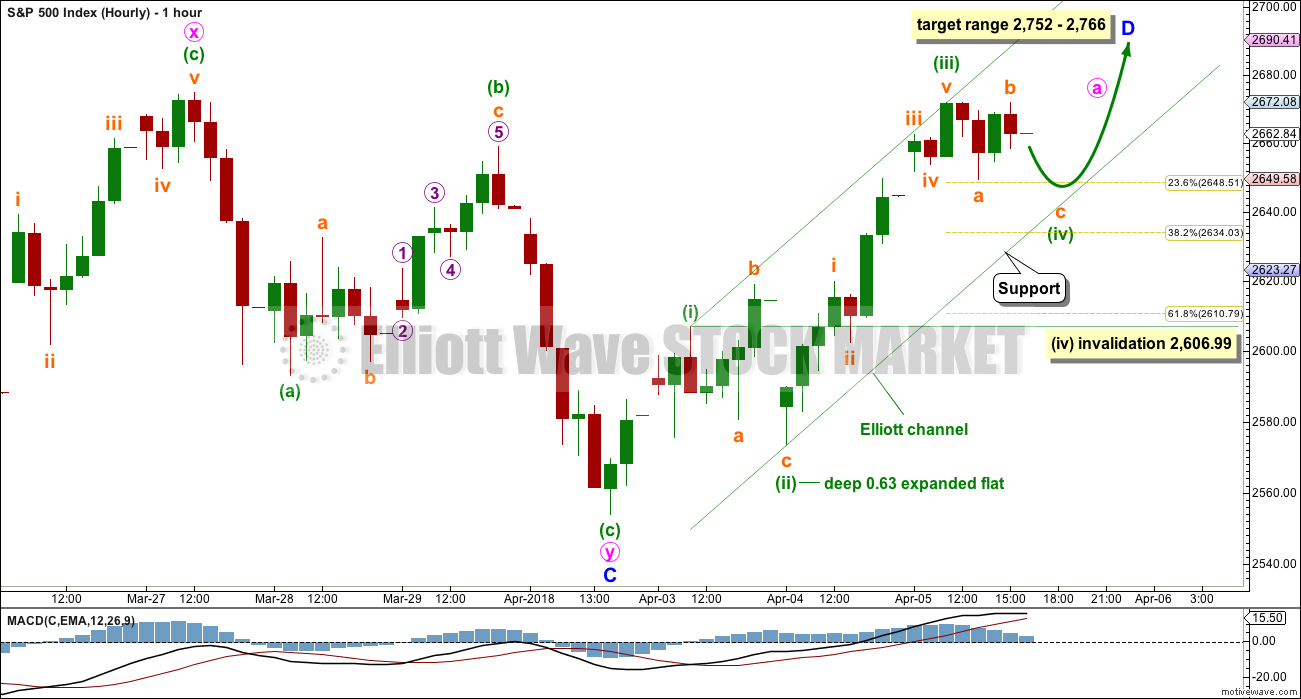
Minor wave D should subdivide as a zigzag, and within the zigzag minute wave b, when it arrives, should show up on the daily chart as one or more red daily candlesticks or doji. This should be a pullback within the upwards swing.
So far, within minor wave D, a five up looks incomplete for minute wave a. Within minute wave a, minuette waves (i), (ii) and now (iii) may be complete. Minuette wave (iii) exhibits no Fibonacci ratio to minuette wave (i). This makes it more likely that minuette wave (v) may exhibit a Fibonacci ratio to either of minuette waves (i) or (iii), and equality in length with minuette wave (i) at 53.19 points would be the most likely.
Minuette wave (iv) may be completing as a zigzag. It may end about the 0.236 Fibonacci ratio at 2,649 or at support at the lower edge of the green Elliott channel. It may complete tomorrow morning and then be followed by upwards movement for minuette wave (v).
Minuette wave (iv) may not move into minuette wave (i) price territory below 2,606.99.
When minute wave a is a complete five wave structure, then a multi day pullback for minute wave b may be expected. When both minute waves a and b are complete, then a smaller target for minute wave c to end minor wave D may be calculated using the Fibonacci ratios between minute waves a and c. That cannot be done yet.
The alternate idea published yesterday, which saw minor wave C continuing lower, has now been invalidated. This offers a little more confidence that an upwards bounce should continue.
DAILY CHART – COMBINATION
Click chart to enlarge.
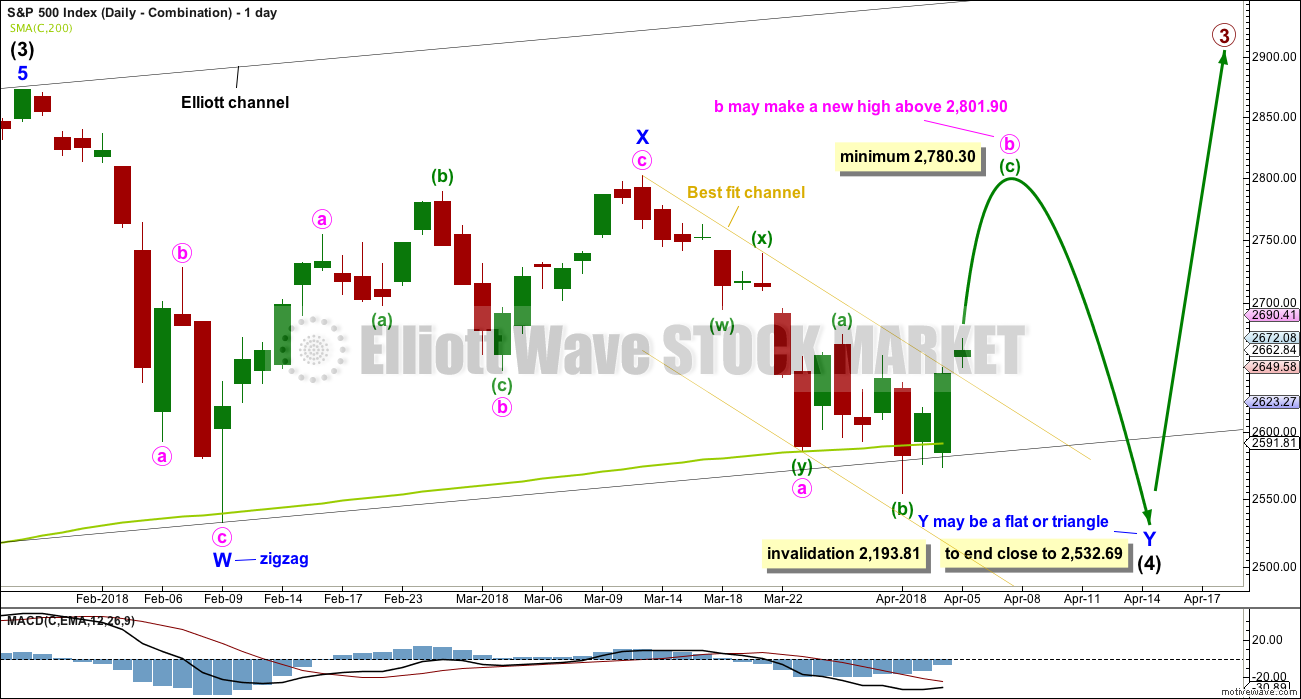
Double combinations are very common structures. The first structure in a possible double combination for intermediate wave (4) would be a complete zigzag labelled minor wave W. The double should be joined by a three in the opposite direction labelled minor wave X, which may be a complete zigzag. X waves within combinations are typically very deep; if minor wave X is over at the last high, then it would be a 0.79 length of minor wave W, which is fairly deep giving it a normal look. There is no minimum nor maximum requirement for X waves within combinations.
The second structure in the double would most likely be a flat correction labelled minor wave Y. It may also be a triangle, but in my experience this is very rare, so it will not be expected. The much more common flat for minor wave Y will be charted and expected.
A flat correction would subdivide 3-3-5. Minute wave a must be a three wave structure, most likely a zigzag. It may also be a double zigzag. On the hourly chart, this is now how this downwards movement fits best, and this will now be how it is labelled.
Minute wave b must now reach a minimum 0.90 length of minute wave a. Minute wave b must be a corrective structure. It may be any corrective structure. It may be unfolding as an expanded flat correction.
The purpose of combinations is to take up time and move price sideways. To achieve this purpose the second structure in the double usually ends close to the same level as the first. Minor wave Y would be expected to end about the same level as minor wave W at 2,532.69. This would require a strong overshoot or breach of the 200 day moving average, which looks unlikely.
DAILY CHART – COMBINATION II
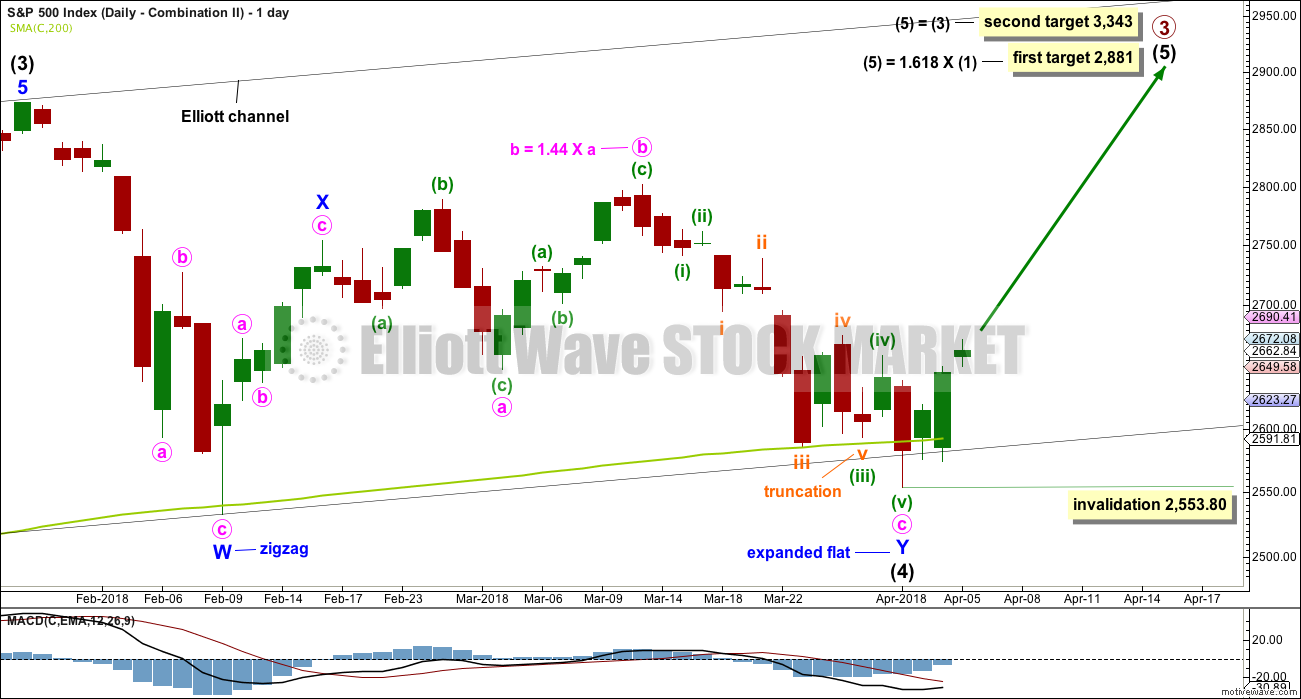
Click chart to enlarge.
This is another way to label the combination.
Minor wave W is still a zigzag labelled in the same way, over at the first low within intermediate wave (4).
The double is joined by a quick three in the opposite direction labelled minor wave X, subdividing as a zigzag.
Minor wave Y may have begun earlier and may now be a complete expanded flat correction. However, in order to see minor wave Y complete there is a truncated fifth wave as noted on the chart. This reduces the probability of this wave count.
If intermediate wave (4) is a complete double combination, then minor wave Y has ended somewhat close to the end of minor wave W; the whole structure would have an overall sideways look to it.
A target is calculated for intermediate wave (5). Within intermediate wave (5), no second wave correction may move beyond the start of its first wave below 2,553.80.
At the hourly chart level, this wave count would expect a five up continuing. The labelling for the short term would be the same as the hourly chart published above for the first wave count.
DAILY CHART – FLAT
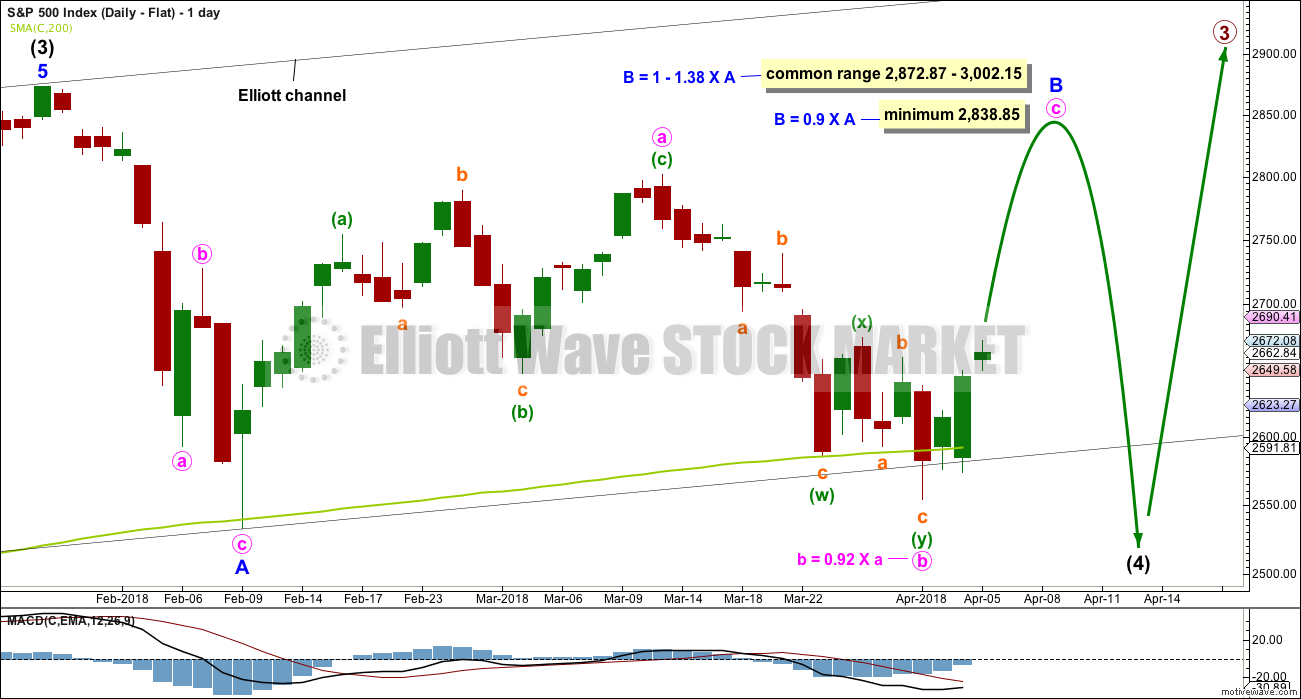
Click chart to enlarge.
Flat corrections are very common. The most common type of flat is an expanded flat. This would see minor wave B move above the start of minor wave A at 2,872.87.
Within a flat correction, minor wave B must retrace a minimum 0.9 length of minor wave A at 2,838.85. The most common length for minor wave B within a flat correction would be 1 to 1.38 times the length of minor wave A at 2,872.87 to 3,002.15. An expanded flat would see minor wave B 1.05 times the length of minor wave A or longer, at 2,889.89 or above.
Minor wave B may be a regular flat correction, and within it minute wave a may have been a single zigzag and minute wave b may have been a double zigzag. This has a very good fit. The subdivisions at the hourly chart level at this stage would be the same for the last wave down as the main wave count.
This wave count would require a very substantial breach of the 200 day moving average for the end of intermediate wave (4). This is possible but may be less likely than a smaller breach.
DAILY CHART – ALTERNATE
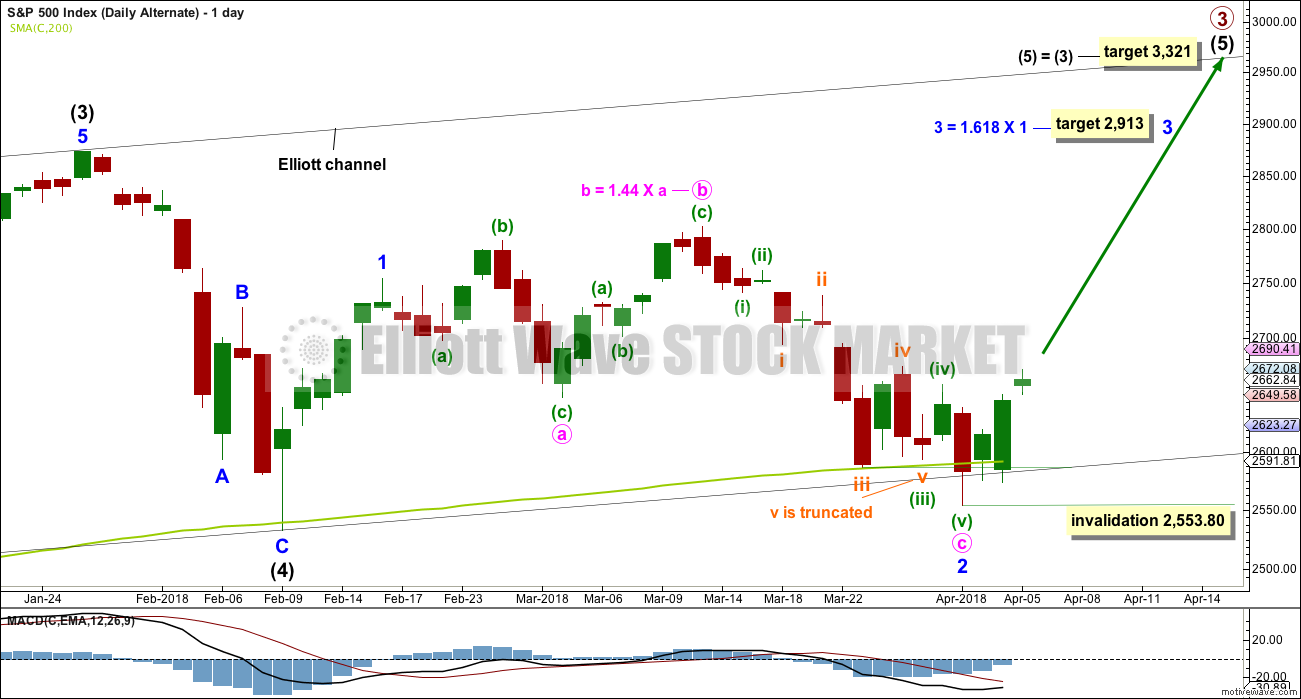
Click chart to enlarge.
It is possible still that intermediate wave (4) was complete as a relatively brief and shallow single zigzag.
A new all time high with support from volume and any one of a bullish signal from On Balance Volume or the AD line would see this alternate wave count become the main wave count.
The target for minor wave 3 expects the most common Fibonacci ratio to minor wave 1.
Within minor wave 2, there is a truncation as noted on the chart. This must necessarily reduce the probability of this wave count.
Within minor wave 3, no second wave correction may move beyond the start of its first wave below 2,553.80.
TECHNICAL ANALYSIS
WEEKLY CHART
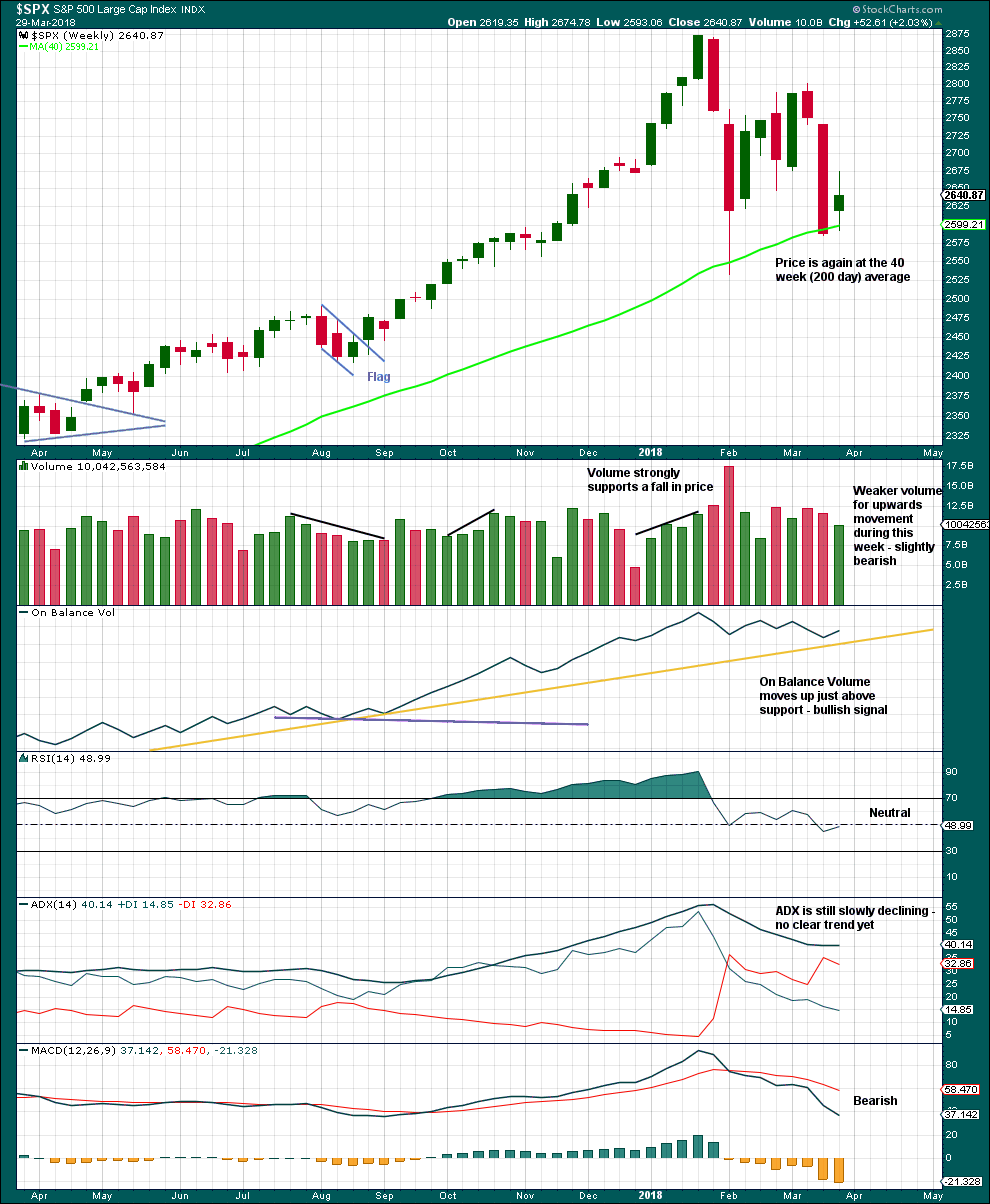
Click chart to enlarge. Chart courtesy of StockCharts.com.
Although volume last week is lighter than last two downwards weeks, this is only of slight concern. Light and declining volume has long been a feature of this bull market. It does not appear to be causing the bull market to be unsustainable, yet.
Give reasonable weight to the bullish signal from On Balance Volume, although it has not perfectly touched the support line.
It is a reasonable approach to expect the 200 day / 40 week moving average to continue to provide strong support while price is above it. Price has overshot the 200 day moving average and now returned above it. If this current week closes back above the average, then it may be expected that this area continues to provide support.
DAILY CHART
Click chart to enlarge. Chart courtesy of StockCharts.com.
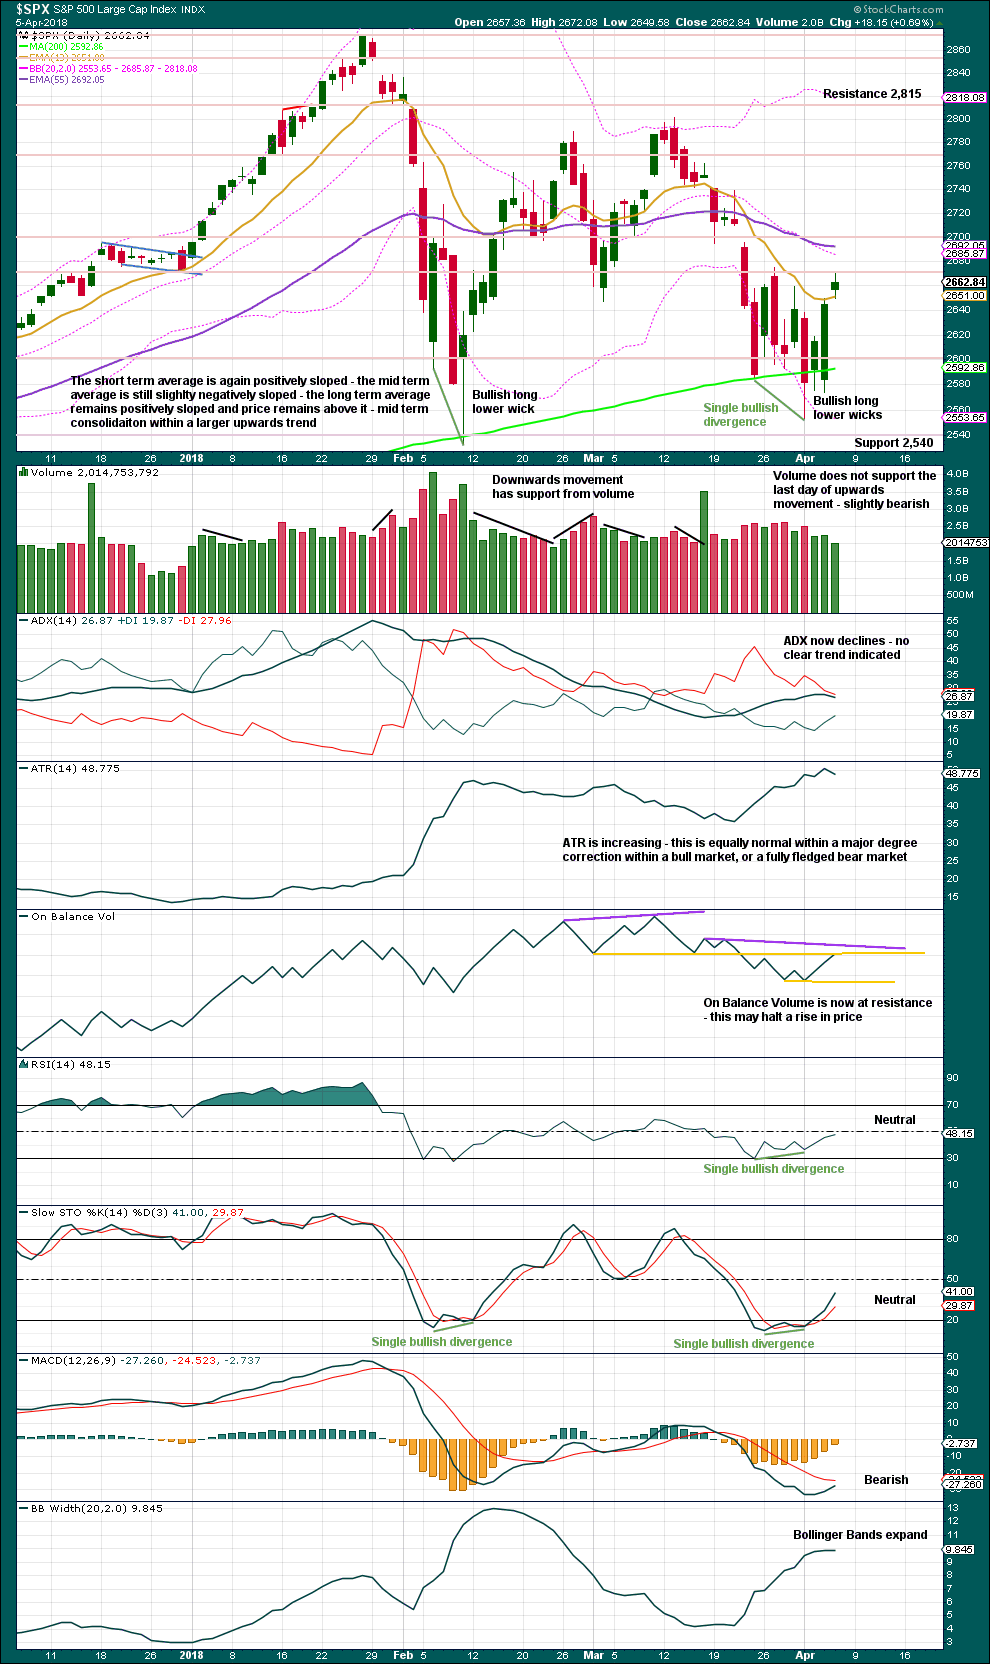
No weight will be given here to the slight decline in volume for upwards movement today. Light and declining volume has been a feature of this bull market for years yet price continues to rise.
Some weight will be given to On Balance Volume at resistance. Look out for a pullback here or very soon within this upwards swing.
VOLATILITY – INVERTED VIX CHART
Click chart to enlarge. Chart courtesy of StockCharts.com.
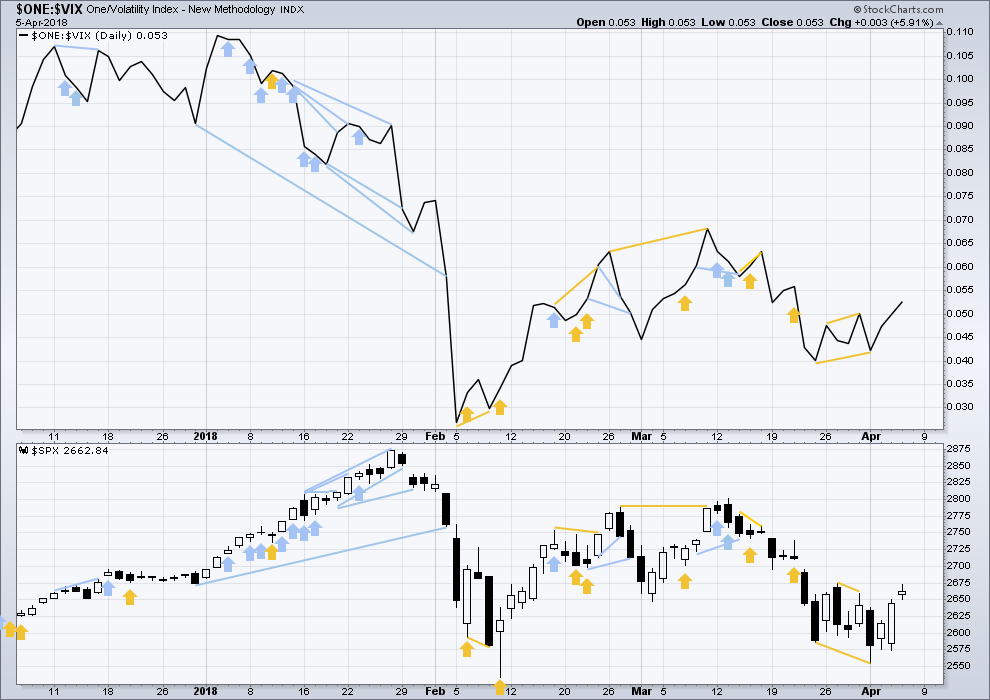
So that colour blind members are included, bearish signals will be noted with blue and bullish signals with yellow.
Normally, volatility should decline as price moves higher and increase as price moves lower. This means that normally inverted VIX should move in the same direction as price.
There is no new divergence today.
BREADTH – AD LINE
Click chart to enlarge. Chart courtesy of StockCharts.com.
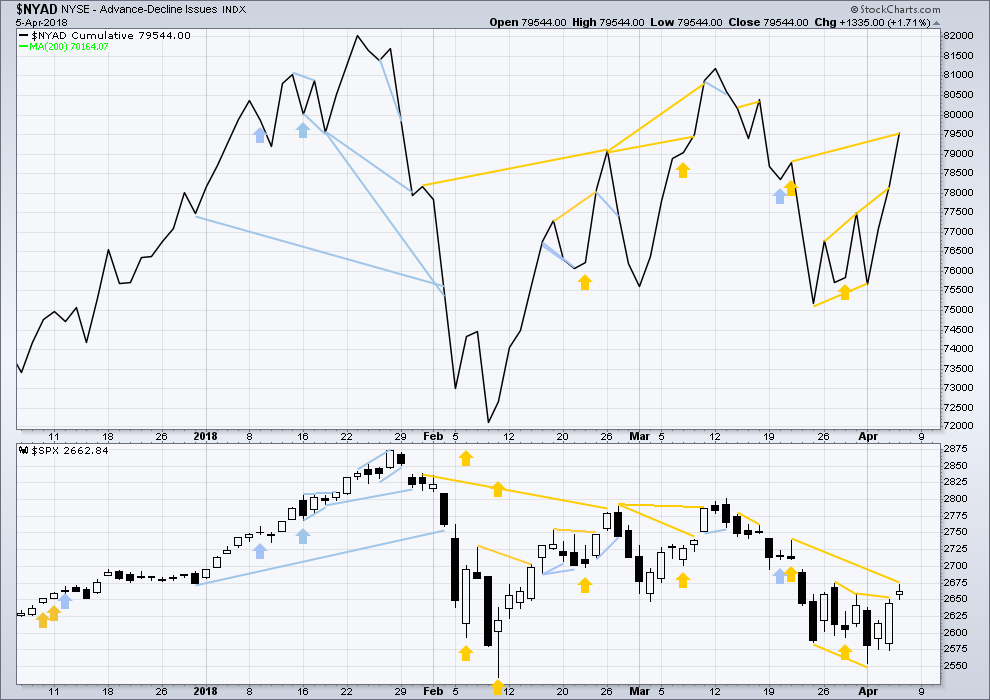
There is normally 4-6 months divergence between price and market breadth prior to a full fledged bear market. This has been so for all major bear markets within the last 90 odd years. With no longer term divergence yet at this point, any decline in price should be expected to be a pullback within an ongoing bull market and not necessarily the start of a bear market.
All of small, mid and large caps last week fell strongly. The fall in price has broad support from market breadth. It was small caps though that had the least decline. This slight divergence indicates some weakness and may be interpreted as slightly bullish.
Breadth should be read as a leading indicator.
Bullish divergence noted in last analysis has been followed by another upwards day. It may be resolved here, or it may need another upwards day to resolve it.
The AD line today has made a new swing high above the prior high of the 21st of March, but price has not. This divergence is another bullish signal and supports the main Elliott wave count.
DOW THEORY
The following lows need to be exceeded for Dow Theory to confirm the end of the bull market and a change to a bear market:
DJIA: 23,360.29.
DJT: 9,806.79.
S&P500: 2,532.69.
Nasdaq: 6,630.67.
Charts showing each prior major swing low used for Dow Theory may be seen at the end of this analysis here.
Published @ 07:45 p.m. EST.
This is the pullback I was warning about, but it has come a day or so earlier than I had expected it to.
Right now the low today so far is at the 200 day MA and the lower black EW trend line (on the daily chart). If it gets lower then the A-C triangle trend line should not be breached if the triangle wave count is correct.
First hourly chart idea:
this pullback I will label minute wave b could be incomplete as a single zigzag
Or it could now be over as a double zigzag
IMO this has a better look and would see a long lower wick today on the 200 day MA.
This is starting to look nasty… down 726 on a Friday.
What will Monday bring?
I have been out of the market (waiting for entry point) hope this isn’t what I have been waiting the last few years for (I am not positioned). Only been trading in & out of AG every few (to several days)days. Currently in AG it and plan to hold it for 1 to 2 months… think it will move much higher once Guidance is updated to include new mine (from Primero purchase) which will close this month.
not sure what to do
Lara’s primary analysis indicates Monday will bring the start of the C wave up.
Maybe I will enter early Monday depending on Lara’s weekend analysis and her confidence in it.
Just for you- know- what and giggles I opened up a SPY 260 strike straddle expiring on Monday. We are again knocking on the 200 day and each tap weakens that support in the absence of any meaningful bounce off it.
Failure to decisively breach it once again led me to get out of Dodge for now.
Man I hate these gargantuan swings in my short term trading account. Oh well. All’s well that ends well! 🙂
I doubt Monday will be a green day. Just due to the fact that China will reciprocate this weekend and global markets likely will react to that… I don’t think the market will plunge like it did today, but it’s going to be a down day me thinks.
A remarkable number of indices found support, albeit possibly temporary, at the 200 day SMA. This is very important. Chances are we will get a bounce from here. The signal that this party is over will be a clean and decisive slice through 200 day SMAs in unison. The banksters are growing weaker in their attempt to prop up the indices. VIX, if it can be relied on, suggests a truly incredible complacency in the market. It is virtually flat-line on triple digit market swings…not good. I think as more traders start to notice predictable failure at down-trend lines, you could get a harmonic oscillation of shorting power that send us through that 200 day on high volume. Look for it. It will be your signal the party is over.
Nice reach of 70.7 back towards 2560 from 2670
I am exiting ALL my short trades at today’s low. It was a crazy ride being whipsawed the last few days but I am out. I don’t like the vol readings. They make no sense. I am on the sidelines for now.
Have a great weekend all!
Its model suggest while not required that we may retest the feb lows.
They base it on the elliott wave theory and some other stuff.
Please share
There is only one possible explanation for why VIX is behaving the way it is.
And that is despite what is being claimed, the short vol trade has NOT been unwound, nowhere near….!!!!!
very likely
Not in the least, we almost caught the top and exiting vix then re-load partial position on the fade at close.
You guys should check out
Scienceinvesting.com
Its free and pretty cool
It actually predicted today from yesterday interesting.
Interesting comments yesterday and today. Lara’s main / preferred count (corrective wave Intermediate 4 triangle) is like having a script. It has been playing out perfectly. I have said it before and I will say it again, trading triangles can be extremely frustrating. This reality is reflected in the comments on this forum. It is often said that the ‘D’ wave of a triangle is the most complex.
Have a great weekend all.
I thought it was the C wave that was typically “complex”? (And it was…)
Right now at the daily level this is nothing more than a 2 after an initial 1 off the recent lows. I should have anticipated that yesterday’s high was probably a completed 5 up, not the top of the a 3, given the symmetric nature of the move, where it stopped, and then the overnight sharp “a” down.
Just another 2.5% down day…the new normal!
Hi Kevin
Where do we go from here?
Do we retest the feb low?
Not if Lara’s primary model is correct. That said, nothing is certain. By monday the US may have attacked mexico, or some other such insanity. So yea, in this political environment, ANYTHING is possible, without a doubt.
Meanwhile, I’m using lara’s primary as my guide, but I’m not going crazy about getting positioned, either.
Whoops, sorry, Ari is correct: this should be the B wave, not a 2.
5 time ?
1 of 5 complete and 2 down in progress, my best take.
Something is VERY WRONG with vol readings in this market.
I refuse to believe traders are THAT stupid.
What is going on?
complacency
Possibly. I suspect the readings are not real….there is complacency, then there is insanity. I am quite curious to see how this resolves for somebody is lying big time…
Quite a few gaps down on current decline. We also have a S&P island reversal gap on 5 hr chart. The central banks are injecting tens of billions into the cash sessions to try and arrest steep market declines. It looks to me like they are using a phenomenal amount of leverage and unwinding after market. This is not normal market behaviour people. Assuming that it is would imho be a big mistake.
A market gap down prior to the close spells serious trouble for the bulls…
Well, focusing in on the important thing…the minuette 4 is still very much alive, and even better, it’s much much closer this morning to the invalidation price, meaning it should be an excellent and relatively low risk buy if you like to use wave structure for stop setting. And if it cracks that invalidation (2607)…time to jump in a barrell and go over the falls with it! Lol!!!
looks like a 5 wave C of the ABC minuette 4 is now in progress. Or the entire bull count is wrong, but it would take a while for that to prove itself out. My best guess is indeed it will bottom soon and a 5 wave up will stutter to life. I’m not excited about trying to take advantage of this sell off at this point. If it keeps pushing deeper there’s a big cluster of fibo support 2624-29.
Exactly.
some folks having a grand time fading every up move. Thinking of perhaps joining that party…while holding longs because the moment I try that, it fails!!! Lol!!!
starting to look like this consolidation area this morning is a 4 in development, and a final 5 down may emerge out of it?
With this choppiness we should consider this is the B wave…
Something very strange is going on with market volatility. I am at a complete loss to explain the dissimilar reactions of SVXY and UVXY to the presumed blow up of the short vol trade. Equally strange, is the relatively subdued response of VIX to market volatility unlike anything we have seen in years. Did the short vol and accompanying risk parity trades really unwind, or do they just want us to believe they have? Be careful out there.
As Kevin has pointed out, you don’t want to leave profits sitting in this market.
Have a great trading day everyone, and please do be very careful…
Take s look at VIX candles on the 5 minute chart….anything peculiar?
The laughable typical excuse for this of OpEx would not apply….
Wow, first…
Thanks Lara, went short overnight and hit the Trump Dump…. lets go long again?
As I said, I won’t be surprised by anything this market throws down right now. Tariffs, interest rates, indictments…no time to be holding long overnight, really. (Everything is Great!) Nice play, assuming the -1.4% I see right now holds up.
Highly doubtful given kudlow and his band of men are waiting in the wings. I want to see how Chinese stock market reacts as they have a serious issue with over inflated equities.
Could be another ramp job after they let the shorts pile up, then unleash the PPT for Market stability or whatevever reasons this executive order was designed. I’m guessing, only guessing this executive order is being abused. If so, it will continue until the press finally figures it out and it is on CNN every night instead of Stormy. My guess is there will be another rally after this but then both the longs and shorts will be very tentative…
Jerry,
The Plunge protection will be leveraged to the max as the optics will be that this threatens the stability of the country or some such thing. China is in a real bind cause the more they drag this, they higher the chances of them loosing markets to other south asian countries. Don’t forget all of them are hungry for the mighty US Dollar. Next, I am expecting to see mad panic in Chinese stock market.
Other than the executive order I’ve seen that reagen put into play to stabilize the market with a working group, (PPT) I haven’t seen any actual info coming out from the government on how this group stabilizes the market. If there is actual data and anyone knows how to track it I’d love to hear about it.
that “group” was in the 1980’s. Suffice to say, as a formal entity, it is long since deceased. Separate from the question (claims) that coordinated central bank buying occurs; maybe/probably? I don’t know and don’t care. But a gov’t sponser “ppt” left over from the reagan era? No.