
Lara’s Weekly is an end of week Elliott Wave and Technical Analysis of the S&P 500, GOLD, and USOIL that focuses on the mid-to-long-term picture. This analysis service is designed for investors and swing traders.
Lara’s Weekly is at this time available to the general public, but in the near future it will be available by subscription only. I will be offering a once only awesome Grandfather rate to the earliest subscribers when Lara’s Weekly is launched as a paid subscription service. To make sure you don’t miss out and not get the Grandfather rate, be notified: click on the Notify Me button below:

S&P 500
The main wave count expected upwards movement, which is exactly how the short trading week has ended. The target remains the same.
Summary: The target for upwards movement is now 2,737. A new high above 2,674.78 would add confidence in an upwards swing. A bullish signal today from the both AD line and inverted VIX supports this. Price has again bounced up off support at both a trend line and the 200 day moving average. Expect support to hold until it is breached.
A new low below 2,585.89 would indicate downwards movement has one more low before it is done, and the target would be at 2,561 or 2,521. Bearish On Balance Volume supports this view.
Always practice good risk management. Always trade with stops and invest only 1-5% of equity on any one trade.
The biggest picture, Grand Super Cycle analysis, is here.
Last historic analysis with monthly charts is here. Video is here.
An alternate idea at the monthly chart level is given here at the end of this analysis.
An historic example of a cycle degree fifth wave is given at the end of the analysis here.
MAIN ELLIOTT WAVE COUNT
WEEKLY CHART
Click chart to enlarge.
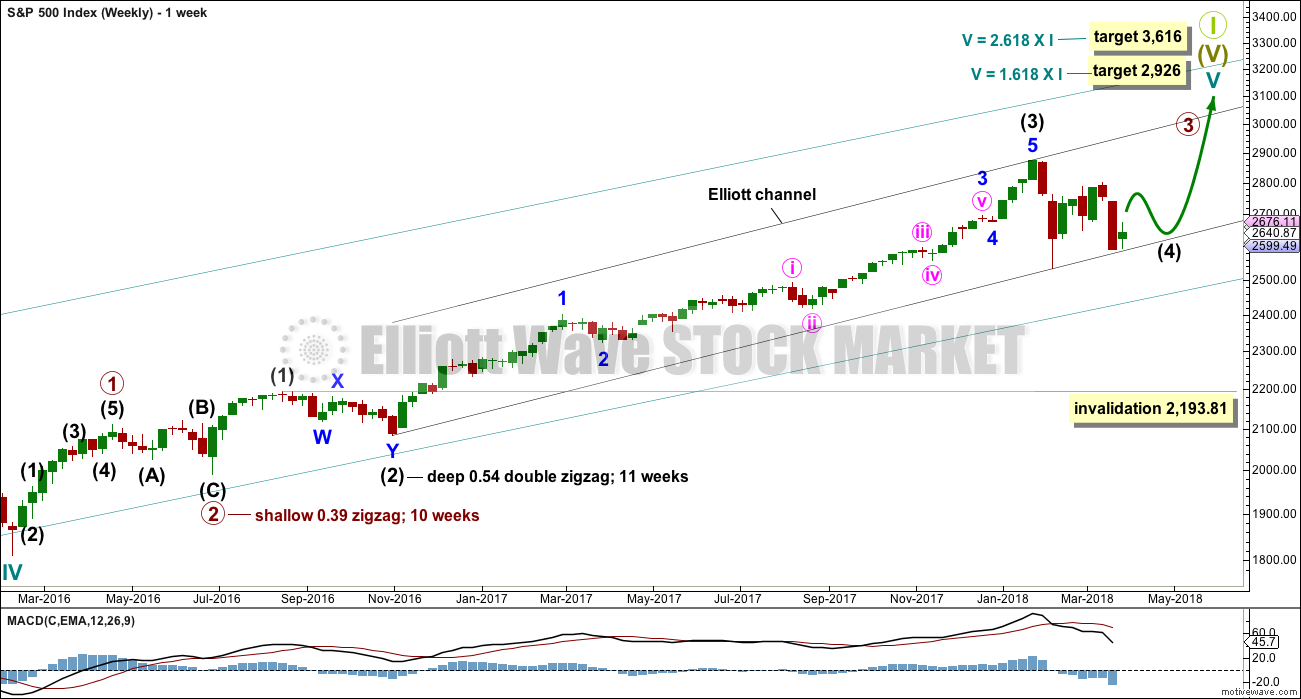
Cycle wave V must complete as a five structure, which should look clear at the weekly chart level. It may only be an impulse or ending diagonal. At this stage, it is clear it is an impulse.
Within cycle wave V, the third waves at all degrees may only subdivide as impulses.
Intermediate wave (4) has breached an Elliott channel drawn using Elliott’s first technique. The channel is redrawn using Elliott’s second technique as if intermediate wave (4) was over at the first swing low within it. If intermediate wave (4) continues sideways, then the channel may be redrawn when it is over. The upper edge may provide resistance for intermediate wave (5).
Intermediate wave (4) may not move into intermediate wave (1) price territory below 2,193.81. However, it would be extremely likely to remain within the wider teal channel (copied over from the monthly chart) if it were to be reasonably deep. This channel contains the entire bull market since the low in March 2009, with only two small overshoots at the end of cycle wave IV. If this channel is breached, then the idea of cycle wave V continuing higher would be discarded well before the invalidation point is breached.
At this stage, it now looks like intermediate wave (4) may be continuing further sideways as a combination, triangle or flat. These three ideas are separated into separate daily charts. All three ideas would see intermediate wave (4) exhibit alternation in structure with the double zigzag of intermediate wave (2).
A double zigzag would also be possible for intermediate wave (4), but because intermediate wave (2) was a double zigzag this is the least likely structure for intermediate wave (4) to be. Alternation should be expected until price proves otherwise.
DAILY CHART – TRIANGLE
Click chart to enlarge.
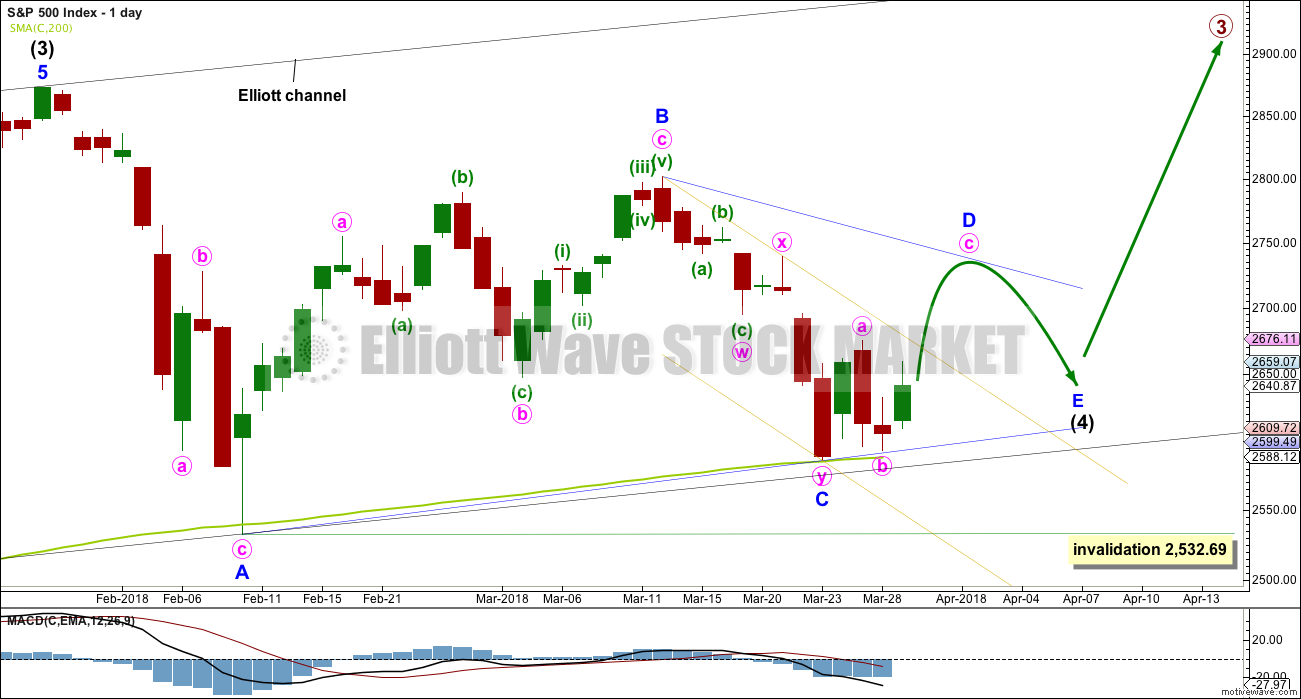
This first daily chart looks at a triangle structure for intermediate wave (4). The triangle may be either a regular contracting or regular barrier triangle. Within the triangle, minor waves A, B and now C may be complete.
If intermediate wave (4) is a regular contracting triangle, the most common type, then minor wave D may not move beyond the end of minor wave B above 2,801.90. Minor wave D would be very likely to end about 0.80 to 0.85 the length of minor wave C.
If intermediate wave (4) is a regular barrier triangle, then minor wave D may end about the same level as minor wave B at 2,801.90. As long as the B-D trend line remains essentially flat a triangle will remain valid. In practice, this means the minor wave D can end slightly above 2,801.90 as this rule is subjective.
When a zigzag upwards for minor wave D is complete, then this wave count would expect a final smaller zigzag downwards for minor wave E, which would most likely fall reasonably short of the A-C trend line.
If this all takes a further four weeks to complete, then intermediate wave (4) may total a Fibonacci 13 weeks and would be just two weeks longer in duration than intermediate wave (2). There would be very good proportion between intermediate waves (2) and (4), which would give the wave count the right look.
The low yesterday has found support right on the A-C trend line. Triangles normally adhere well to their trend lines, and it is common for the trend lines to be tested within triangle sub-waves. This has a typical look.
It is possible that minor wave C is over as per the labelling on this daily chart and the first hourly chart below, but it is also possible that it could continue lower. An alternate hourly chart covers that possibility.
The best fit channel about minor wave C is redrawn to be as conservative as possible. It is copied over to the alternate hourly chart below.
HOURLY CHART
Click chart to enlarge.
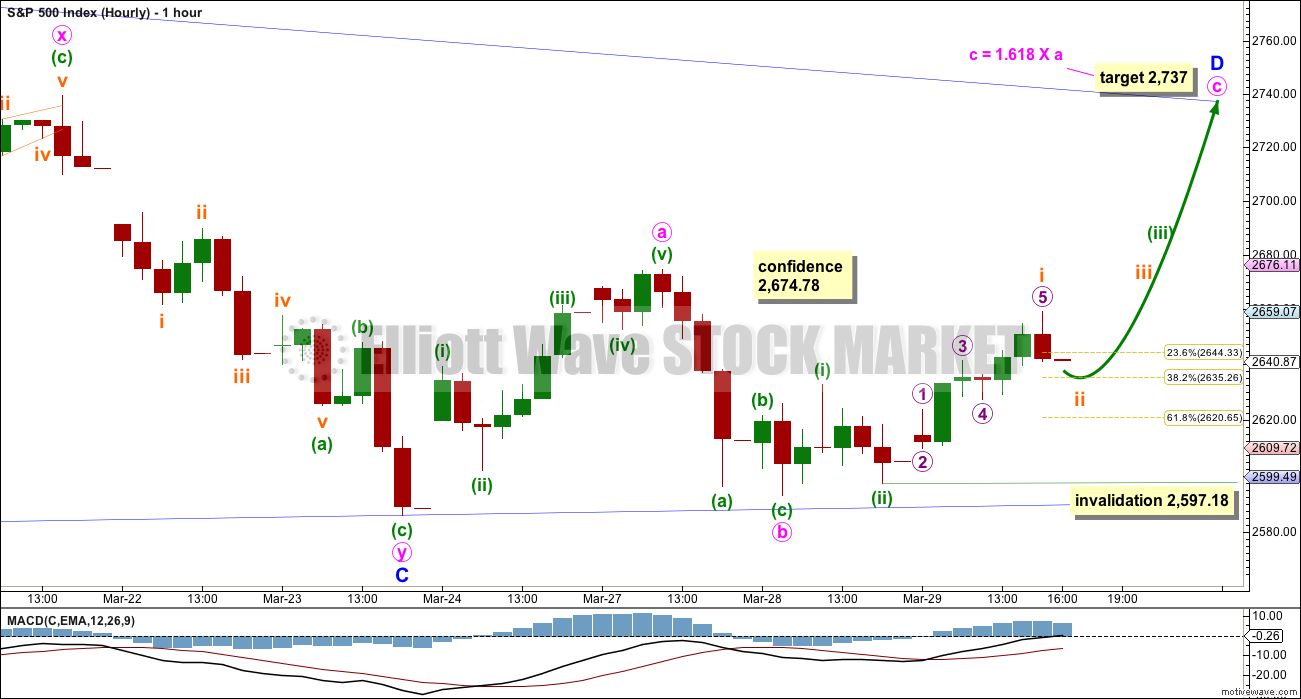
Minor wave D within a triangle should subdivide into a simple A-B-C corrective structure, most likely a simple zigzag.
Some confidence in this wave count at the hourly chart level may be had if price makes a new high above 2,674.78.
Minute wave c must subdivide as a five wave structure. Because upwards movement for Thursday does not have support from volume it looks unlikely that minuette wave (iii) was over at Friday’s high. Minuette wave (iii) may be incomplete. It should be expected to exhibit an increase in upwards momentum and have some support from volume.
Within minuette wave (iii), subminuette wave i may be over at Thursday’s high. Subminuette wave ii may be more brief and shallow than a typical second wave due to an upwards pull from the middle of a third wave. Subminuette wave ii may not move beyond the start of subminuette wave i below 2,597.18.
Price has found support now three times at the A-C trend line. If this wave count is correct, then support there should hold.
ALTERNATE HOURLY CHART
Click chart to enlarge.
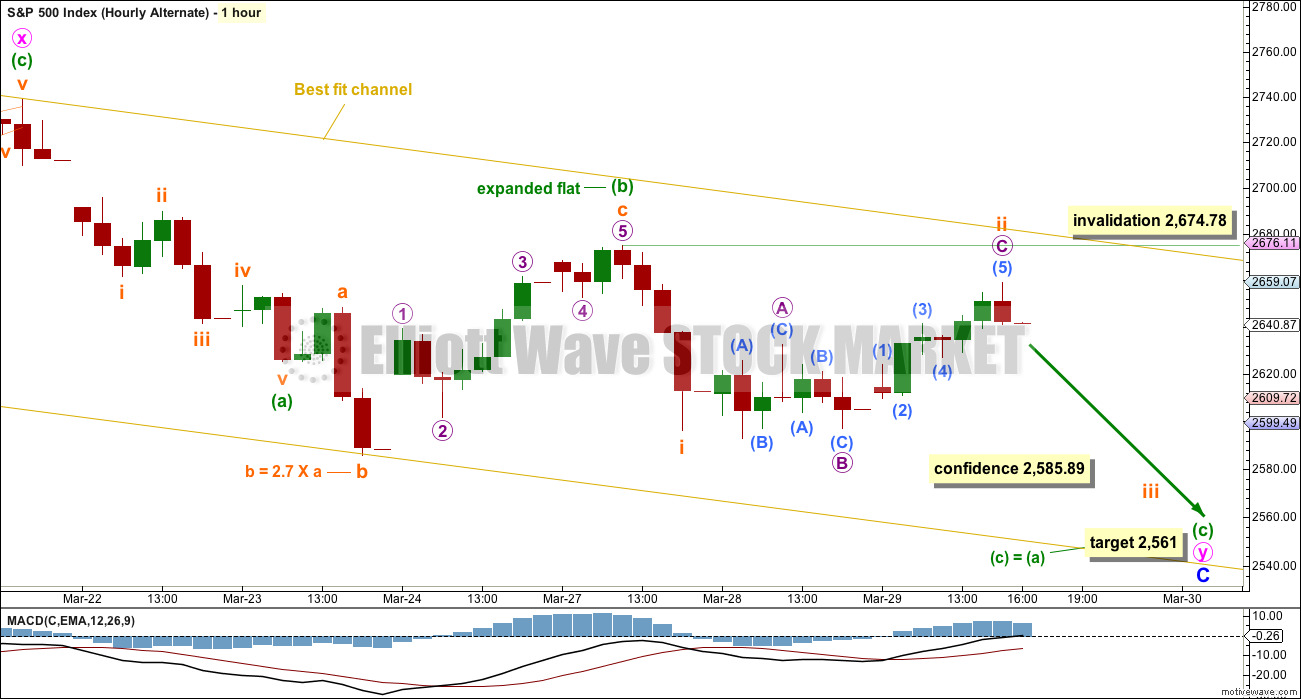
It is also possible that the second zigzag in the double for minor wave C is incomplete.
If the zigzag of minute wave y is continuing, then within it minuette wave (b) must be seen as an expanded flat correction (all subdivisions will fit at the five minute chart level). The problem here though is the length of subminuette wave b within the expanded flat. While there is no rule stating a limit for B waves within flats, there is a convention that states when the B wave is more than twice the length of the A wave the probability of a flat is extremely low. I have seen a few expanded flats where wave B is longer than twice the length of wave A, but they are uncommon.
The probability of this wave count would be reduced for this reason.
Now the size in both depth and duration of subminuette wave ii further reduces the probability of this wave count. It no longer has reasonable looking proportions.
Subminuette wave ii may not move beyond the start of subminuette wave i above 2,674.78.
If price makes a new low below 2,585.89, then the target for the triangle wave count would be at 2,561. This would expect the most common Fibonacci ratio between minuette waves (a) and (c).
DAILY CHART – COMBINATION
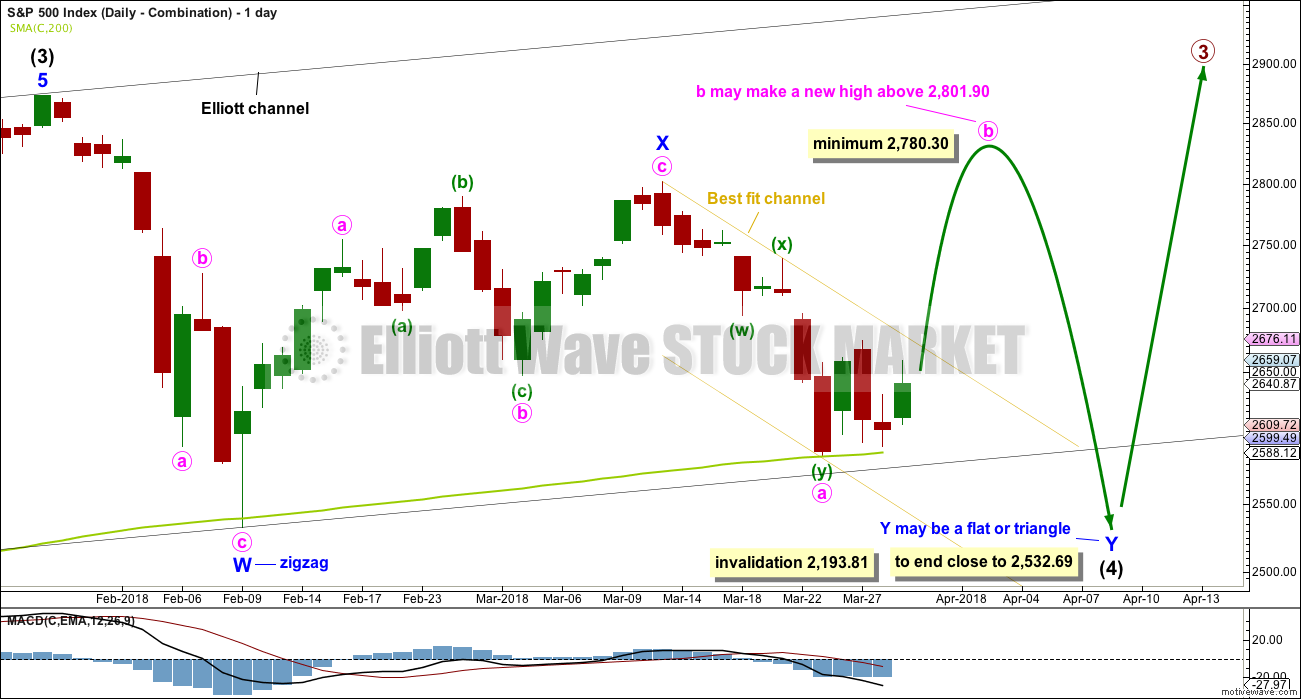
Click chart to enlarge.
Double combinations are very common structures. The first structure in a possible double combination for intermediate wave (4) would be a complete zigzag labelled minor wave W. The double should be joined by a three in the opposite direction labelled minor wave X, which may be a complete zigzag. X waves within combinations are typically very deep; if minor wave X is over at the last high, then it would be a 0.79 length of minor wave W, which is fairly deep giving it a normal look. There is no minimum nor maximum requirement for X waves within combinations.
The second structure in the double would most likely be a flat correction labelled minor wave Y. It may also be a triangle, but in my experience this is very rare, so it will not be expected. The much more common flat for minor wave Y will be charted and expected.
A flat correction would subdivide 3-3-5. Minute wave a must be a three wave structure, most likely a zigzag. It may also be a double zigzag. On the hourly chart, this is now how this downwards movement fits best, and this will now be how it is labelled.
Minute wave b must now reach a minimum 0.90 length of minute wave a. Minute wave b must be a corrective structure. It may be any corrective structure.
The purpose of combinations is to take up time and move price sideways. To achieve this purpose the second structure in the double usually ends close to the same level as the first. Minor wave Y would be expected to end about the same level as minor wave W at 2,532.69. This would require a strong overshoot or breach of the 200 day moving average, which looks unlikely.
DAILY CHART – COMBINATION II
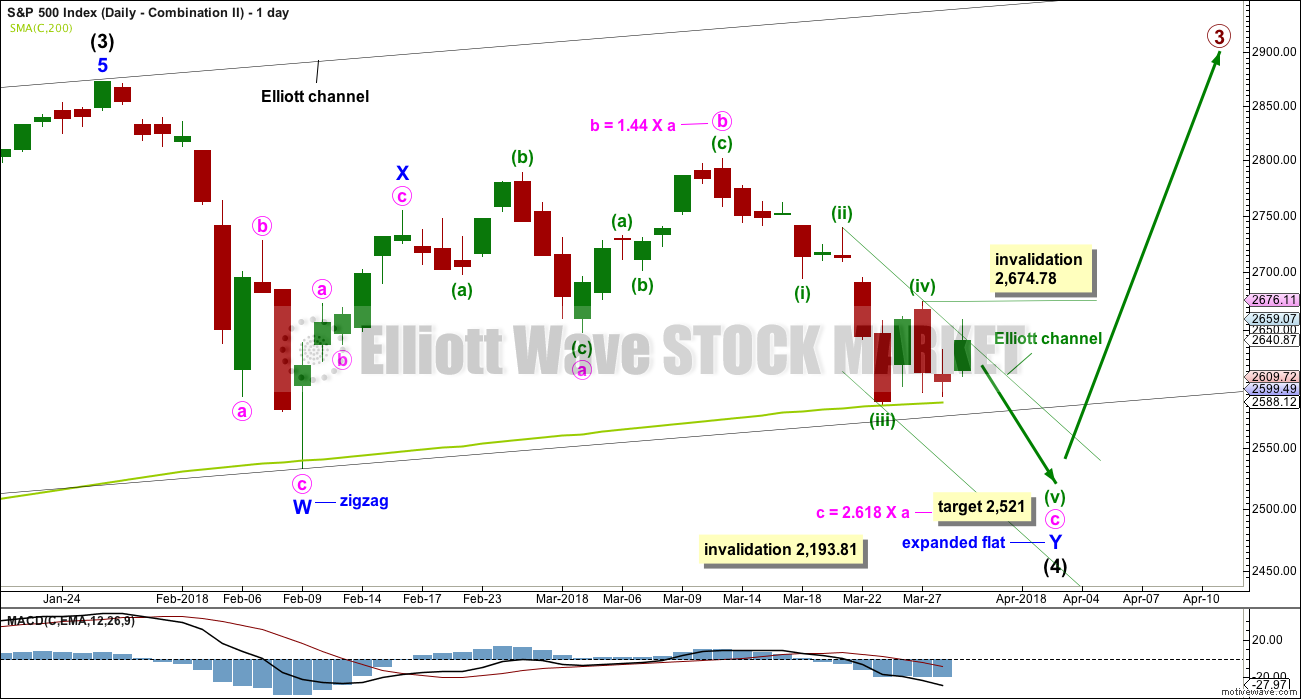
Click chart to enlarge.
This is another way to label the combination.
Minor wave W is still a zigzag labelled in the same way, over at the first low within intermediate wave (4).
The double is joined by a quick three in the opposite direction labelled minor wave X, subdividing as a zigzag.
Minor wave Y may have begun earlier and may be an almost complete expanded flat correction, and within it minute wave a is a three, itself an expanded flat. Minute wave b is a zigzag and only slightly longer than the most common length of up to 1.38 times the length of minute wave a. Minute wave c downwards must be a five wave structure. It may need a final fifth wave to complete it.
Within minuette wave (v), no second wave correction may move beyond its start above 2,674.78.
The target would see minor wave Y end only slightly below the end of minor wave W. The whole structure for the double combination would move sideways. This wave count would also require a substantial breach of the 200 day moving average (at this point about 68 points). This looks unlikely but is discussed as a possibility in the classic technical analysis section below.
HOURLY CHART – COMBINATION II
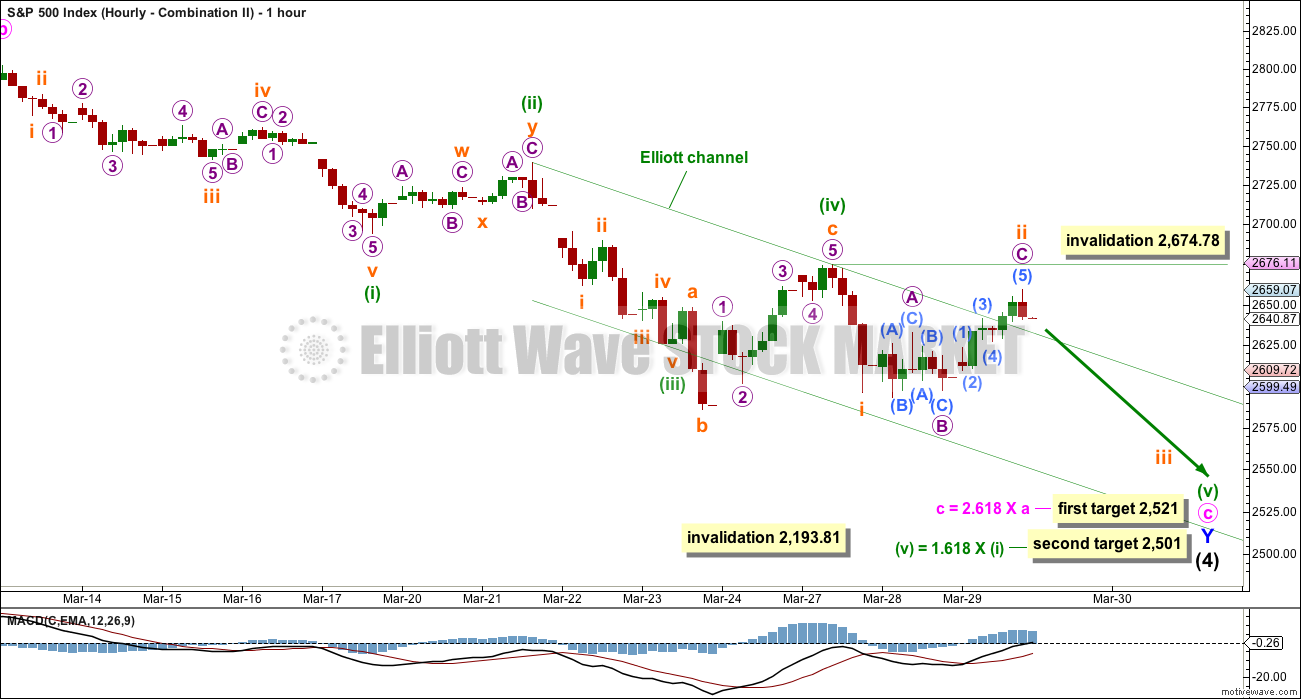
Click chart to enlarge.
The Elliott channel is drawn using Elliott’s second technique for an impulse. If an impulse downwards is incomplete, then within minuette wave (v) upwards corrections should find strong resistance at the upper edge of the channel. That channel should not be breached.
The fact that the end of Thursday’s session has breached the channel indicates this wave count may be wrong. It has substantially reduced in probability.
If subminuette wave ii continues higher, it may not move beyond the start of subminuette wave i above 2,674.78.
DAILY CHART – FLAT
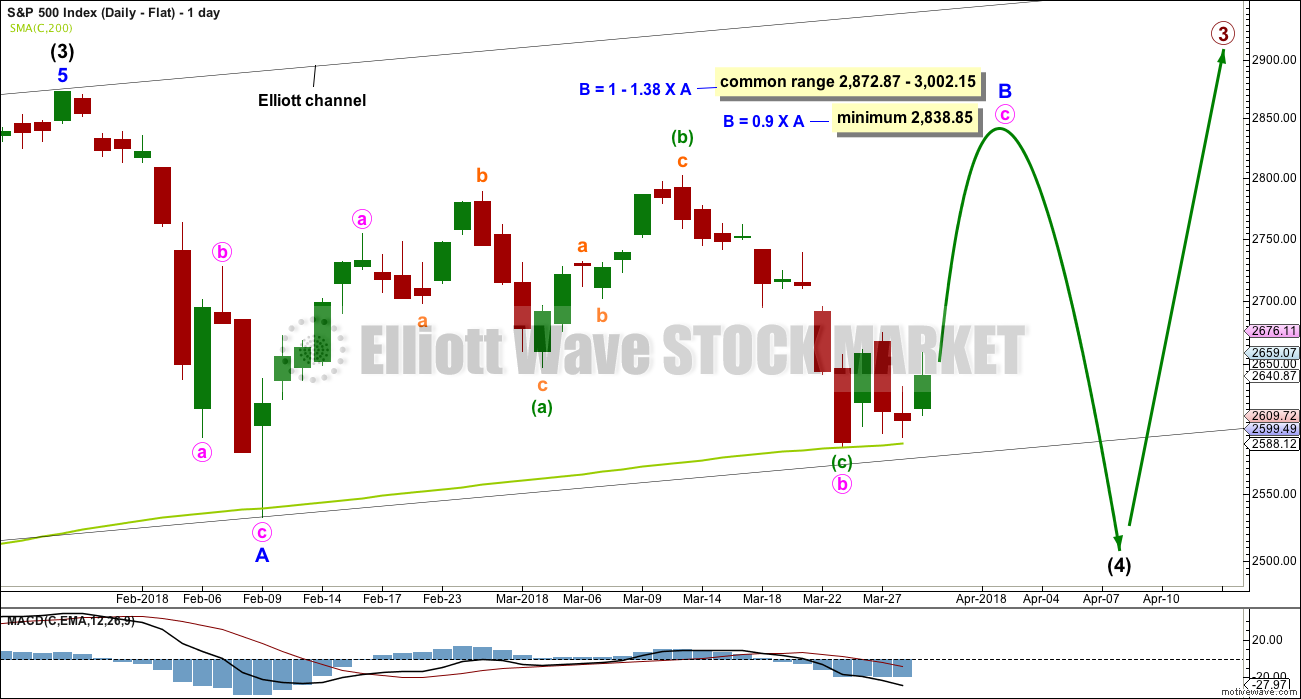
Click chart to enlarge.
Flat corrections are very common. The most common type of flat is an expanded flat. This would see minor wave B move above the start of minor wave A at 2,872.87.
Within a flat correction, minor wave B must retrace a minimum 0.9 length of minor wave A at 2,838.85. The most common length for minor wave B within a flat correction would be 1 to 1.38 times the length of minor wave A at 2,872.87 to 3,002.15. An expanded flat would see minor wave B 1.05 times the length of minor wave A or longer, at 2,889.89 or above.
Minor wave B may be an incomplete zigzag, and within it minute wave c upwards must now subdivide as a five wave structure. How high minor wave B goes would indicate for this wave count what type of flat correction may be unfolding for intermediate wave (4).
It is also possible for this wave count that minute wave b may not be complete and may move lower.
When minor wave B is a complete corrective structure ending at or above the minimum requirement, then minor wave C downwards would be expected to make a new low below the end of minor wave A at 2,532.69 to avoid a truncation.
This wave count would require a very substantial breach of the 200 day moving average for the end of intermediate wave (4). This is possible but may be less likely than a smaller breach. Support at the 200 day average at this stage continues to hold and should be expected to do so until price breaks it.
DAILY CHART – ALTERNATE
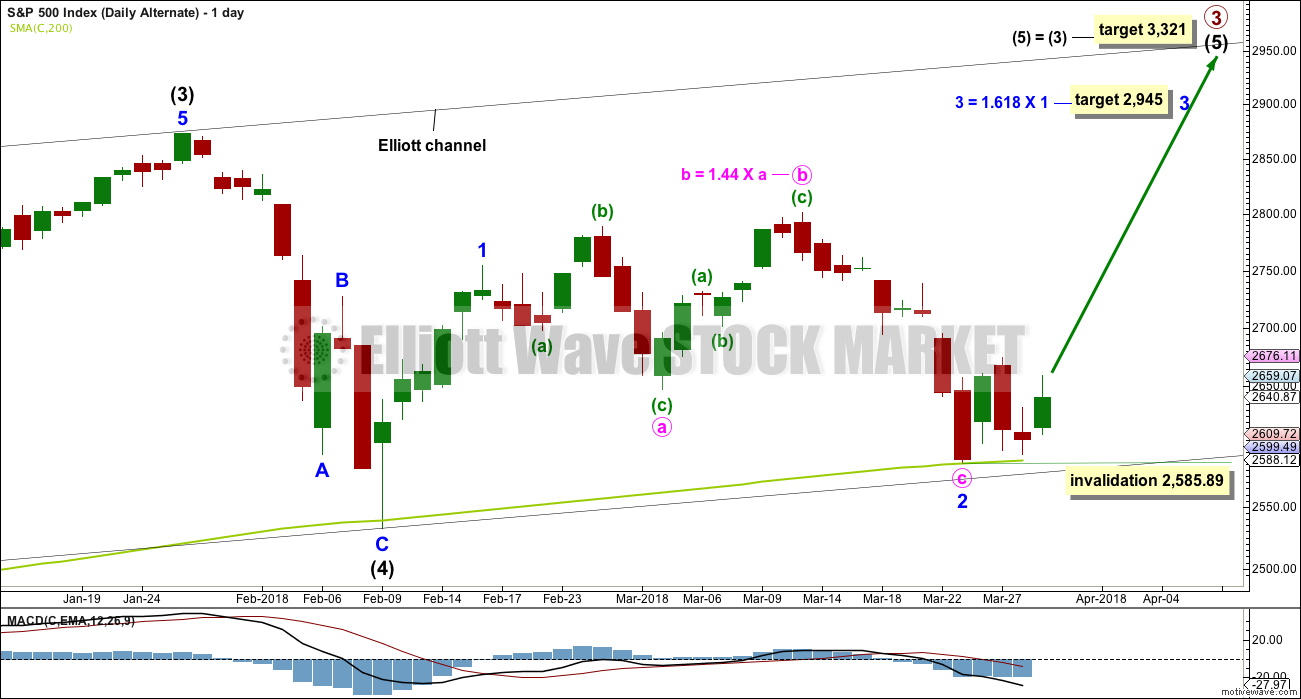
Click chart to enlarge.
It is possible still that intermediate wave (4) was complete as a relatively brief and shallow single zigzag.
A new all time high with support from volume and any one of a bullish signal from On Balance Volume or the AD line would see this alternate wave count become the main wave count.
The target for minor wave 3 expects the most common Fibonacci ratio to minor wave 1.
It now looks more likely that for this alternate wave count minor wave 2 should be over. Within minor wave 3, no second wave correction may move beyond the start of its first wave below 2,585.89.
TECHNICAL ANALYSIS
WEEKLY CHART
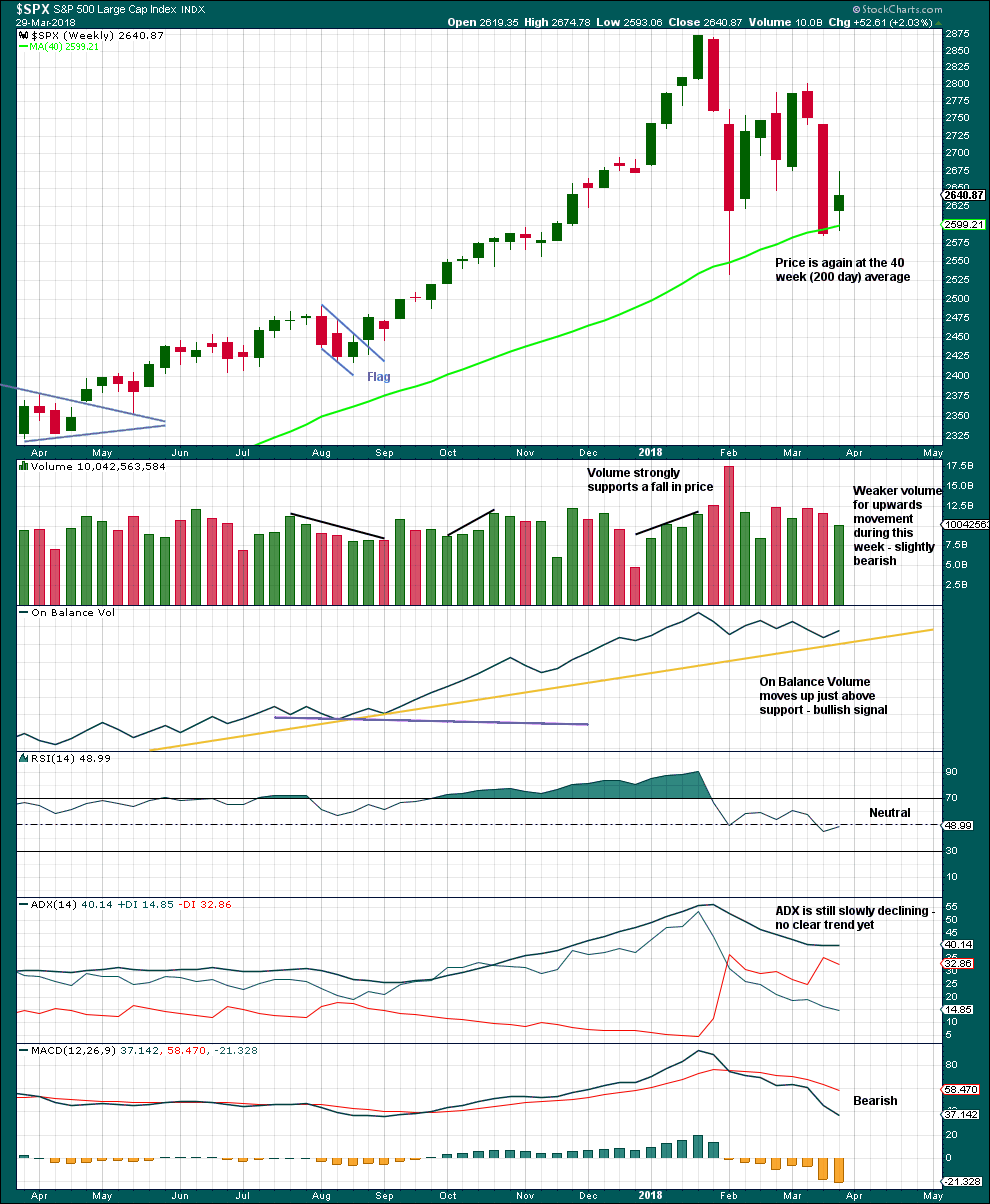
Click chart to enlarge. Chart courtesy of StockCharts.com.
Although volume this week is lighter than last two downwards weeks, this is only of slight concern. Light and declining volume has long been a feature of this bull market. It does not appear to be causing the bull market to be unsustainable, yet.
Give reasonable weight to the bullish signal from On Balance Volume, although it has not perfectly touched the support line.
It is a reasonable approach to expect the 200 day / 40 week moving average to continue to provide strong support while price is above it.
DAILY CHART
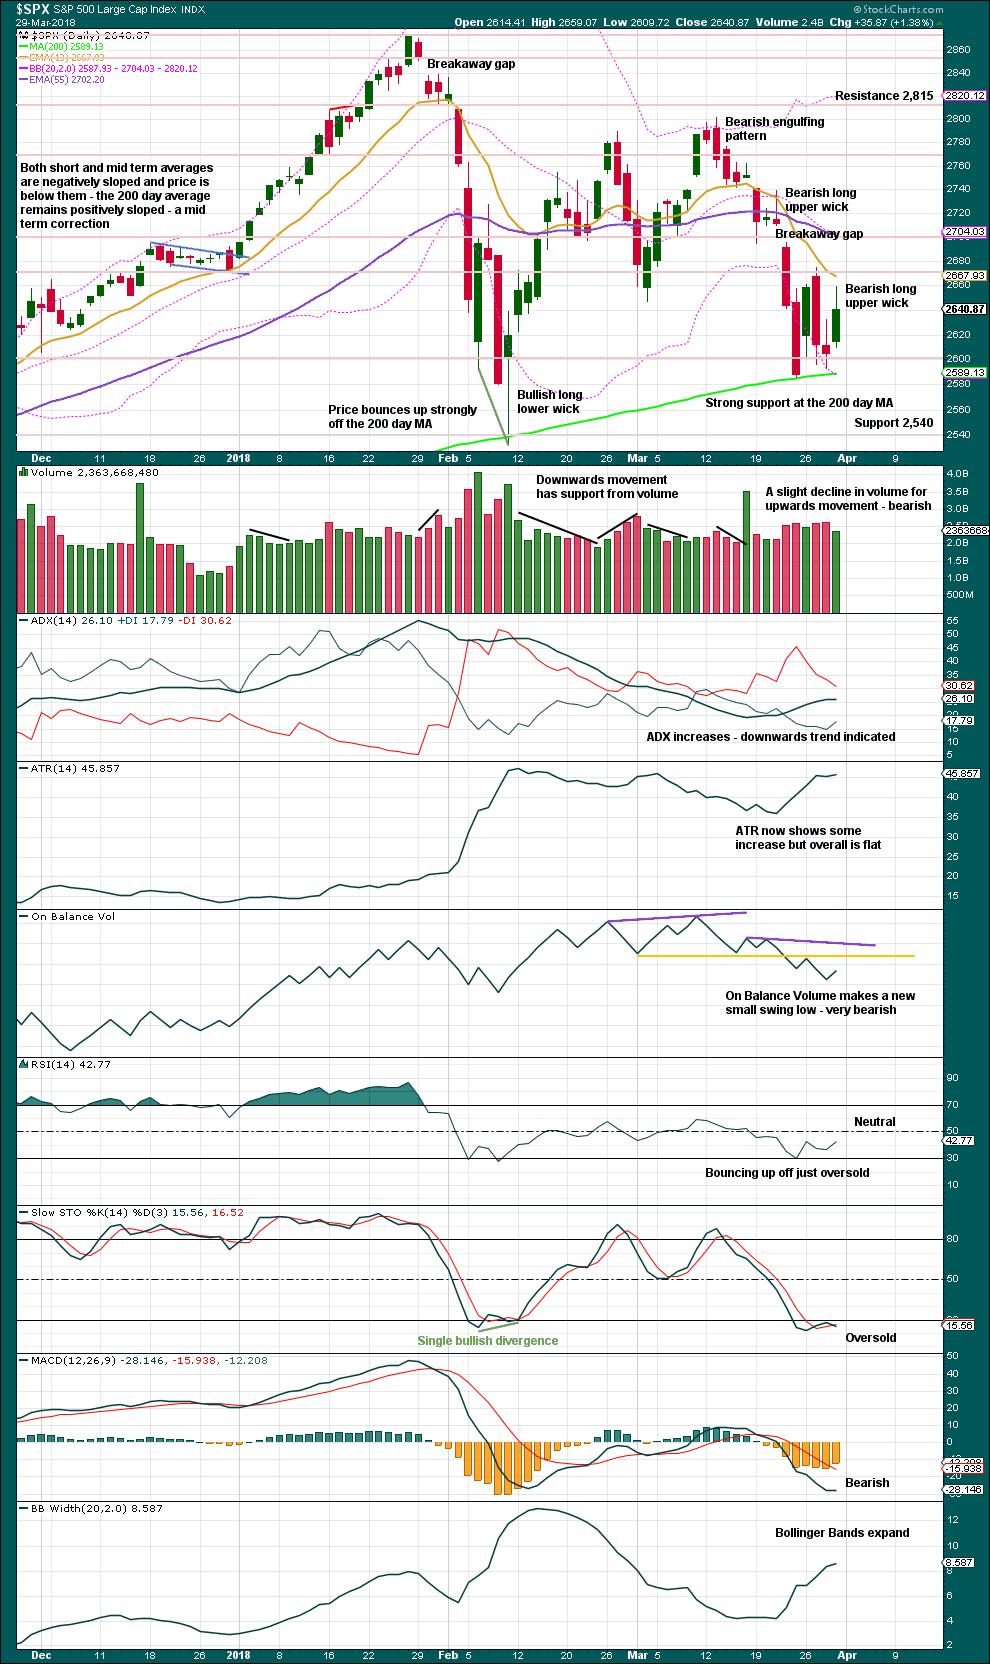
Click chart to enlarge. Chart courtesy of StockCharts.com.
Look out for resistance at the breakaway gap at 2,709.79. The yellow line on On Balance Volume may also provide resistance, but it allows for some more upwards movement first.
Lighter volume for Thursday with a long upper candlestick wick suggest a pullback on Monday may unfold. There is support just below about 2,600.
VOLATILITY – INVERTED VIX CHART
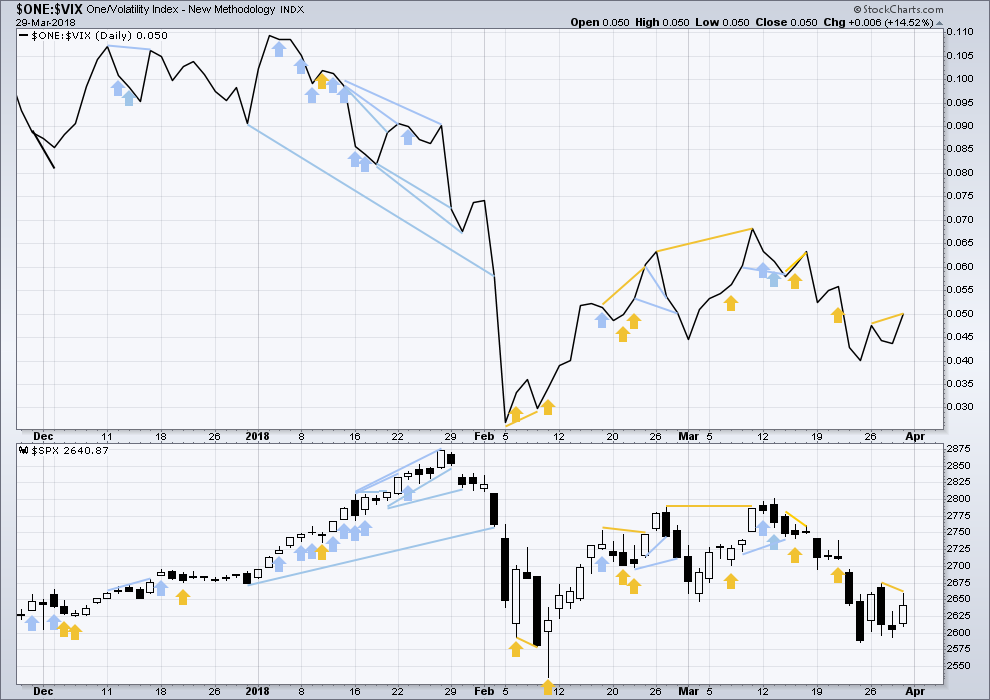
Click chart to enlarge. Chart courtesy of StockCharts.com.
So that colour blind members are included, bearish signals will be noted with blue and bullish signals with yellow.
Normally, volatility should decline as price moves higher and increase as price moves lower. This means that normally inverted VIX should move in the same direction as price.
Thursday’s new small swing high has made a new high in inverted VIX but not yet in price. This divergence is read as bullish, if inverted VIX is a leading indicator.
BREADTH – AD LINE
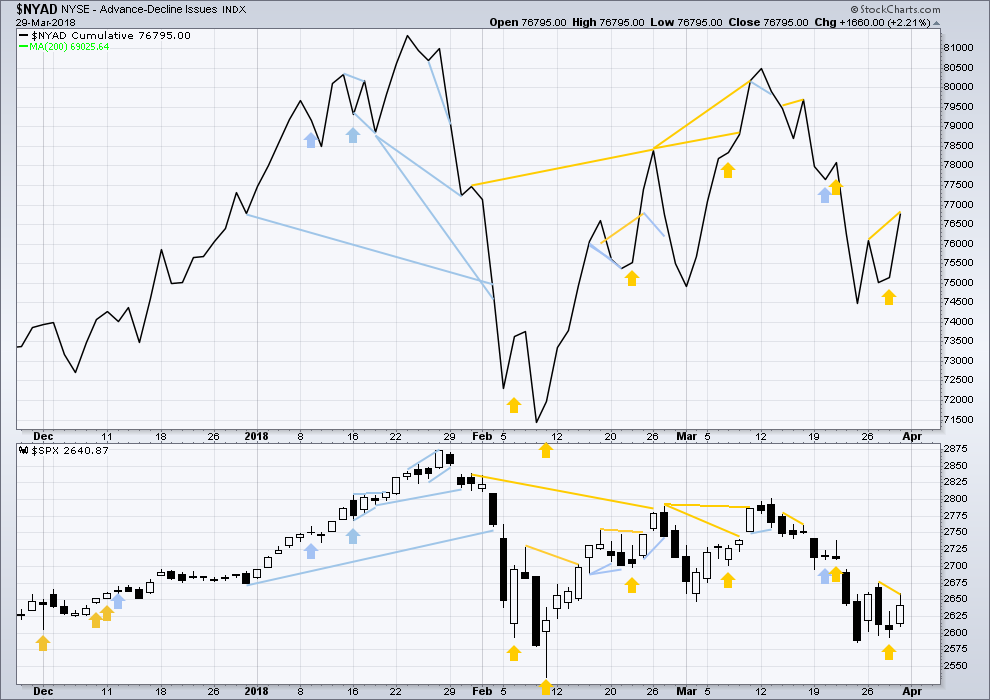
Click chart to enlarge. Chart courtesy of StockCharts.com.
There is normally 4-6 months divergence between price and market breadth prior to a full fledged bear market. This has been so for all major bear markets within the last 90 odd years. With no longer term divergence yet at this point, any decline in price should be expected to be a pullback within an ongoing bull market and not necessarily the start of a bear market.
All of small, mid and large caps last week fell strongly. The fall in price has broad support from market breadth. It was small caps though that had the least decline. This slight divergence indicates some weakness and may be interpreted as slightly bullish.
Breadth should be read as a leading indicator.
Thursday’s small new swing high in the AD line has not seen a corresponding new swing high in price. This is read as bullish divergence.
DOW THEORY
All indices have made new all time highs as recently as nine weeks ago, confirming the ongoing bull market.
The following lows need to be exceeded for Dow Theory to confirm the end of the bull market and a change to a bear market:
DJIA: 17,883.56.
DJT: 7,039.41.
S&P500: 2,083.79.
Nasdaq: 5,034.41.
Charts showing each prior major swing low used for Dow Theory are here.
GOLD
Downwards movement has continued a little further as last analysis expected. For the short term, volume and On Balance Volume suggest the direction for Monday and possibly Tuesday as well.
Summary: Expect this downwards swing to continue to support, which is at about 1,310 to 1,305. Do not expect this downwards swing to move in a straight line, because that is not how price behaves within a consolidation. Look out for a bounce Monday and / or Tuesday, and then the continuation of downwards movement.
Only the most experienced of traders should attempt to trade when price is clearly consolidating as it currently is for Gold and GDX. The rest should either hedge or wait for a breakout and trade the next trend. Always use stops and invest only 1-5% of equity on any one trade.
Grand SuperCycle analysis is here.
Last in-depth historic analysis with monthly and several weekly charts is here, video is here.
There are multiple wave counts at this time at the weekly and monthly chart levels. In order to make this analysis manageable and accessible only two will be published on a daily basis, one bullish and one bearish. This does not mean the other possibilities may not be correct, only that publication of them all each day is too much to digest. At this stage, they do not diverge from the two possibilities below.
BULLISH ELLIOTT WAVE COUNT
FIRST WEEKLY CHART

Click chart to enlarge.
Cycle wave b may be a single zigzag. Zigzags subdivide 5-3-5. Primary wave C must subdivide as a five wave structure and may be either an impulse or an ending diagonal. Overlapping at this stage indicates an ending diagonal.
Within an ending diagonal, all sub-waves must subdivide as zigzags. Intermediate wave (4) must overlap into intermediate wave (1) price territory. This diagonal is expanding: intermediate wave (3) is longer than intermediate wave (1) and intermediate wave (4) is longer than intermediate wave (2). Intermediate wave (5) must be longer than intermediate wave (3), so it must end above 1,398.41 where it would reach equality in length with intermediate wave (3).
Within the final zigzag of intermediate wave (5), minor wave B may not move beyond the start of minor wave A below 1,236.54.
Within the diagonal of primary wave C, each sub-wave is extending in price and so may also do so in time. Within each zigzag, minor wave B may exhibit alternation in structure and may show an increased duration.
Within intermediate wave (1), minor wave B was a triangle lasting 11 days. Within intermediate wave (2), minor wave B was a zigzag lasting 2 days. Within intermediate wave (3), minor wave B was a regular flat lasting 60 days. Within intermediate wave (4), minor wave B was a regular contracting triangle lasting 40 days. Within intermediate wave (5), minor wave B may be expected to be an expanded flat, combination or running triangle to exhibit some alternation in structure. It may last as long as 40 to 60 days. So far it has lasted 45 days (refer to daily chart) and the structure is incomplete.
At this stage, minor wave B may now be a combination or triangle. These two ideas are separated out in daily and hourly charts below.
This first weekly chart sees the upwards wave labelled primary wave A as a five wave structure. It must be acknowledged that this upwards wave looks better as a three than it does as a five. The fifth weekly chart below will consider the possibility that it was a three.
FIRST DAILY CHART – COMBINATION
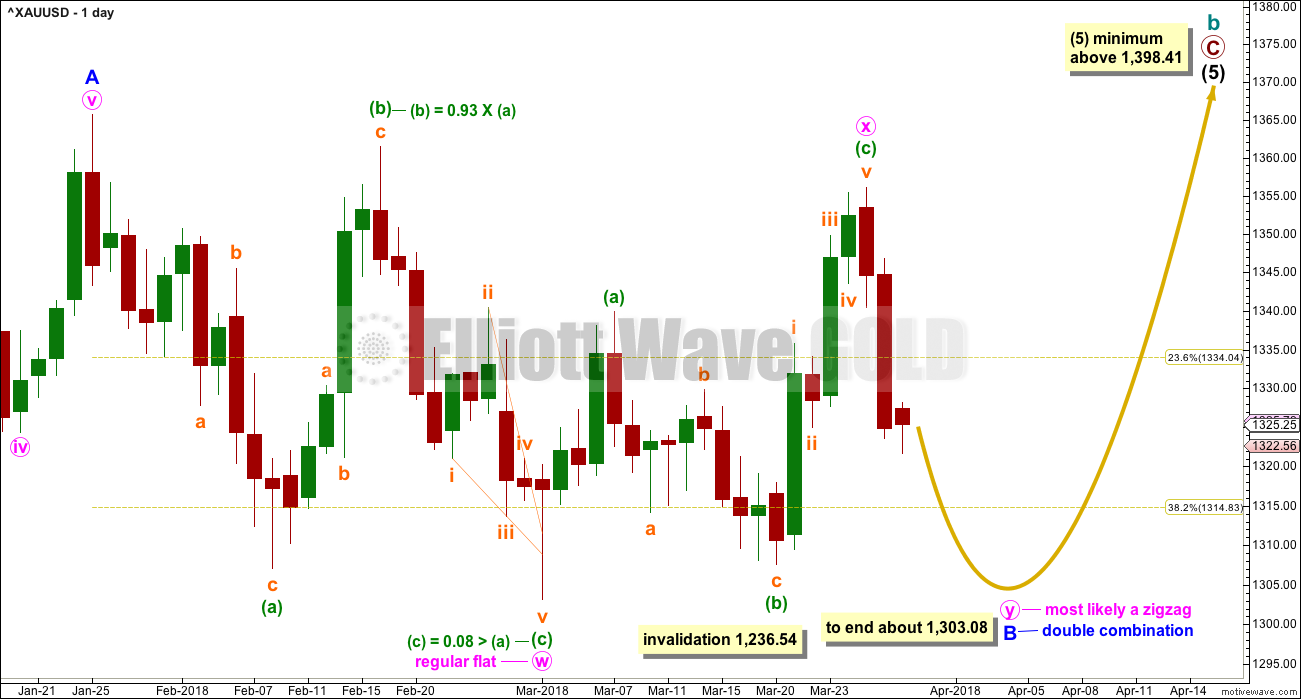
Click chart to enlarge.
Minor wave B may be a double combination. The first structure in the double may have been a regular flat correction labelled minute wave w.
The double is joined by a three in the opposite direction, a zigzag labelled minute wave x.
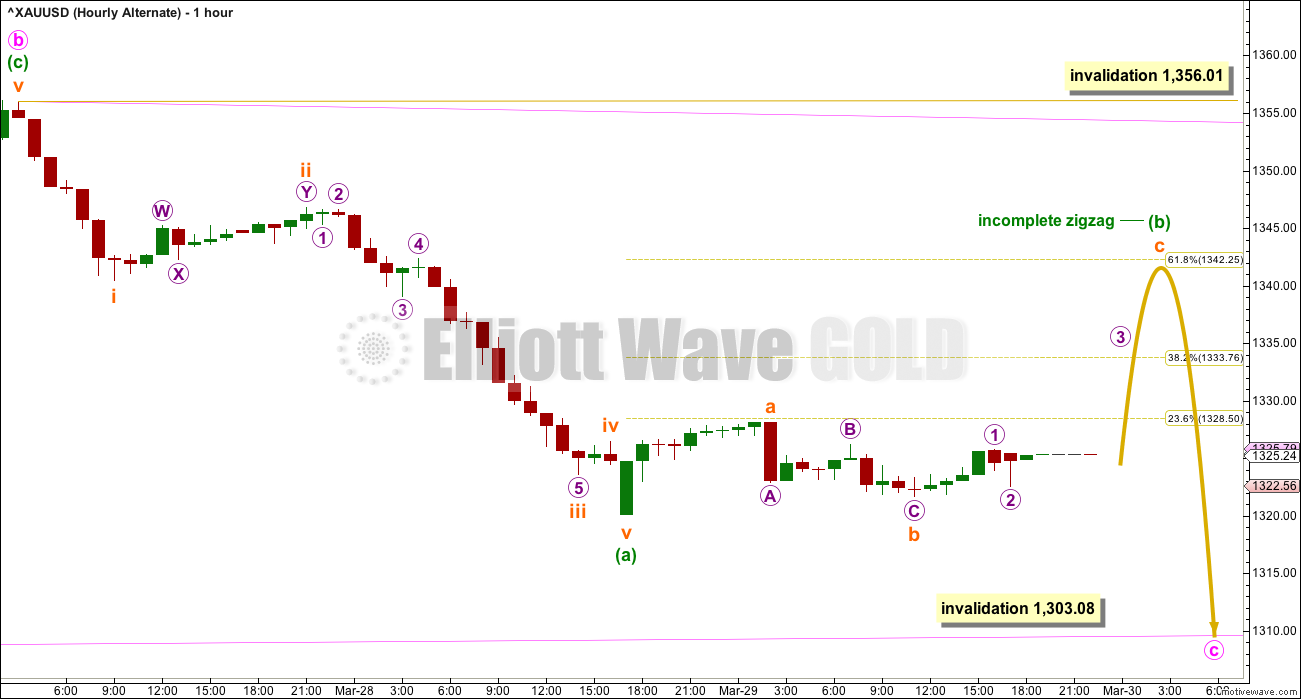
The second structure in the double may be a zigzag labelled minute wave y. It would most likely end about the same level as minute wave w, at about 1,303.08, so that the whole structure takes up time and moves price sideways. That is the purpose of double combinations.
Minute wave y as a zigzag should look like an obvious three wave structure at the daily chart level. For that to happen minuette wave (b) within it should show up as one or more green daily candlesticks or doji.
When minute wave y is a complete zigzag, then the probability of the combination being over would be very high. While double combinations are very common structures, triples are extremely rare.
While minute wave y may also be a flat correction, in my experience double flats are fairly rare.
Minute wave y may also be a triangle but the expected pathway at this stage would be the same as the triangle wave count below, so it will not be separated out. A triangle within a combination is also in my experience uncommon.
FIRST HOURLY CHART – COMBINATION
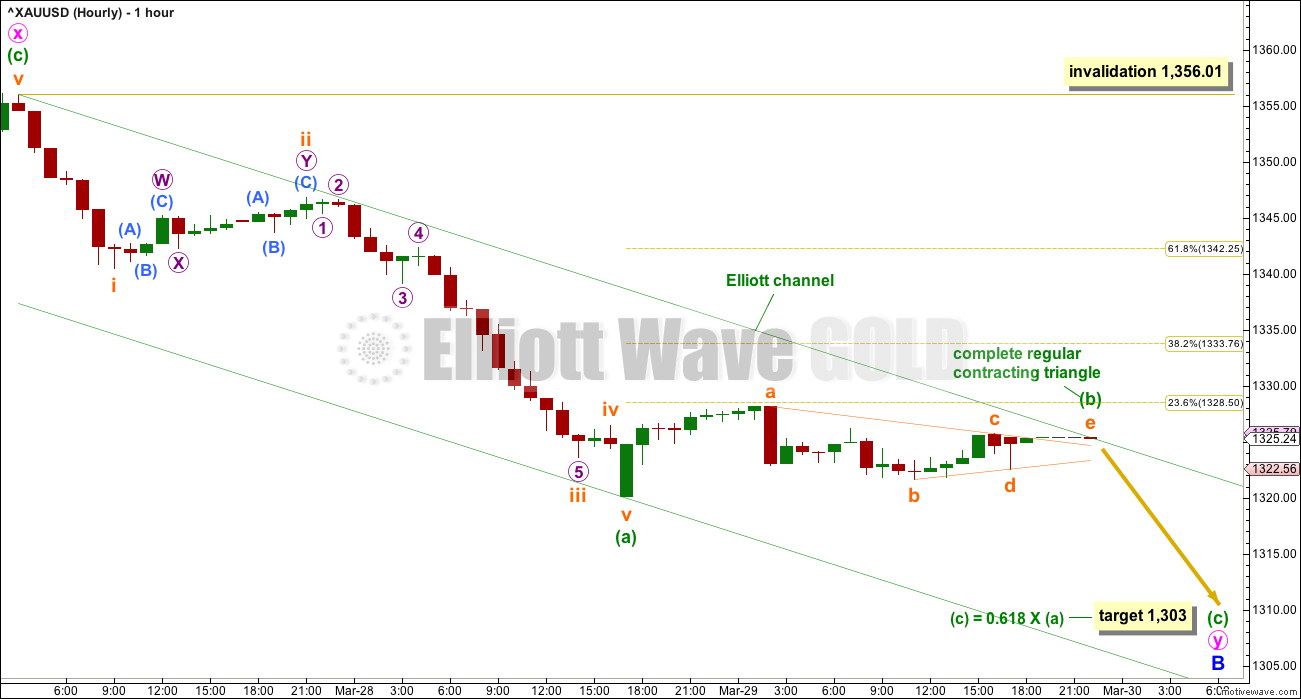
Click chart to enlarge.
Both wave counts at the daily chart level today expect that a zigzag downwards is unfolding. Both will now see minuette wave (a) complete at Wednesday’s low. The size in terms of duration of the following upwards and sideways movement looks like a new wave, not part of the last wave down. This looks like minuette wave (b).
There are multiple structural options for minuette wave (b). The two hourly charts published today will consider two different possibilities. They both work in exactly the same way for both daily wave counts.
This first idea looks at minuette wave (b) as a possibly complete triangle. If minuette wave (b) is complete, then it would not have shown up on the daily chart as one or more green daily candlesticks or doji, so this would be less likely.
If minuette wave (b) is over, then a target should be calculated for minuette wave (c).
If minuette wave (b) continues further, then the target must be recalculated. Minuette wave (b) may not move beyond the start of minuette wave (a) above 1,356.01.
SECOND DAILY CHART – TRIANGLE
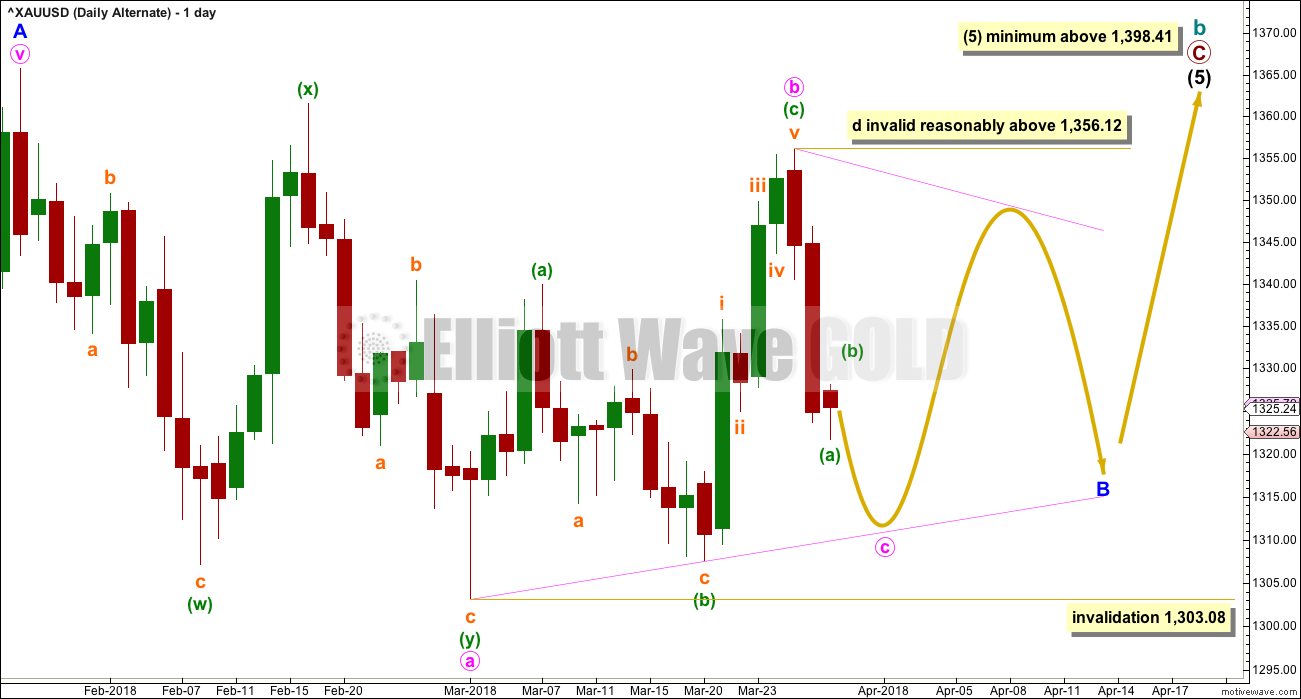
Click chart to enlarge.
This alternate daily chart is identical to the first daily chart up to the high labelled minor wave A. Thereafter, it looks at a different structure for minor wave B.
Minor wave B may be an incomplete triangle, and within it minute wave a may have been a double zigzag. All remaining triangle sub-waves must be simple A-B-C structures, and three of the four remaining sub-waves must be simple zigzags. One remaining sub-wave may be a flat correction.
Minute wave b may be unfolding upwards as a single zigzag, and within it minuette wave (b) may not move beyond the start of minuette wave (a) below 1,303.08.
This alternate wave count expects weeks of choppy overlapping movement in an ever decreasing range.
Triangles normally adhere very well to their trend lines. The triangle trend lines are commonly tested within the triangle sub-waves. Minuette wave (b) within minute wave b may have found support at the a-c trend line, and this indicates where minute wave c may end.
Minute wave c of the triangle may not move beyond the end of minute wave a below 1,303.08.
Minute wave d of a contracting triangle may not move beyond the end of minute wave b above 1,356.12. Minute wave d of a barrier triangle should end about the same level as minute wave b; the triangle will remain valid as long as the b-d trend line remains essentially flat. In practice, this means minute wave d can end slightly above 1,356.12. This invalidation point is not black and white; it involves an area of subjectivity.
Contracting triangles are the most common type. Barrier triangles are not common, but nor are they rare.
At the daily chart level, for this wave count it would be extremely likely that the zigzag of minute wave c looks like a three wave structure. For that to happen minuette wave (b) within it needs to show up on the daily chart as one or more green daily candlesticks or doji.
SECOND HOURLY CHART – TRIANGLE
Click chart to enlarge.
Minuette wave (b) may be an incomplete zigzag. Within the zigzag, subminuette waves a and b may be over. Subminuette wave c may move higher, to bring minuette wave (b) up to either the 0.382 or 0.618 Fibonacci ratios. Neither may be favoured.
This second hourly chart has support today from classic technical analysis.
BEARISH ELLIOTT WAVE COUNT
FIFTH WEEKLY CHART
Click chart to enlarge.
There were five weekly charts published in the last historic analysis. This fifth weekly chart is the most immediately bearish wave count, so this is published as a bearish possibility.
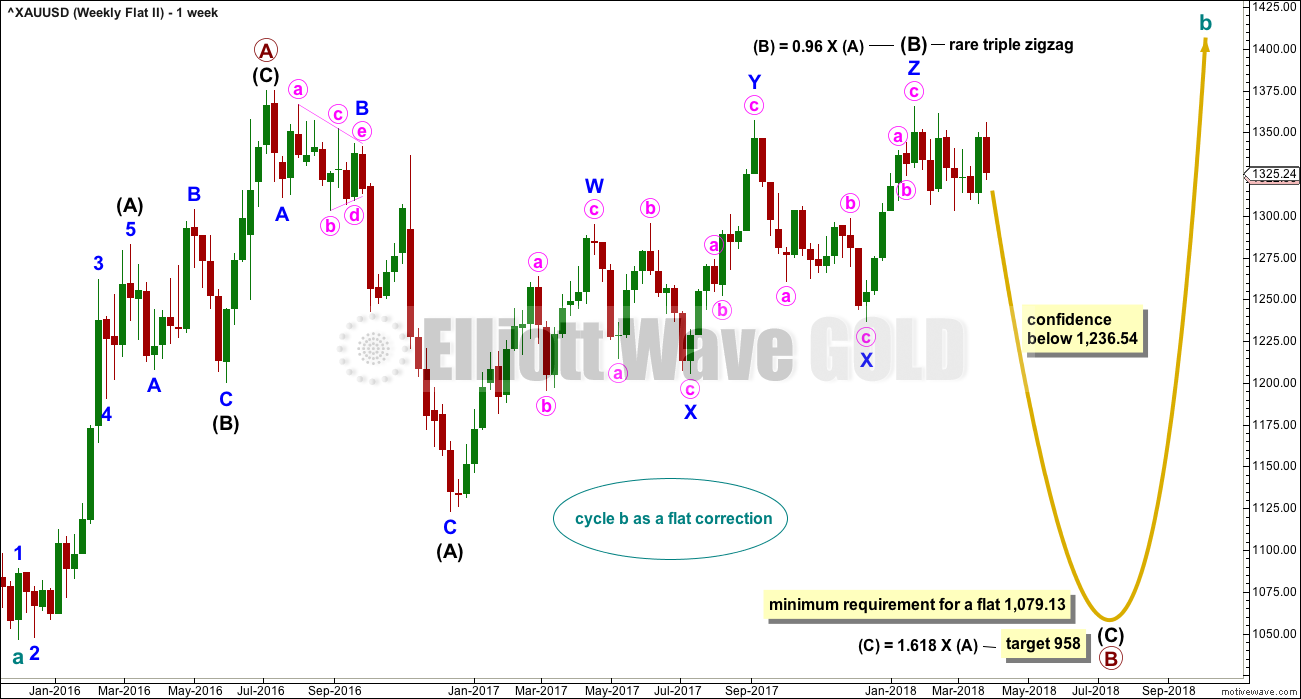
This fifth weekly chart sees cycle wave b as a flat correction, and within it intermediate wave (B) may be a complete triple zigzag. This would indicate a regular flat as intermediate wave (B) is less than 1.05 the length of intermediate wave (A).
If cycle wave b is a flat correction, then within it primary wave B must retrace a minimum 0.9 length of primary wave A at 1,079.13 or below. The most common length of B waves within flats is from 1 to 1.38 times the length of the A wave. The target calculated would see primary wave B end within this range.
I have only seen two triple zigzags before during my 10 years of daily Elliott wave analysis. If this wave count turns out to be correct, this would be the third. The rarity of this structure is identified on the chart.
It is very difficult now at the daily chart level to see a five down followed by a corrective structure complete. This wave count has reduced in probability this week.
TECHNICAL ANALYSIS
WEEKLY CHART
Click chart to enlarge. Chart courtesy of StockCharts.com.
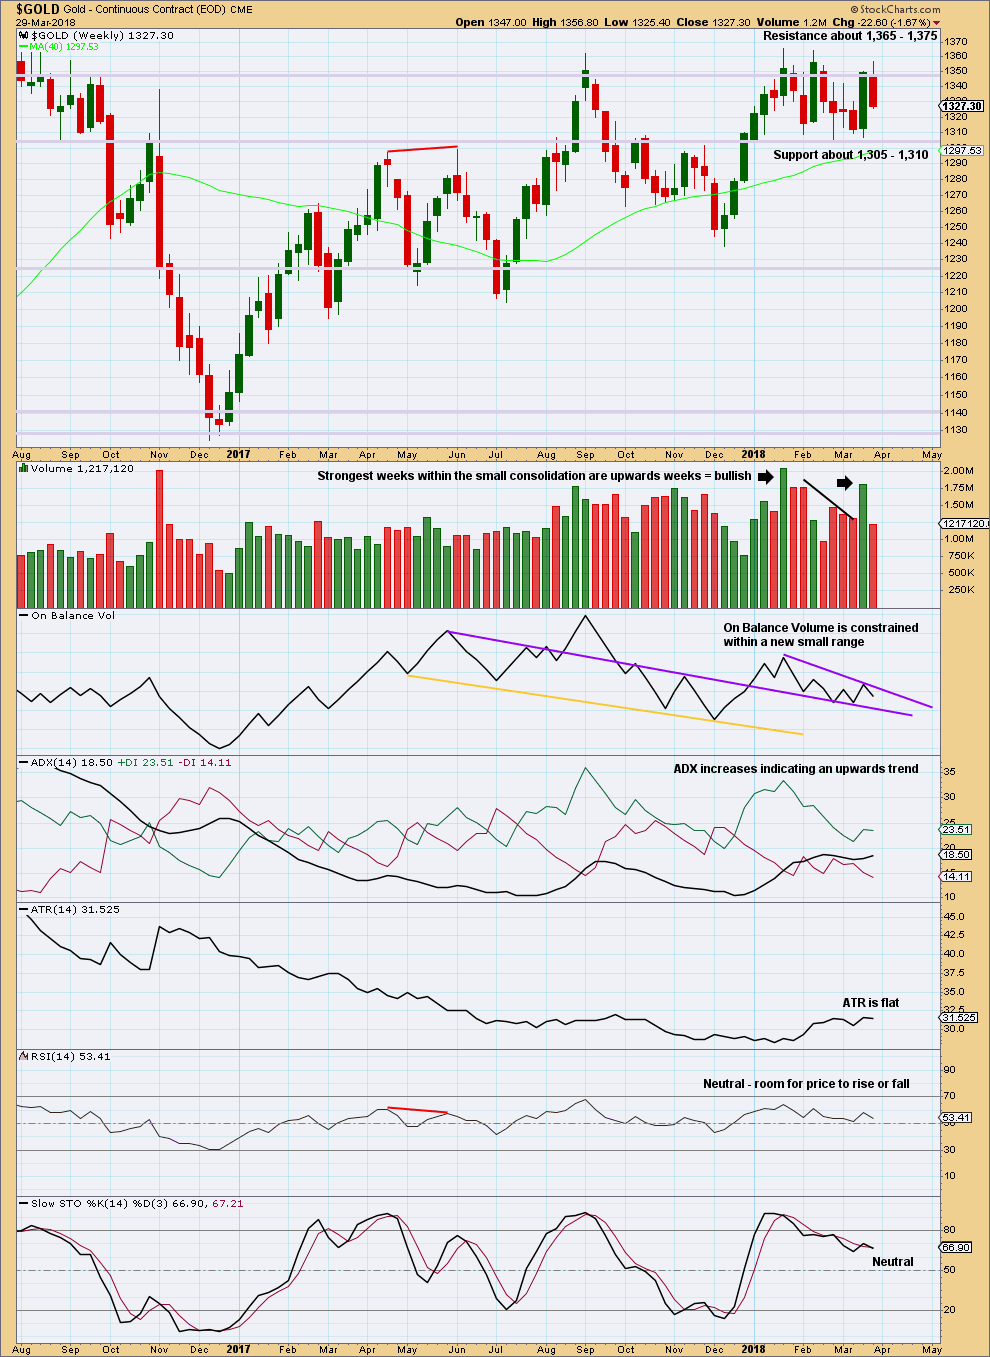
A longer upper wick is bearish, but a lack of support from volume is slightly bullish. However, price can fall of its own weight. For downwards movement to be sustained for a little longer support from volume is not necessary.
A new resistance line is drawn on On Balance Volume this week.
DAILY CHART
Click chart to enlarge. Chart courtesy of StockCharts.com.
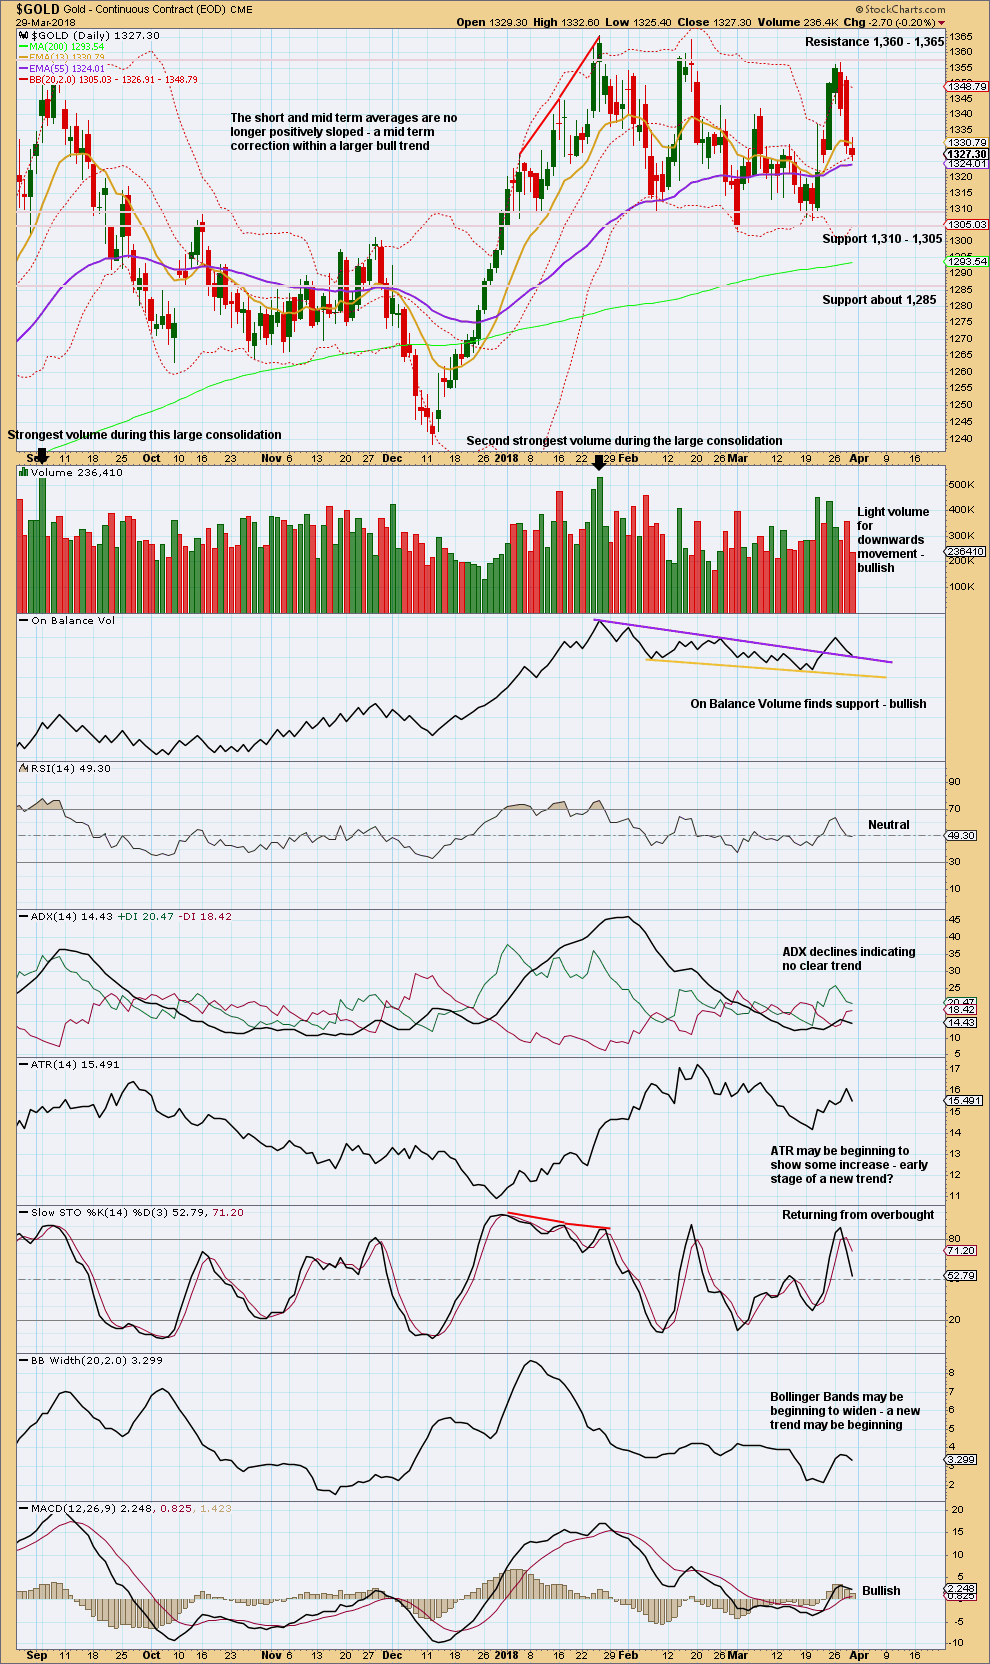
Looking at the bigger picture, Gold has been within a large consolidation since about January 2017 (this chart does not show all of this large consolidation), and during this consolidation it is two upwards days that have strongest volume and an upwards week that has strongest volume. Volume suggests an upwards breakout may be more likely than downwards.
Currently, Gold is within a smaller consolidation that began in early January 2018. This consolidation is delineated by support about 1,310 to 1,305 and resistance about 1,360 – 1,365. It is an upwards day during this smaller consolidation that has strongest volume, suggesting an upwards breakout may be more likely here than downwards.
For the short term, a bounce may be expected here. On Balance Volume is at support and Thursday’s downwards movement lacks support from volume.
GDX WEEKLY CHART
Click chart to enlarge. Chart courtesy of StockCharts.com.
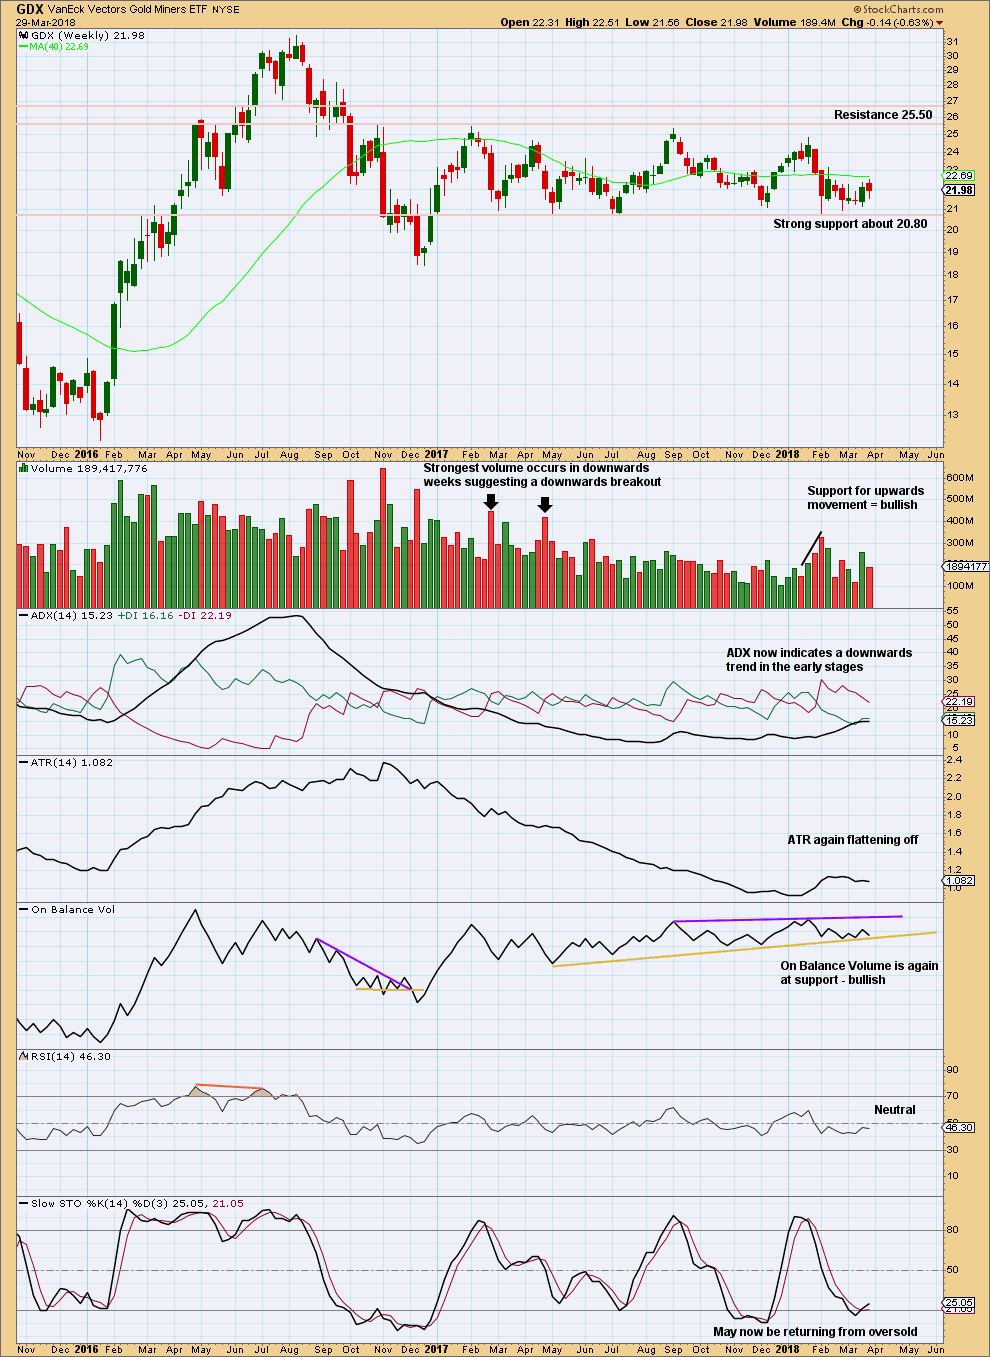
Support about 20.80 has been tested about eight times and so far has held. The more often a support area is tested and holds, the more technical significance it has.
In the first instance, expect this area to continue to provide support. Only a strong downwards day, closing below support and preferably with some increase in volume, would constitute a downwards breakout from the consolidation that GDX has been in for a year now.
Resistance is about 25.50. Only a strong upwards day, closing above resistance and with support from volume, would constitute an upwards breakout.
With On Balance Volume again at support look for upwards movement next week. Downwards movement during this week lacks support from volume.
GDX DAILY CHART
Click chart to enlarge. Chart courtesy of StockCharts.com.
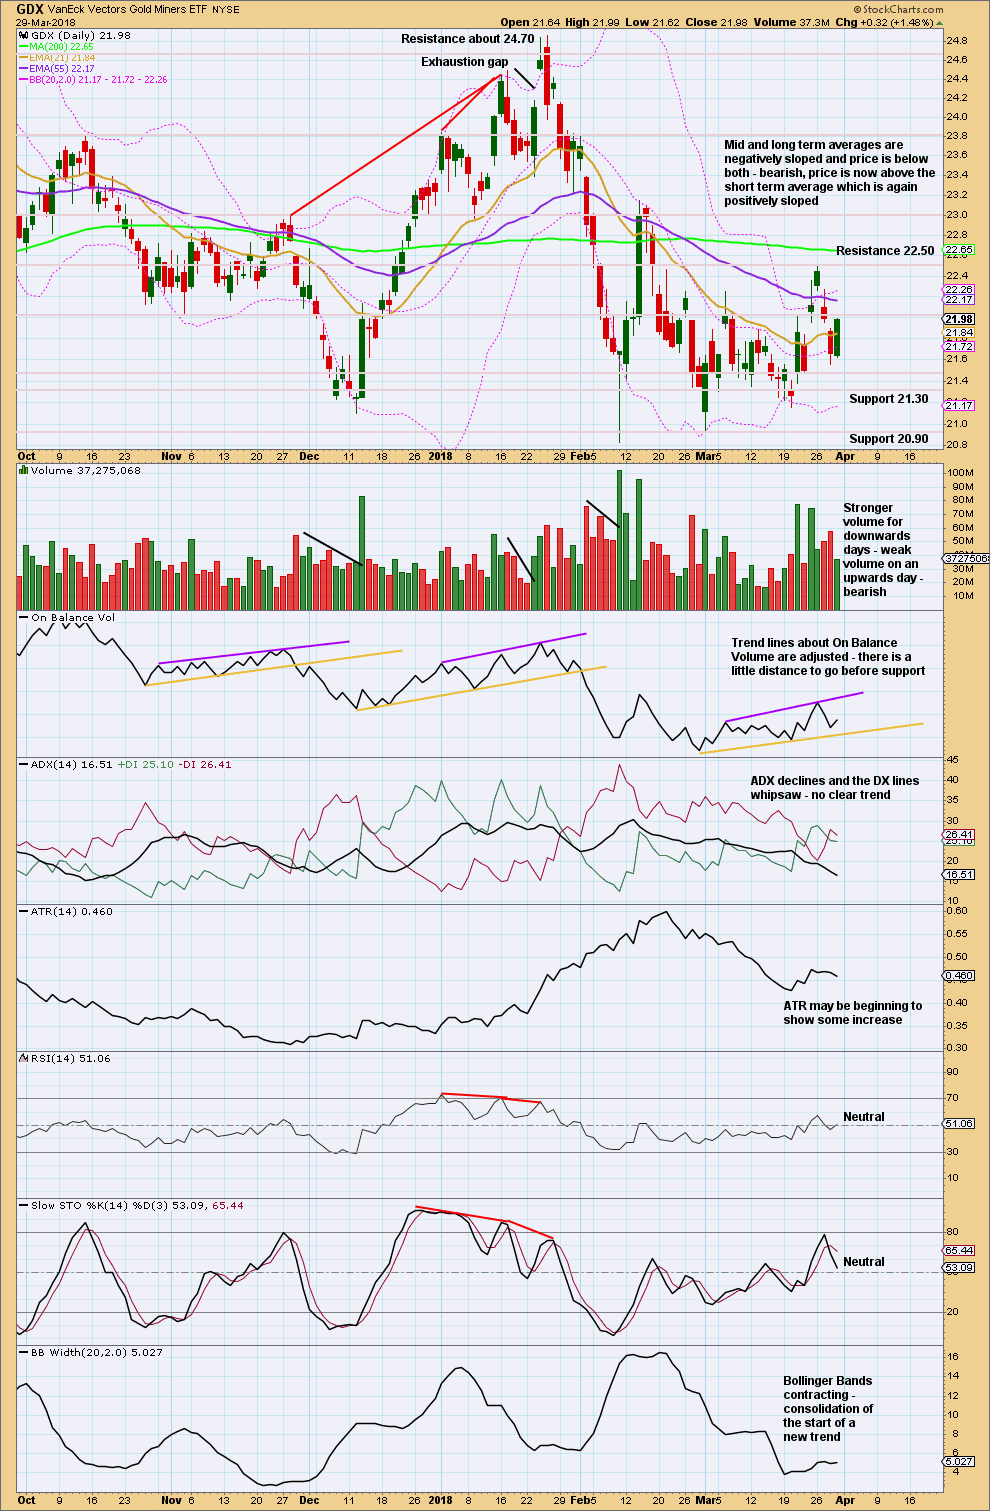
GDX is range bound at both weekly and daily time frames. The smaller consolidation here has resistance now about 22.50 and support about 21.30 and 20.90.
During this consolidation, Stochastics is not reaching oversold and overbought. Look for a downwards swing to continue here until On Balance Volume finds support, price finds support, and Stochastics nears oversold (but may not reach it).
US OIL
A turn was expected. Price has remained just below the invalidation point and printed a red weekly candlestick.
Summary: Price must continue lower here for the main Elliott wave count. A new high above 66.65 would substantially reduce the probability of the bearish wave count and increase the probability of a huge new bull market for Oil, which would have final confidence above 74.96.
Classic technical analysis this week still favours a bullish outlook for the bigger picture, but it supports the view here that price may move lower for a week or so.
If price turns lower here, then the target for a new low remains at 13.39. A new low on the way down, below 55.24, would add substantial confidence in a bearish outlook.
Always practice good risk management as the most important aspect of trading. Always trade with stops and invest only 1-5% of equity on any one trade. Failure to manage risk is the most common mistake new traders make.
MAIN WAVE COUNT
MONTHLY CHART
Click chart to enlarge.
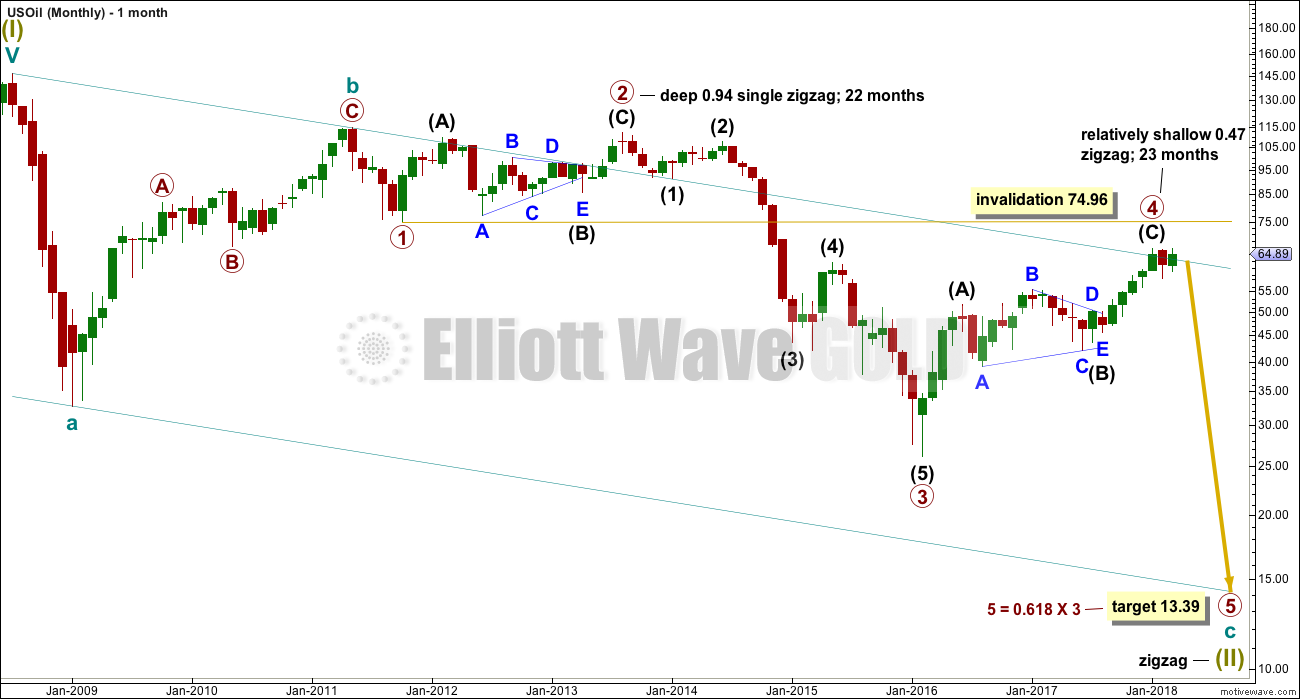
Within the bear market, cycle wave b is seen as ending in May 2011. Thereafter, a five wave structure downwards for cycle wave c begins.
Primary wave 1 is a short impulse lasting five months. Primary wave 2 is a very deep 0.94 zigzag lasting 22 months. Primary wave 3 is a complete impulse with no Fibonacci ratio to primary wave 1. It lasted 30 months.
There is alternation in depth with primary wave 2 very deep and primary wave 4 relatively shallow. There is inadequate alternation in structure, both are zigzags. So far primary wave 4 has lasted 23 months. At this stage, there is almost perfect proportion between primary waves 2 and 4.
Primary wave 4 may not move into primary wave 1 price territory above 74.96.
The wider Elliott channel (teal) about this whole movement may offer support to primary wave 5.
WEEKLY CHART
Click chart to enlarge.
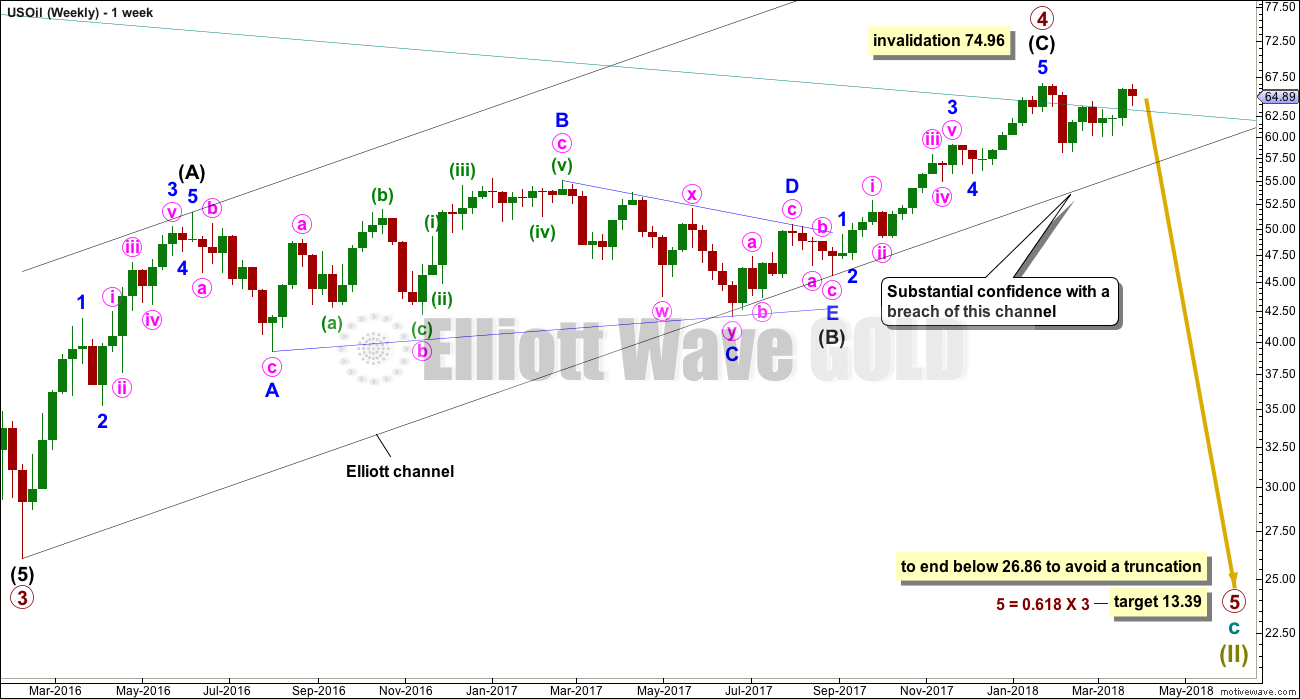
Primary wave 4 subdivides as a zigzag, and within it intermediate wave (C) may now be complete. If primary wave 5 were to only reach equality in length with primary wave 3, it would end with a small truncation. A target for primary wave 5 may best be calculated at intermediate degree. That can only be done when intermediate waves (1) through to (4) within primary wave 5 are complete.
For now a target will be calculated at primary degree using a ratio between primary waves 3 and 5. This target only has a small probability. This target will be recalculated as primary wave 5 nears its end, so it may change.
An Elliott channel is added to this possible zigzag for primary wave 4. A breach of the lower edge of this channel would provide a very strong indication that primary wave 4 should be over and primary wave 5 should be underway. Look out for some support on the way down, perhaps a short term bounce about the lower edge of the channel.
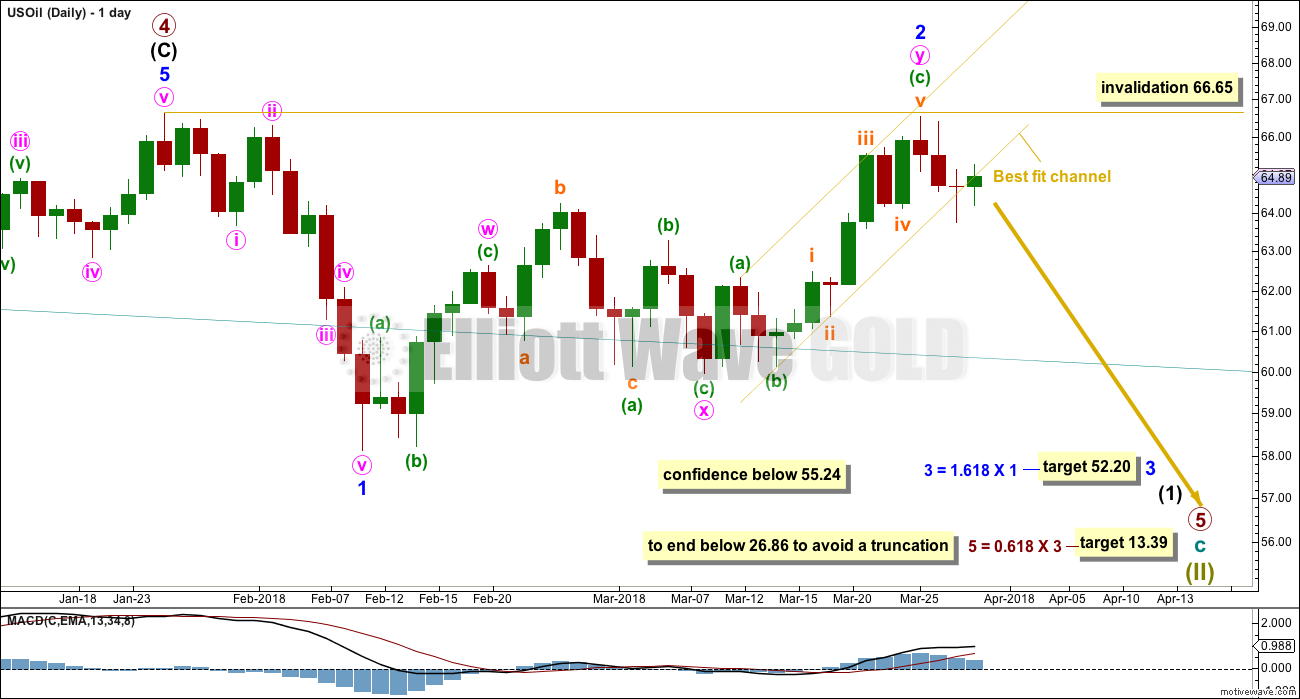
DAILY CHART
Click chart to enlarge.
Minor wave 1 will subdivide as a complete impulse at lower time frames.
Minor wave 2 looks like a double zigzag. The first structure in the double zigzag is labelled minute wave w. The double is joined by a three in the opposite direction, an expanded flat labelled minute wave x. The second zigzag in the double has deepened the correction achieving its purpose, and it is labelled a zigzag for minute wave y.
There is now almost no room left for this wave count to move into. Minor wave 2 must end here and minor wave 3 downwards must have begun last week if this wave count is correct.
A target is calculated for minor wave 3 which expects the most common Fibonacci ratio to minor wave 1. If price reaches down to this target and the structure is incomplete or price keeps falling through it, then the next Fibonacci ratio in the sequence of 2.618 would be used to calculate a new target.
Minor wave 2 may not move beyond the start of minor wave 1 above 66.65.
A new low below 55.24 would invalidate the bullish alternate below and provide reasonable confidence in this main wave count.
Price has moved slightly below the yellow best fit channel, but the channel is not properly breached by downwards movement. I classify a breach by a full daily candlestick below and not touching the channel. This wave count will be in doubt while the channel is not breached.
Again, this week’s classic analysis supports the alternate wave count and does not support this main wave count.
ALTERNATE WAVE COUNT
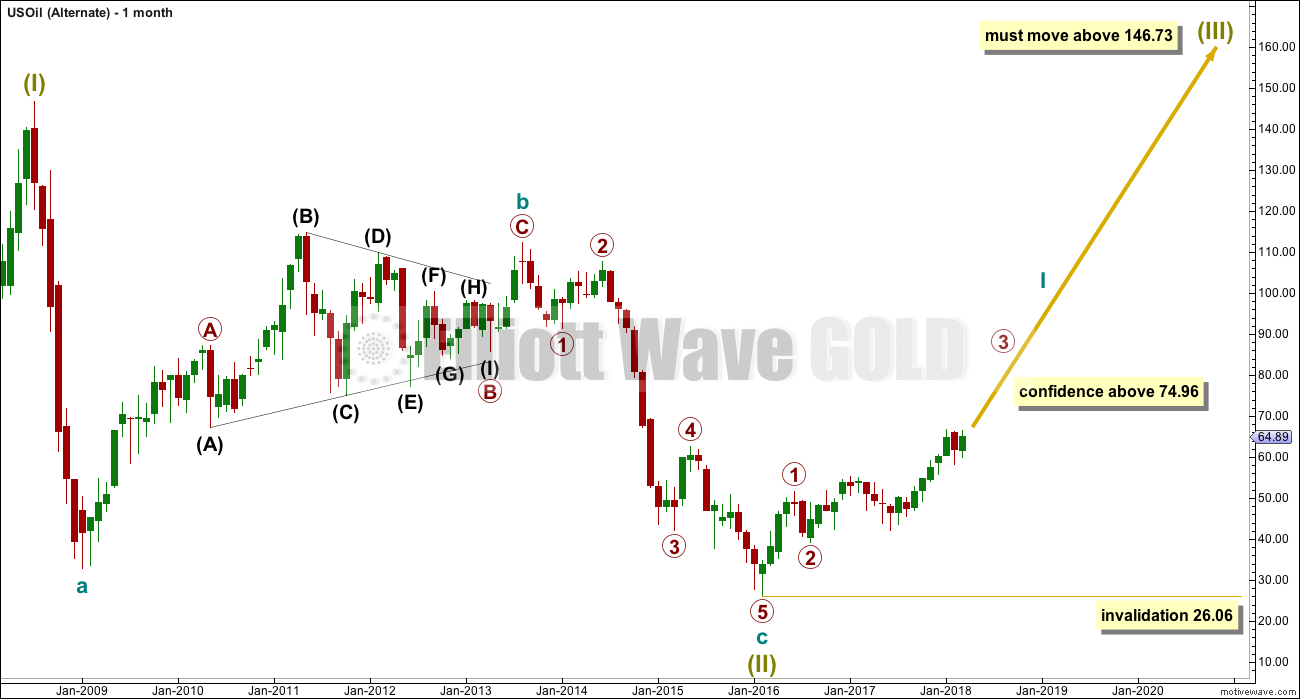
MONTHLY CHART
Click chart to enlarge.
It is possible that the bear market for Oil is over and a new bull market is in the very early stages.
A huge zigzag down to the last low may be complete and is labelled here Super Cycle wave (II).
Cycle wave b must be seen as complete in August 2013 for this wave count to work. It cannot be seen as complete at the prior major swing high in May 2011.
Cycle wave b is seen as a zigzag, and within it primary wave B is seen as a running contracting triangle. These are fairly common structures, although nine wave triangles are uncommon. All subdivisions fit.
Primary wave C moves beyond the end of primary wave A, so it avoids a truncation. But it does not have to move above the price territory of primary wave B to avoid a truncation, which is an important distinction.
If cycle wave b begins there, then cycle wave c may be seen as a complete five wave impulse.
Super Cycle wave (III) must move beyond the end of Super Cycle wave (I). It must move far enough above that point to allow room for a subsequent Super Cycle wave (IV) to unfold and remain above Super Cycle wave (I) price territory.
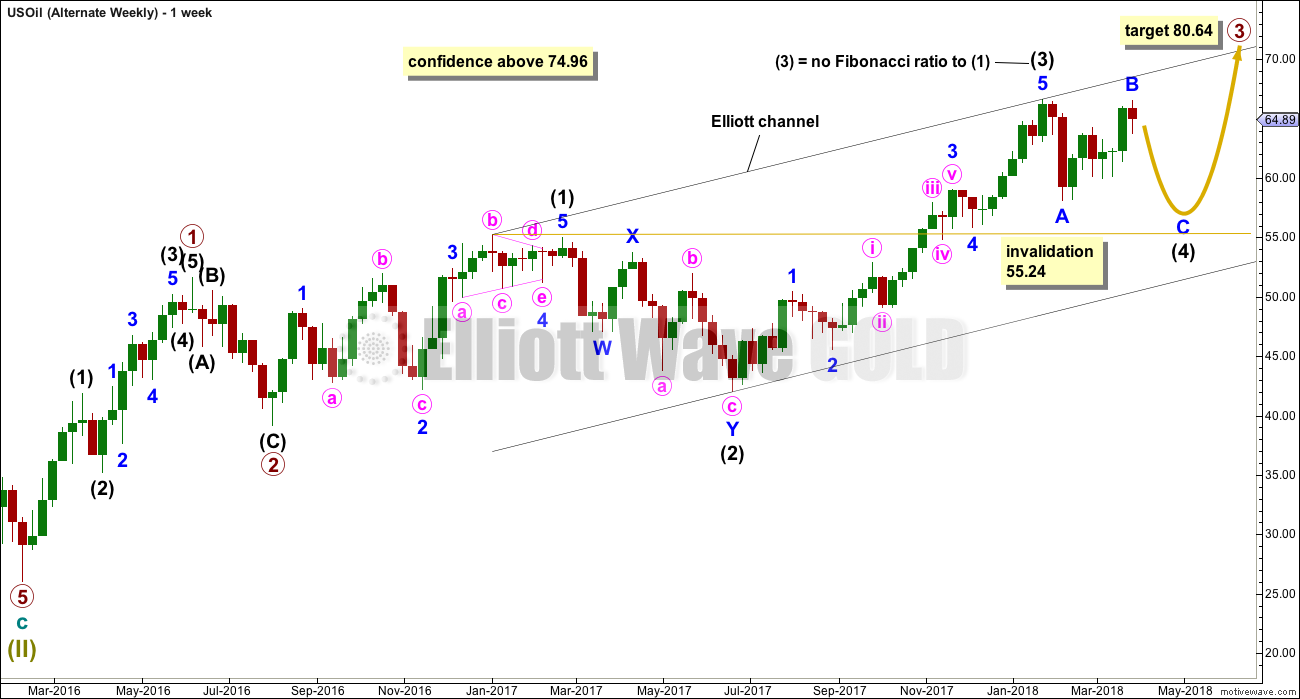
WEEKLY CHART
Click chart to enlarge.
If a new bull market is in the very early stages for Oil, then it may have begun with two overlapping first and second waves at primary then at intermediate degree.
Primary wave 3 may only subdivide as an impulse, and within it intermediate wave (3) may be complete.
Intermediate wave (4) may not move into intermediate wave (1) price territory below 55.24. Intermediate wave (4) would most likely be incomplete. It may continue further sideways or lower.
Intermediate wave (2) is labelled as a double zigzag. To exhibit alternation intermediate wave (4) may most likely be a flat, combination or triangle. Intermediate wave (2) lasted 17 weeks. For good proportion and the right look, intermediate wave (4) may last a Fibonacci 13 or even 21 weeks in total. So far it has lasted only nine weeks.
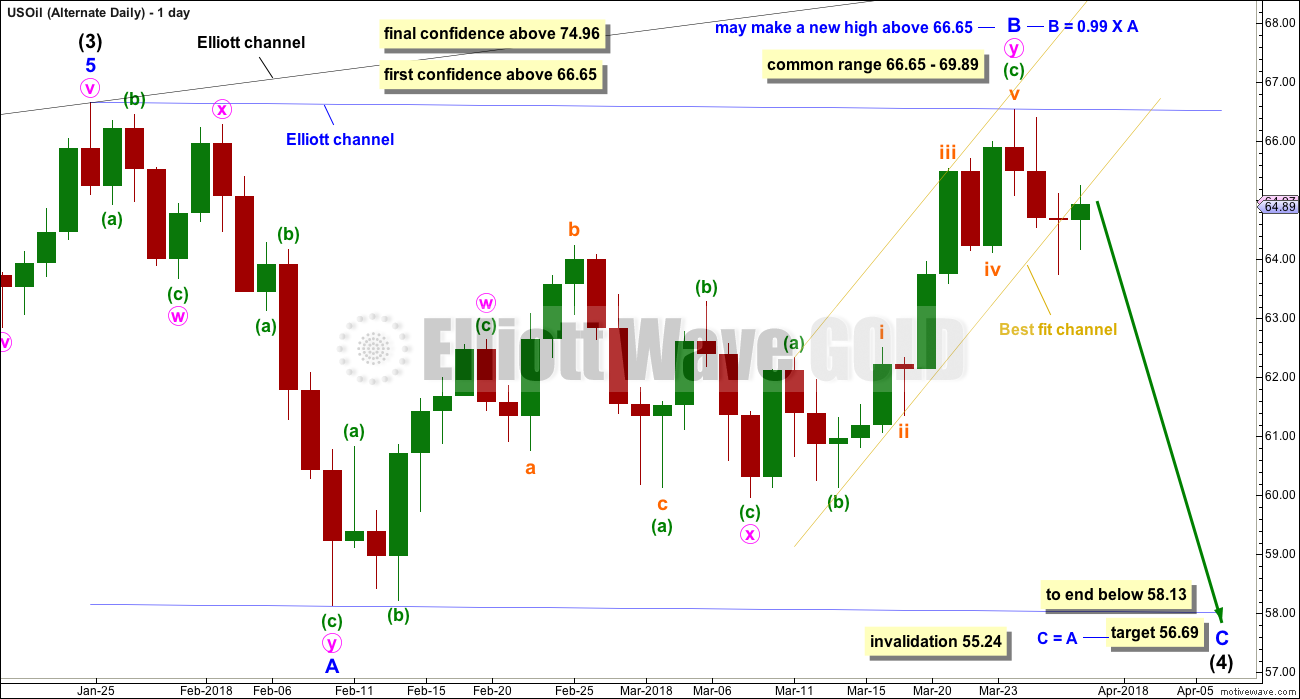
DAILY CHART
Click chart to enlarge.
It would be unlikely that intermediate wave (4) would be over a the last low labelled minor wave A. That would be too brief.
If intermediate wave (4) is continuing, then it may be as a flat correction. If minor wave B is now over at 0.99 the length of minor wave A, then intermediate wave (4) may be a regular flat correction. Regular flats normally fit nicely into trend channels. The most likely Fibonacci ratio for minor wave C would be equality in length with minor wave A.
Minor wave C downwards must be a five wave structure.
It is possible that minor wave B could continue higher. No upper invalidation point may yet be used for this wave count.
TECHNICAL ANALYSIS
MONTHLY CHART
Click chart to enlarge. Chart courtesy of StockCharts.com.
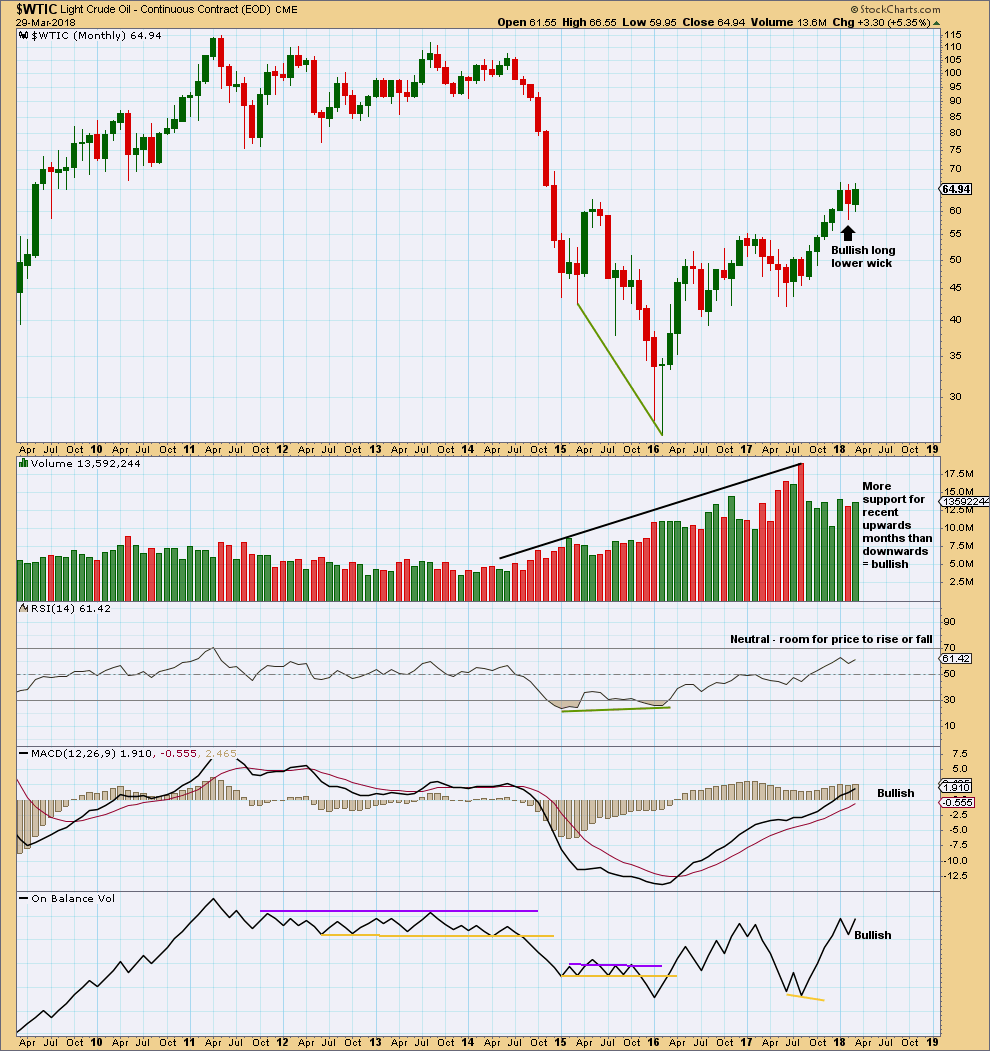
The strongest recent monthly volume is for the downwards month of August 2017. This is bearish.
For the last three months all now complete, the volume profile is bullish.
This chart is overwhelmingly bullish. It supports the alternate Elliott wave count.
DAILY CHART
Click chart to enlarge. Chart courtesy of StockCharts.com.
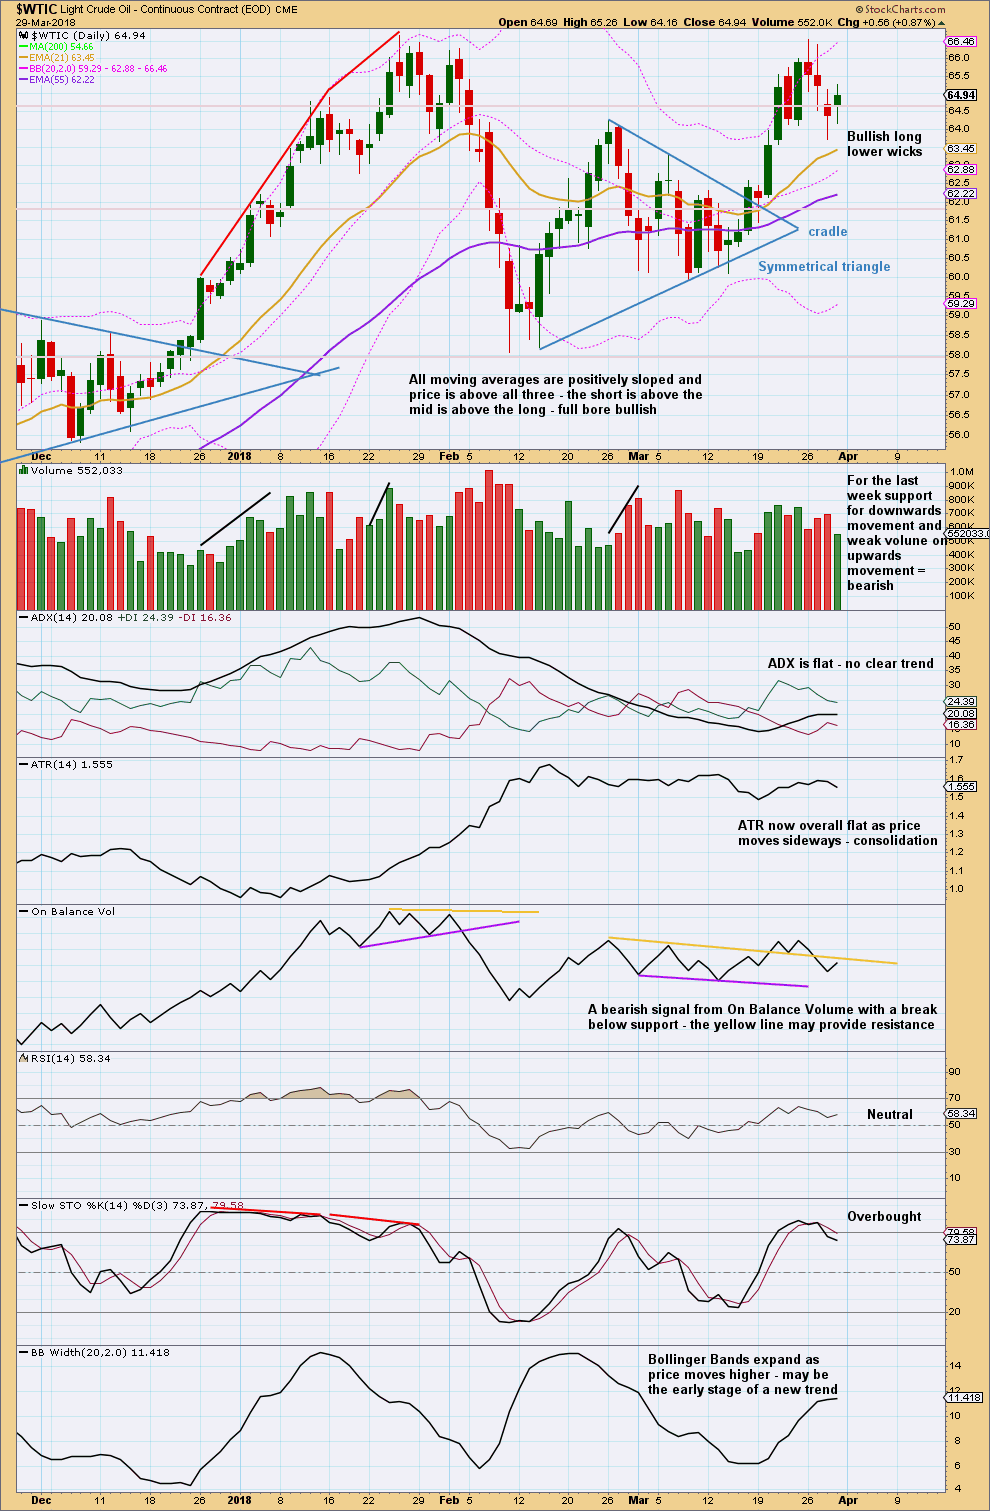
The bullish long lower wicks strongly suggest some upwards movement to start the new trading week. They make no comment on how much or for how long though.
The short term volume profile from last week is bearish. The last two signals from On Balance Volume are bearish. Stochastics is overbought. These all support the short term outlook for both Elliott wave counts, which expect some downwards movement for about three weeks.
Oil and $OVX Volatility Index currently have a positive correlation. There is a view within the trading community that they should have a negative correlation, and that any divergence may be a signal. At this time, that relationship is absent and $OVX is not providing signals, so it will not be used in this analysis at this time.
This analysis was previously posted on Elliott Wave Gold.
Hello …….. Is there anybody here?
“Is there anybody here, who’d like to be in our band
Or did you think that it might be too hard to do
Our friends came along to play in our band
There’s Joe on the bass (bass solo)
And Bill on the drums (percussion solo)
Cause our friends can do anything they really want to do
And so can you!”
Footnote: This song is by Sharon, Lois & Bram and appears on the album One Elephant, Deux Elephants (1978).