
A bounce was expected to continue for one to a few days, before downwards movement resumed, but the bounce was over already and downwards movement resumed a little earlier than anticipated. A target may now be calculated.
Summary: The short term target for downwards movement to be interrupted by another bounce is at 2,664. It may be reached tomorrow.
Always practice good risk management. Always trade with stops and invest only 1-5% of equity on any one trade.
The biggest picture, Grand Super Cycle analysis, is here.
Last historic analysis with monthly charts is here. Video is here.
An alternate idea at the monthly chart level is given here at the end of this analysis.
An historic example of a cycle degree fifth wave is given at the end of the analysis here.
MAIN ELLIOTT WAVE COUNT
WEEKLY CHART
Click chart to enlarge.
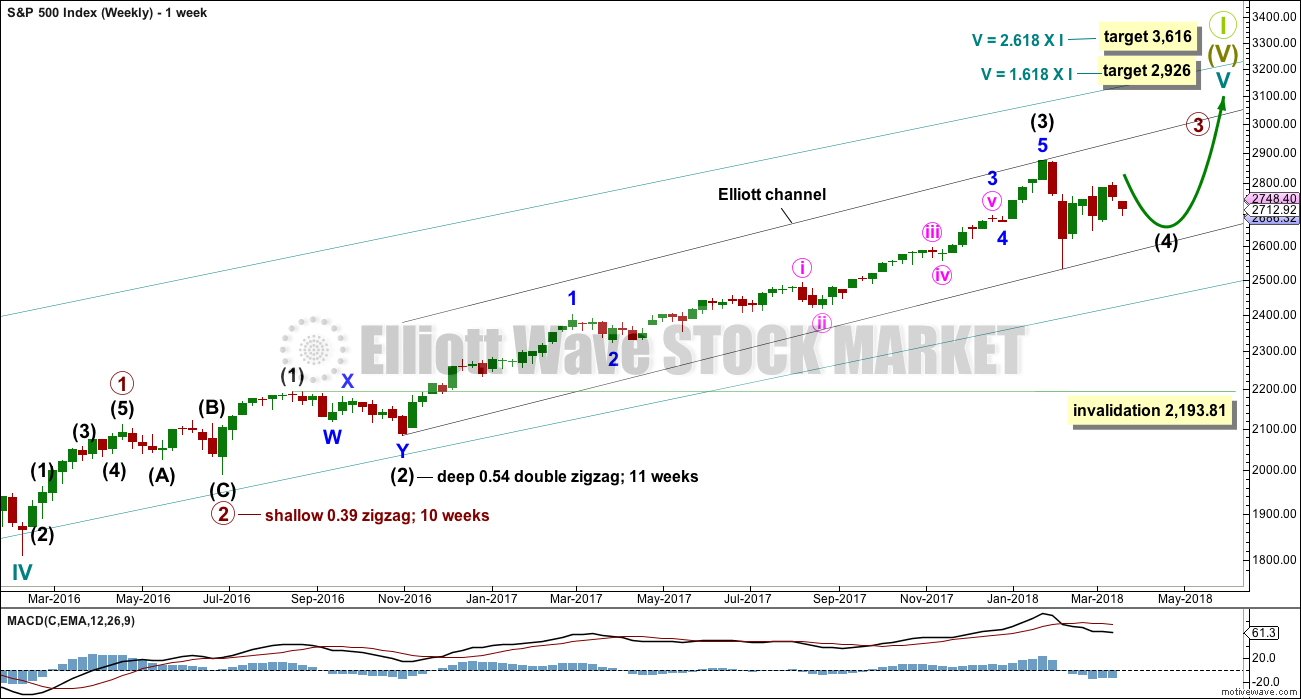
Cycle wave V must complete as a five structure, which should look clear at the weekly chart level. It may only be an impulse or ending diagonal. At this stage, it is clear it is an impulse.
Within cycle wave V, the third waves at all degrees may only subdivide as impulses.
Intermediate wave (4) has breached an Elliott channel drawn using Elliott’s first technique. The channel is redrawn using Elliott’s second technique as if intermediate wave (4) was over at the last low. If intermediate wave (4) continues sideways, then the channel may be redrawn when it is over. The upper edge may provide resistance for intermediate wave (5).
Intermediate wave (4) may not move into intermediate wave (1) price territory below 2,193.81. At this stage, it now looks like intermediate wave (4) may be continuing further sideways as a combination, triangle or flat. These three ideas are separated into separate daily charts. All three ideas would see intermediate wave (4) exhibit alternation in structure with the double zigzag of intermediate wave (2).
A double zigzag would also be possible for intermediate wave (4), but because intermediate wave (2) was a double zigzag this is the least likely structure for intermediate wave (4) to be. Alternation should be expected until price proves otherwise.
DAILY CHART – TRIANGLE
Click chart to enlarge.
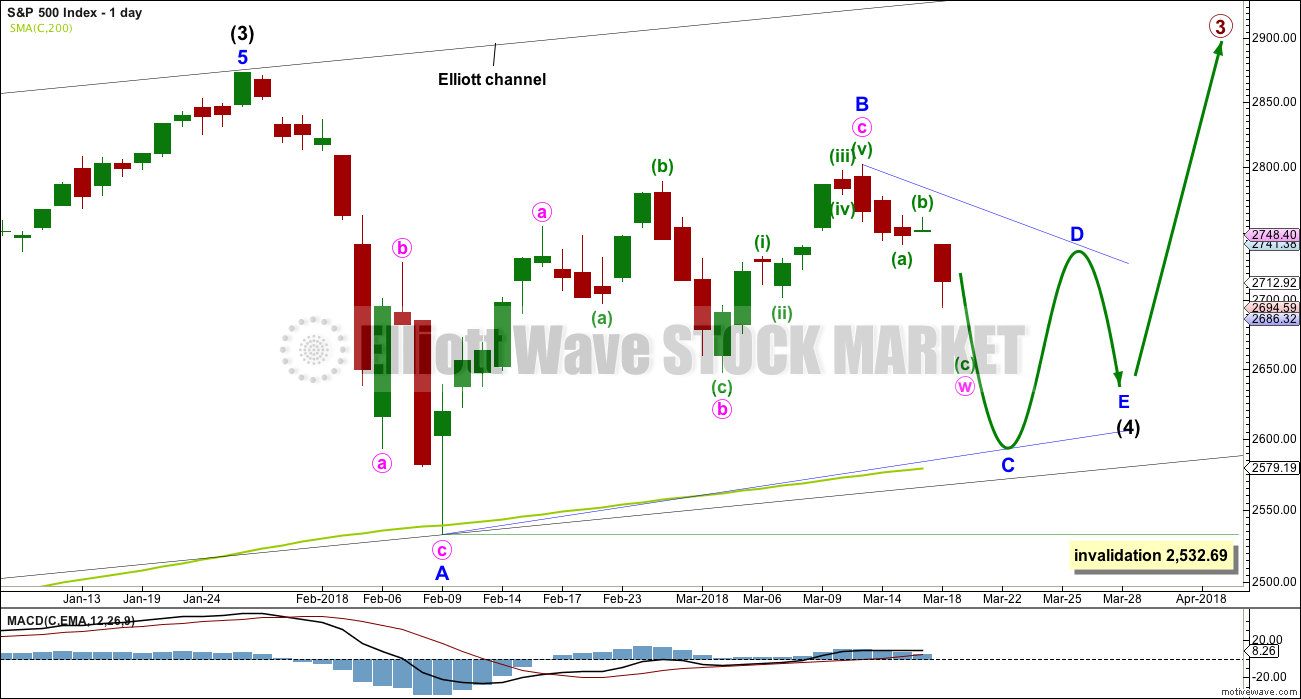
This first daily chart outlines how intermediate wave (4) may now continue further sideways as a contracting or barrier triangle. It is possible that minor wave B within the triangle was over at the last high, which would mean the triangle would be a regular triangle. Minor wave C downwards may now be underway and may be a single or double zigzag. One of the five sub-waves of a triangle is usually a more complicated multiple, and the most common sub-wave to do this is wave C. It looks like minor wave C may be unfolding as a double zigzag, at this stage, and this is how it will be labelled. Within the double zigzag, minute wave x should not make a new high above the start of minute wave w at 2,801.90.
Minor wave C may not make a new low below the end of minor wave A at 2,532.69.
Intermediate wave 2 lasted 11 weeks. If intermediate wave (4) is incomplete, then it would have so far lasted only seven weeks. Triangles tend to be very time consuming structures, so intermediate wave (4) may total a Fibonacci 13 or even 21 weeks at its conclusion.
Because this is the only daily chart which expects price to continue to find support at the 200 day moving average, it is presented first; it may have a slightly higher probability than the next two daily charts.
DAILY CHART – COMBINATION
Click chart to enlarge.
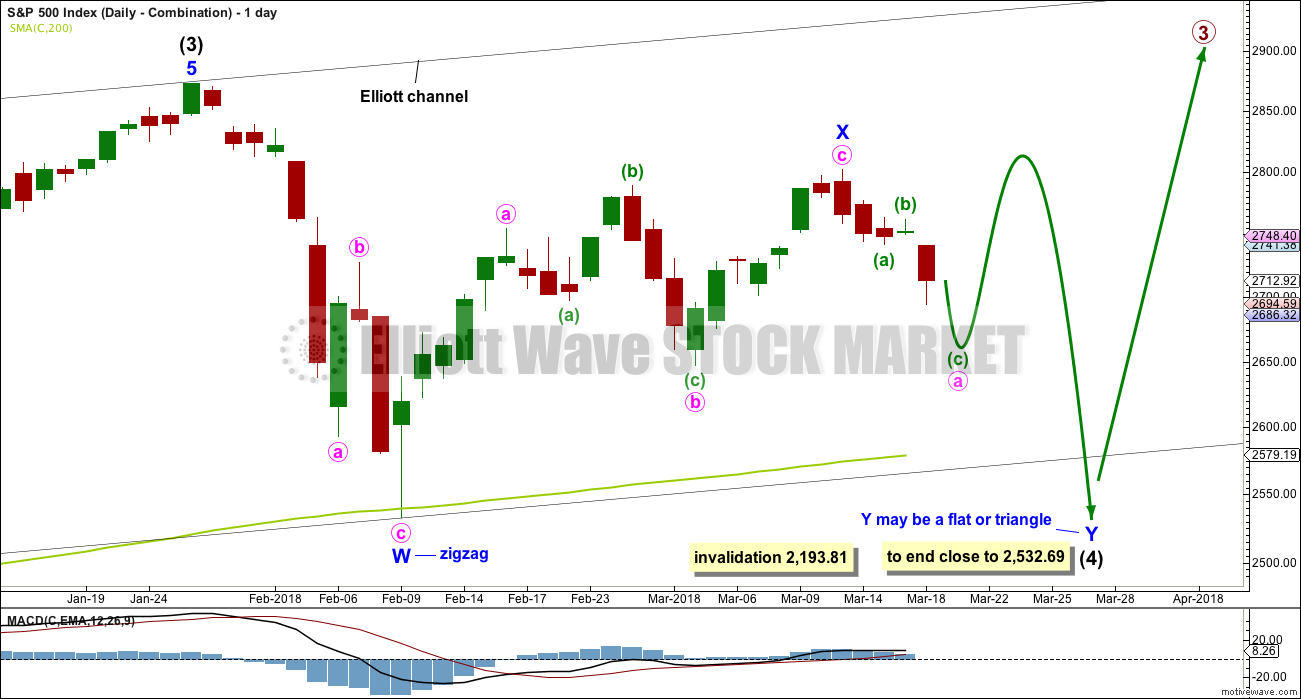
Double combinations are very common structures. The first structure in a possible double combination for intermediate wave (4) would be a complete zigzag labelled minor wave W. The double should be joined by a three in the opposite direction labelled minor wave X, which may be a complete zigzag. X waves within combinations are typically very deep; if minor wave X is over at the last high, then it would be a 0.79 length of minor wave W, which is fairly deep giving it a normal look. There is no minimum nor maximum requirement for X waves within combinations.
The second structure in the double would most likely be a flat correction labelled minor wave Y. It may also be a triangle, but in my experience this is very rare.
A flat correction would subdivide 3-3-5. Minute wave a must be a three wave structure, most likely a zigzag. When minute wave a is complete, then minute wave b must retrace a minimum 0.9 length of minute wave a and may make a new high above the start of minute wave a at 2,801.90, if minor wave Y is the most common flat correction.
The purpose of combinations is to take up time and move price sideways. To achieve this purpose the second structure in the double usually ends close to the same level as the first. Minor wave Y would be expected to end about the same level as minor wave W at 2,532.69. This would require a strong overshoot or breach of the 200 day moving average, which looks unlikely.
HOURLY CHART
Click chart to enlarge.
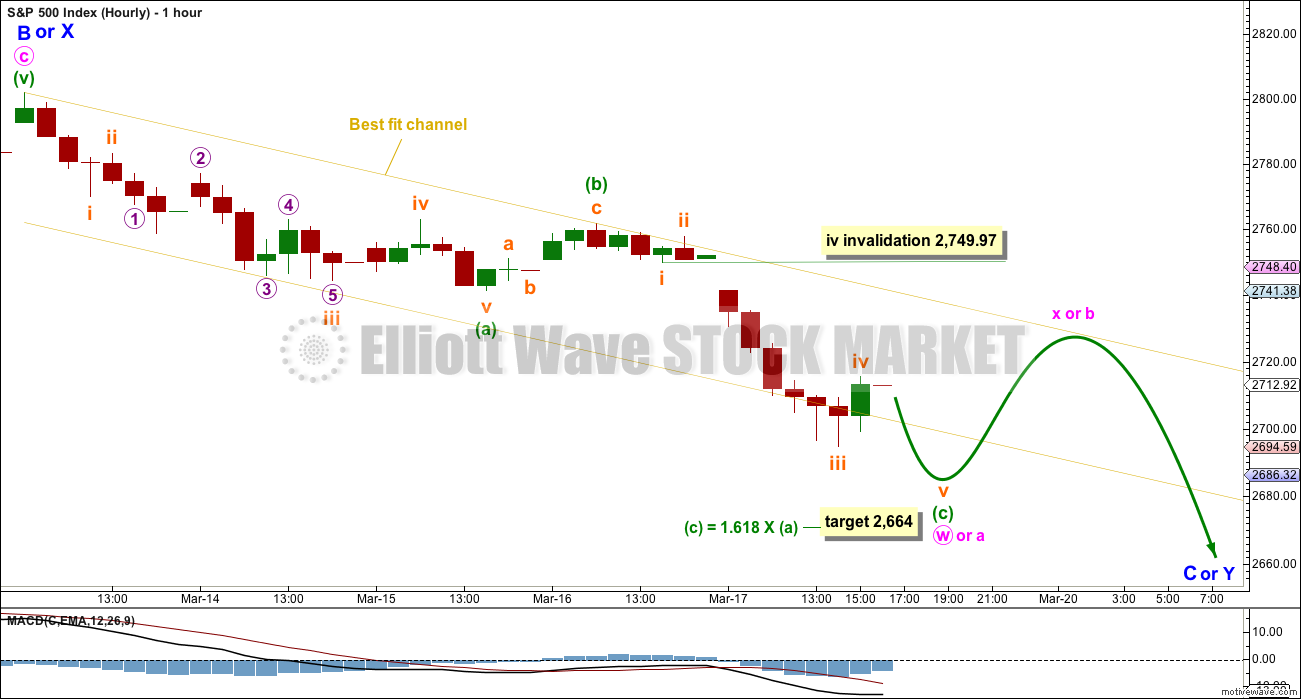
At this stage, both the triangle and combination daily wave counts expect a zigzag is unfolding lower, which would be labelled minute wave w for the triangle and minute wave a for the combination. One hourly chart will suffice for both ideas.
When minute wave w or a is complete, then the two daily charts diverge.
Minute wave x for the triangle may find resistance about the upper edge of the best fit channel. It may be deep, but it should not make a new high above the start of minute wave w. Triangles normally adhere very well to their trend lines; minute wave x should find strong resistance about the B-D trend line (which cannot yet be drawn, but should have a flat or downwards slope).
For the flat correction (minor wave Y within a combination), minute wave b should be very deep and must be a minimum 0.9 of minute wave a. It may make a new high above the start of minute wave a as in an expanded flat; these are the most common types of flats, so this is fairly likely.
There is a little room before On Balance Volume finds support, which may be reached tomorrow or possibly the day after and may assist to halt the fall in price.
Within minuette wave (c) of the zigzag, subminuette wave iv may not move into subminuette wave i price territory above 2,749.97. When minuette wave (c) is complete, then this invalidation point no longer applies.
DAILY CHART – FLAT
Click chart to enlarge.
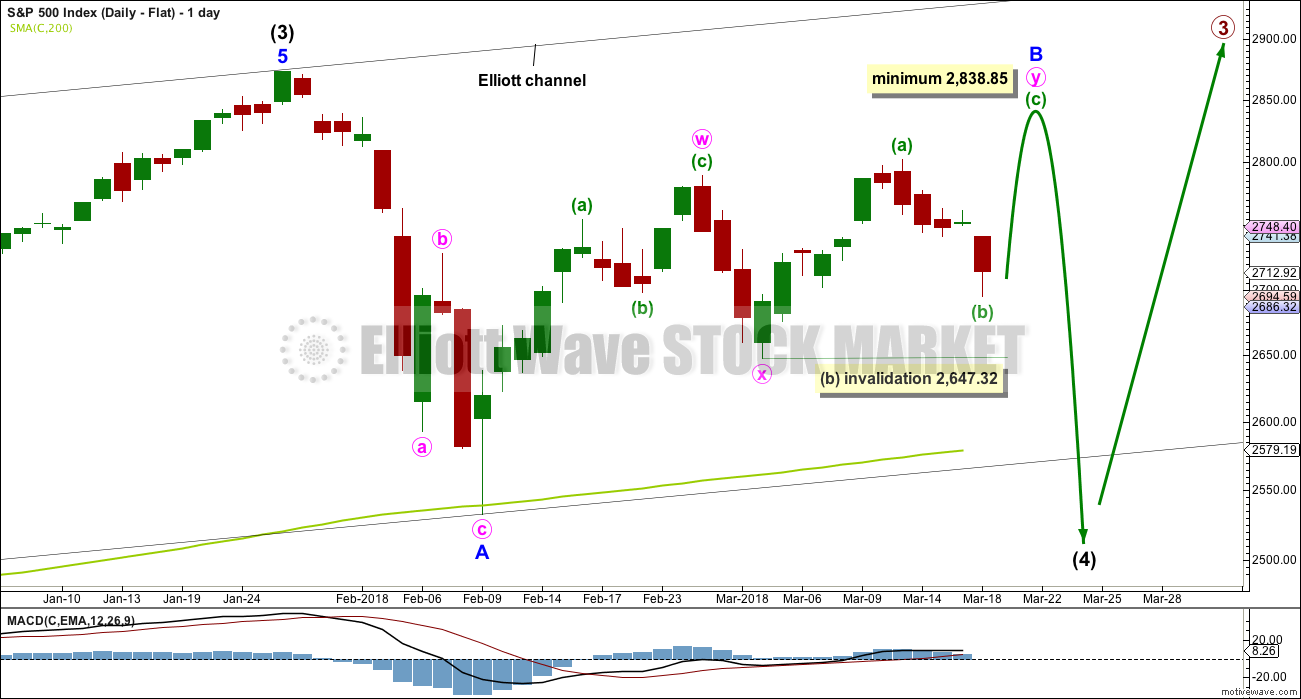
Flat corrections are very common. The most common type of flat is an expanded flat. This would see minor wave B move above the start of minor wave A at 2,872.87.
Within a flat correction, minor wave B must retrace a minimum 0.9 length of minor wave A at 2,838.85. The most common length for minor wave B within a flat correction would be 1 to 1.38 times the length of minor wave A at 2,872.87 to 3,002.15. An expanded flat would see minor wave B 1.05 times the length of minor wave A or longer, at 2,889.89 or above.
When minor wave B is a complete corrective structure ending at or above the minimum requirement, then minor wave C downwards would be expected to make a new low below the end of minor wave A at 2,532.69 to avoid a truncation.
Minor wave B may be continuing higher as a double zigzag. At this stage, this would be the most likely structure to achieve the height required for minor wave B. Within the second zigzag in the double, minuette wave (b) may not move beyond the start of minuette wave (a) below 2,647.32.
This wave count would require a very substantial breach of the 200 day moving average for the end of intermediate wave (4). This looks unlikely.
HOURLY CHART – FLAT
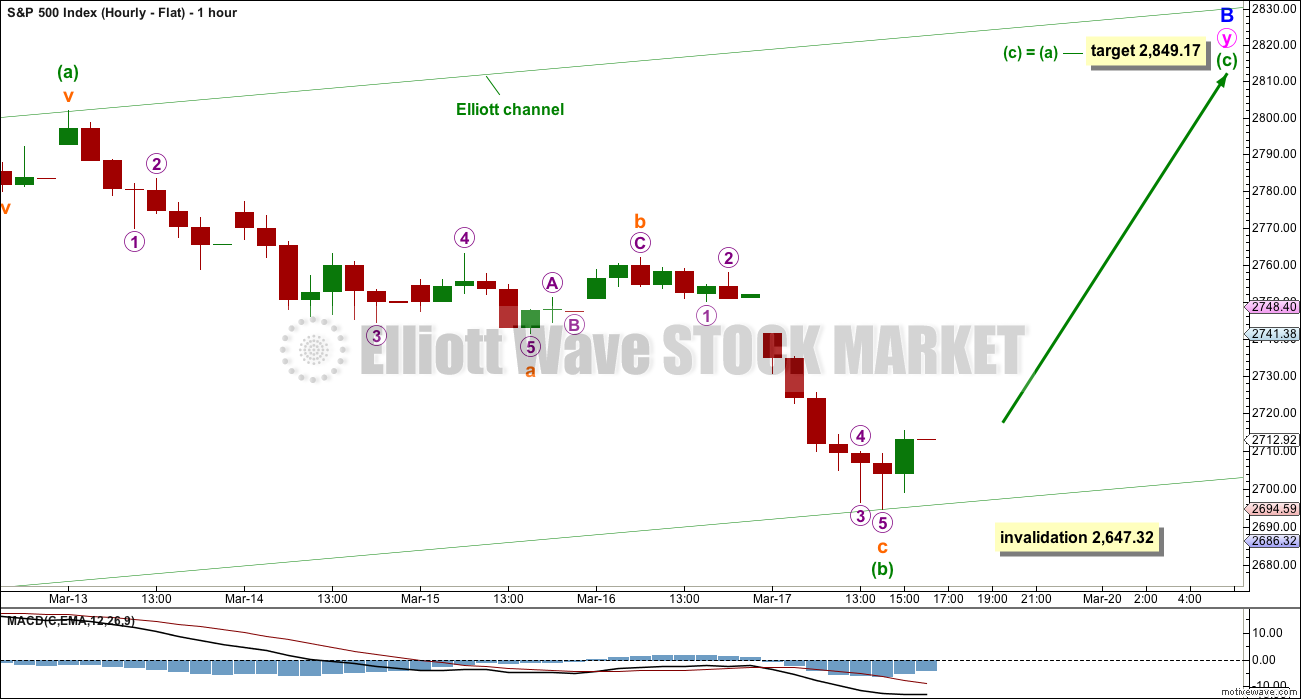
Click chart to enlarge.
If minor wave B is unfolding higher as a double zigzag, then within it minuette wave (b) would very likely be complete at today’s low. A target is calculated assuming the most common Fibonacci ratio between minuette waves (a) and (c). If minuette wave (b) moves lower, then this target must also move correspondingly lower.
DAILY CHART – ALTERNATE
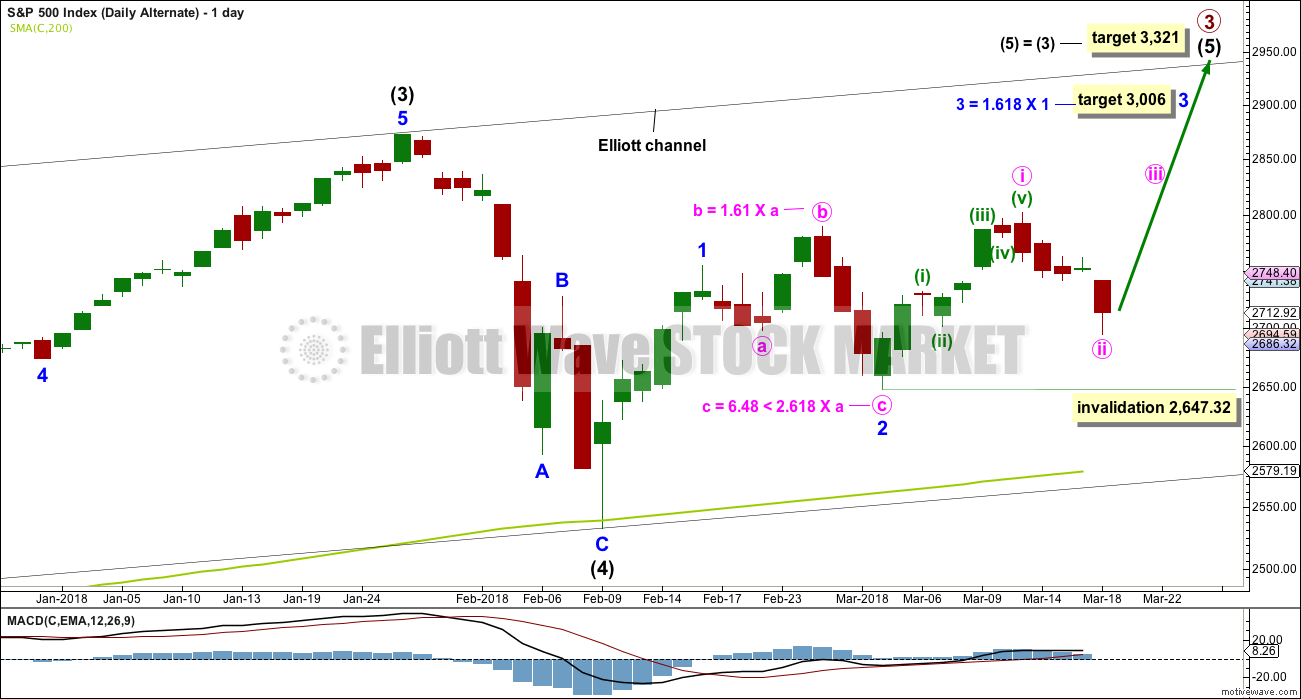
Click chart to enlarge.
It is possible still that intermediate wave (4) was complete as a relatively brief and shallow single zigzag.
A new all time high with support from volume and any one of a bullish signal from On Balance Volume or the AD line would see this alternate wave count become the main wave count.
Within minor wave 3, minute wave ii may not move beyond the start of minute wave i below 2,647.32.
This first alternate expects minor wave 1 was an impulse. With the second alternate idea of a leading diagonal today invalidated, an impulse beginning upwards for intermediate wave (5) now remains the only valid structure of intermediate wave (4) being over.
TECHNICAL ANALYSIS
WEEKLY CHART
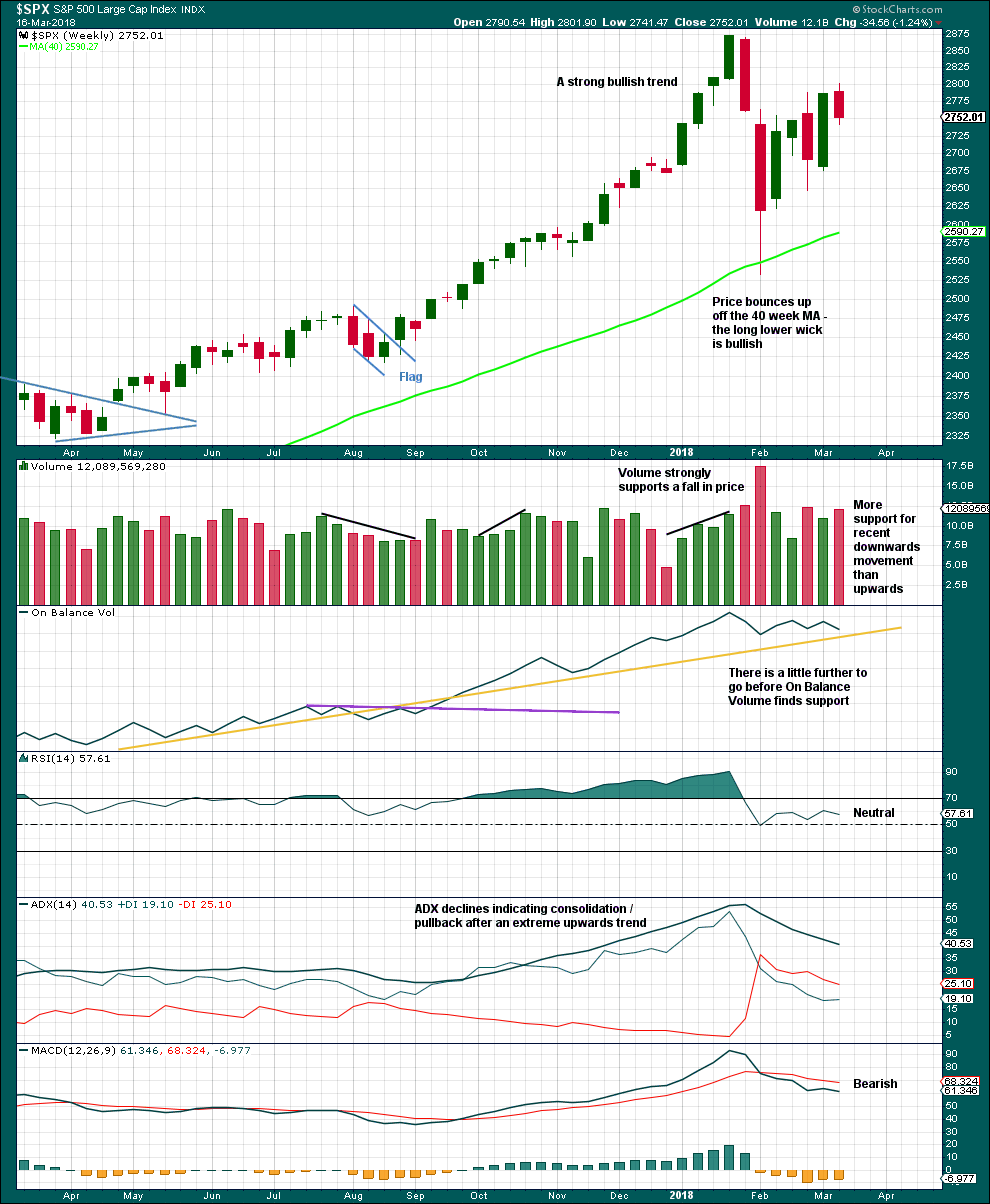
Click chart to enlarge. Chart courtesy of StockCharts.com.
Last week moved price higher with a higher high and a higher low, but the candlestick is red and the balance of volume is down. At this time frame, it looks like there may be more support for downwards movement than upwards within the week, but it would be better to look inside the week at daily volume bars to draw a conclusion.
The pullback has brought ADX down from very extreme and RSI down from extremely overbought. There is again room for a new trend to develop.
DAILY CHART
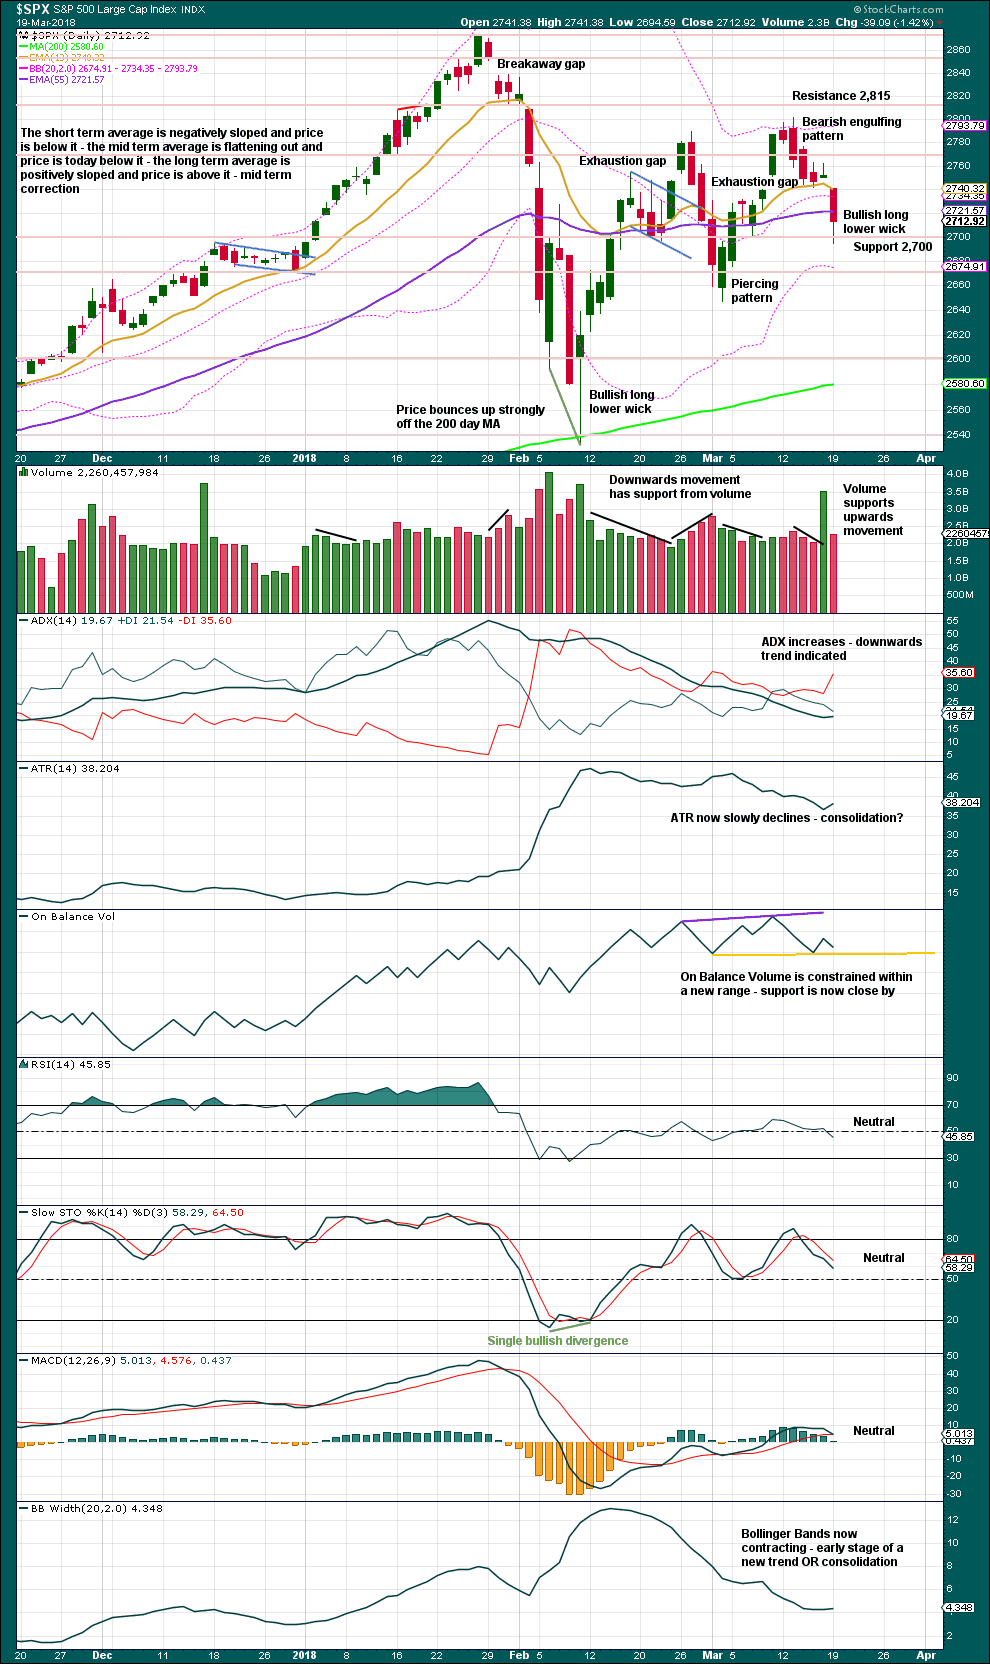
Click chart to enlarge. Chart courtesy of StockCharts.com.
The short term volume profile still remains more bullish than bearish.
However, there was a little more support today for downwards movement from volume than there was for the last two downwards days.
Next support is about 2,670.
The bullish long lower wick suggests downwards movement may be relatively short lived. It could even possibly be over here, but with a little distance to go before On Balance Volume finds support it is also possible price may continue lower for another day or so.
VOLATILITY – INVERTED VIX CHART
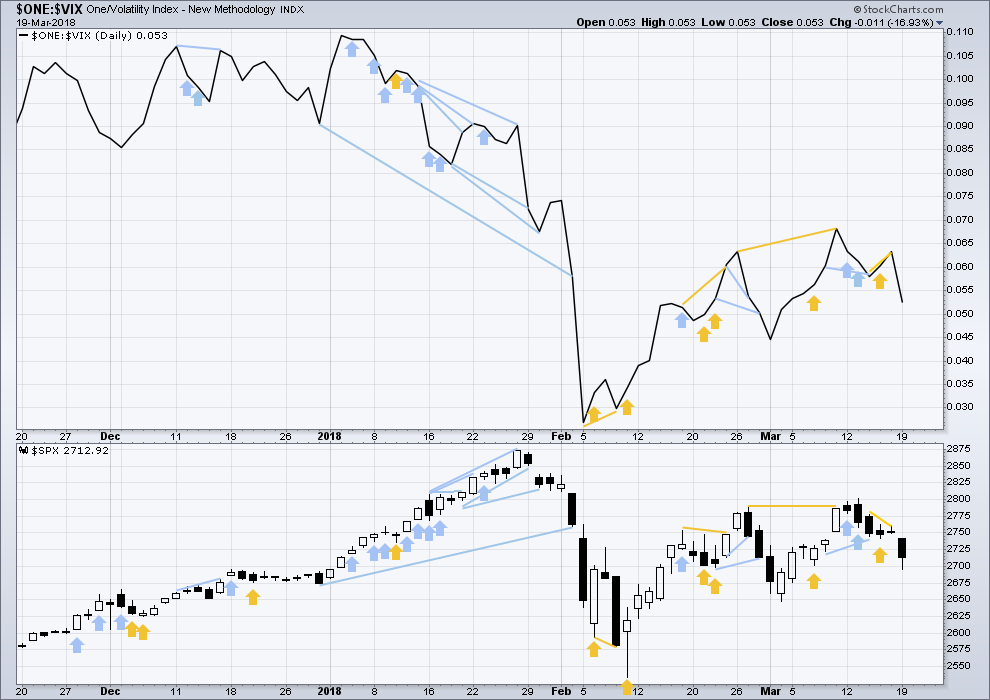
Click chart to enlarge. Chart courtesy of StockCharts.com.
So that colour blind members are included, bearish signals will be noted with blue and bullish signals with yellow.
Normally, volatility should decline as price moves higher and increase as price moves lower. This means that normally inverted VIX should move in the same direction as price.
Bullish divergence in last analysis has been followed by a strong downwards day, so it is considered to have failed. There is no divergence today with both price and inverted VIX moving lower. The fall in price has support from increasing market volatility, which is bearish.
BREADTH – AD LINE
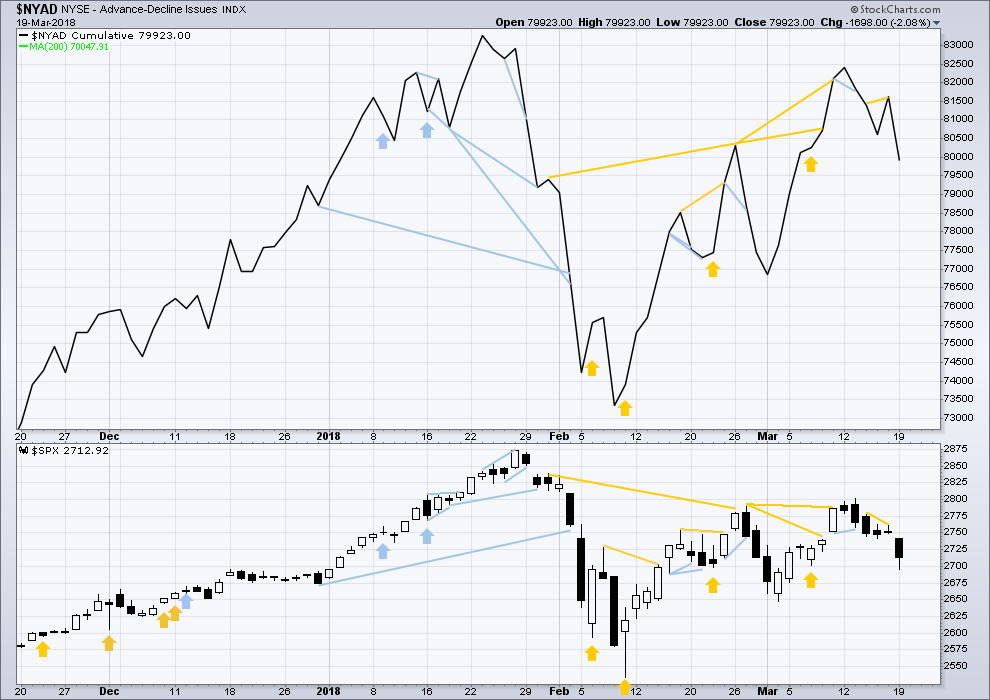
Click chart to enlarge. Chart courtesy of StockCharts.com.
There is normally 4-6 months divergence between price and market breadth prior to a full fledged bear market. This has been so for all major bear markets within the last 90 odd years. With no longer term divergence yet at this point, any decline in price should be expected to be a pullback within an ongoing bull market and not necessarily the start of a bear market.
All of small, mid and large caps last week completed an outside week. All sectors of the market at this time appear to be in a consolidation.
Breadth should be read as a leading indicator.
Bullish divergence noted in last analysis has been followed by a very strong downwards day, so it is considered to have failed. The fall in price today has support from falling market breadth, which is bearish. There is no new divergence today.
DOW THEORY
All indices have made new all time highs as recently as eight weeks ago, confirming the ongoing bull market.
The following lows need to be exceeded for Dow Theory to confirm the end of the bull market and a change to a bear market:
DJIA: 17,883.56.
DJT: 7,039.41.
S&P500: 2,083.79.
Nasdaq: 5,034.41.
Charts showing each prior major swing low used for Dow Theory are here.
Published @ 11:17 p.m. EST.
Today was another good day to straddle market price. There is always an emotional reaction to FEDSPEAK. The initial reaction is also generally quite short lived so tomorrow will be a good day to ring the register on directional trades, both bullish and bearish.
Interesting question from Kevin. It seems to me you are raising the question of whether one aspires to be a day, swing, or position trader.
In my humble opinion, I don’t think trading style matters that much. The ingredients for success are common to all trading styles, namely, getting the trend right, proper position sizing, disciplined stop losses, AND, predetermined profit targets.
Another important but little remembered item is the fact that the market does not ALWAYS trend. Traders are generally surprised when they learn what percentage of the time markets actually trend. Most do not have a strategy for trading sideways markets, which is what happens a significant percentage of the time.
Just my two pence!
I am curious. Anyone else positioned for both directions tomorrow?
If so, what yer trading? 🙂
p.s btw, some of us have solved the trader identity problem by having three separate accounts!
If I’m able to reasonably “predict” the future of “today” (few minutes to hours, same day) at some percentage of success (let’s say…65% of the time), and my ability to predict the future beyond one day is probably…35%…20%? Worse? Not that I’M worse; same tools and techniques. But the variability of the future probably grows exponentially with time I would expect, and if so, prediction accuracy must fall off a cliff with larger time predictions. Leading me to wonder, does it not make sense to use larger bets on the short term trades (I need income), and just eliminate the longer term trade attempts (which always come with deeper stops etc.)? Just thinking out loud….comments welcome. ALSO note: short term trade accuracy can be much more quickly measured and tracked re: succcess rate. The more statistical data showing a positive expectation, the more confidence of betting larger. Interesting….(and obvious perhaps?).
I’ve pondered this a lot too, Kevin, with pretty much the same thought process. Still somewhat unsettled myself.
Updated hourly chart for the triangle or combination idea:
For the triangle a zigzag may now be complete. OR I’m going to have to also now publish an incomplete impulse. Both ideas look pretty much the same in terms of expected direction. Wave X within a double zigzag should be relatively brief and shallow.
For the combination idea a zigzag down may now be complete. Minute b would need to now be very high, 0.9 X minute a.
Look out for resistance at the upper trend line of the best fit channel, in the first instance. If price can overcome resistance there then look for a release of energy and possibly a strong bounce.
Very useful and timely info, thank you Lara.
Yep… that helps. Thanks, Lara!
My morning call was for a relative high around 3:05 eastern. It’s setting up well…
50% fibo at 2729, and two (62 and 38%’rs) at 2735.5 and 2737 (or thereabouts). And there’s the downtrend line looming in the 2732-30 zone. Watching carefully for a turn and short term sell triggers, the day’s highs are also right here at 2722 or so. Sure looking a bit like a big A-B-C off of yesterday’s low to me.
Boy oh boy, currencies and gold are difficult (“bad” for trading) instruments right now. Sideways chop with no overall movement up or down for weeks, I’m DONE with them until some trends develop. Time to update the trading plan about staying away from daily level sideways narrow range choppy markets like those…
…like today in $SPX! (At least so far.) We’ve seen this before during Fed meetings, then POW!
Looking at my 30-minute chart, it’s hard to anticipate whether it will break up or down. Here’s where Verne’s straddle options trade might be the thing to do…
Wait for fomc
Hi Kevin
i don’t think you will see to much action in the SPX at the moment until the fed meeting tomorrow.
I would be surprised if we see any big moves until then.
Just sideways plus or minus 10 points.
Does anyone other than me wonder if the market move down starting the last Thursday is a 5 wave structure, rather than ABC as generally modelled by Lara? Implying the current move up today is wave 4 up, it’s probably getting close to it’s likely highs now…and wave 5 down is right around the corner??? My worries increase about that kind of thing when I hold a bunch of longs in the green as I do at the moment…
That is my basic view that we are finishing up wave 4 and beginning wave 5 down today / tomorrow. Today we basicly retraced 61.8 % of yesterdays move and reversed. I loving for a move down to the 163.5 area on the QQQ and the 267 level on SPY. But who knows with the FOMC it may be a grind up into that.
And the high today is just about at the 38% of the low yesterday to the sideways highs of late last week. Very nice geometry! I’ve small shorts on and will add if/when the action downward starts moving. I consider invalidation of those trades as any pop here to fresh daily highs. Pretty decent risk/reward I think.
I see an A up, an expanding flat B, and a C up in progress today so far. If C = A, then the turn point will be a 62% fibo around 2737. Just below that zooming down is the downtrend line starting at the March 13 high. So if this keeps climbing, that’s a high potential turn zone. I’d estimate a final high for the day about…3:05 pm, projecting out some short term high-high timings.
The other possibility is of course that the high of the day is in. Let’s face it, the market isn’t likely to move much anticipating the FOMC meeting tomorrow, I suspect.
That’s entirely possible, and another idea I’ll have to publish today as it’s now time.
In terms of expected direction for the triangle idea, it doesn’t differ.
The new format acts as an index….very helpful
Excellent. Yes, it is easier to find stuff.
The sidebar is still here too, just not on the home page.
First? Can folks not find this post with the new format?
No problem at all finding it.
We can find it, Lara. No problem. It was a late night of meetings for me and I did not have the energy to check the updates. And I just don’t want to get up at 4:49 AM Eastern Daylight Savings Time to try to be first, which is 1:49 AM my time!
You win and you deserve it. Give yourself an extra dessert today!
Brilliant! I did have ice-cream…. so yeah, winning