
Another upwards day has completed as expected.
Short term indications from volume and Friday’s candlestick signal what may happen for the start of the new trading week.
Summary: The next target is at 3,020.
Look out for a second wave correction early next week that may end about either 2,670 or 2,617. Thereafter, the upwards trend should resume.
Always practice good risk management. Always trade with stops and invest only 1-5% of equity on any one trade.
The biggest picture, Grand Super Cycle analysis, is here.
Last historic analysis with monthly charts is here. Video is here.
An alternate idea at the monthly chart level is given here at the end of this analysis.
An historic example of a cycle degree fifth wave is given at the end of the analysis here.
MAIN ELLIOTT WAVE COUNT
WEEKLY CHART
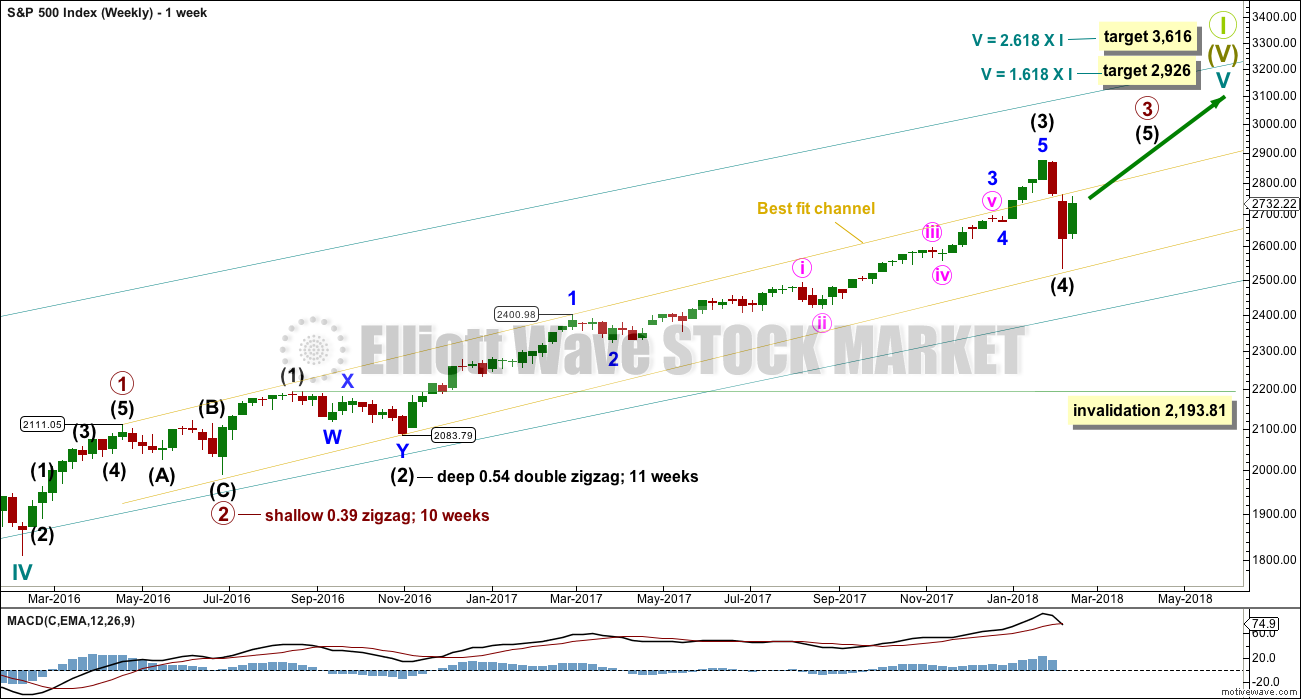
Click chart to enlarge.
Cycle wave V must complete as a five structure, which should look clear at the weekly chart level. It may only be an impulse or ending diagonal. At this stage, it is clear it is an impulse.
Within cycle wave V, the third waves at all degrees may only subdivide as impulses.
Due to its size intermediate wave (4) looks proportional to intermediate wave (2), even though their durations so far are quite different.
Intermediate wave (4) has breached the Elliott channel drawn using Elliott’s first technique. The channel may be redrawn when it is confirmed as complete using Elliott’s second technique. A best fit channel is used while it may still be incomplete to show where it may find support. Price points are given for this channel, so that members may replicate it on a semi-log scale.
Intermediate wave (4) may not move into intermediate wave (1) price territory below 2,193.81.
DAILY CHART
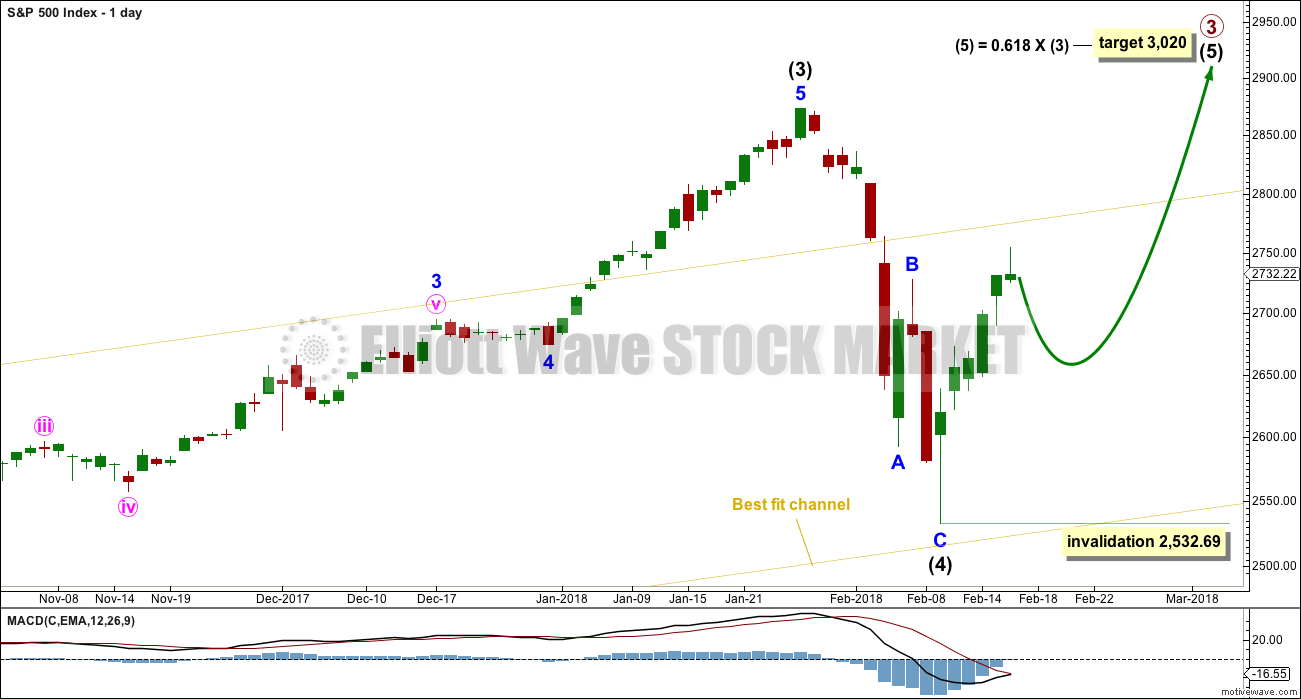
Click chart to enlarge.
The S&P has behaved like a commodity to end intermediate wave (3): a relatively strong fifth wave with a steep slope. The high looks a little like a blow off top. This is followed by a sharp decline, which is typical behaviour for a commodity and not common for the S&P.
The very long lower wick on the candlestick at the end of intermediate wave (4) is strongly bullish. It looks like intermediate wave (4) may have ended there.
Despite the duration of intermediate wave (4) being much quicker than intermediate wave (2), the size is proportional. On weekly and monthly time frames intermediate wave (4) now has the right look.
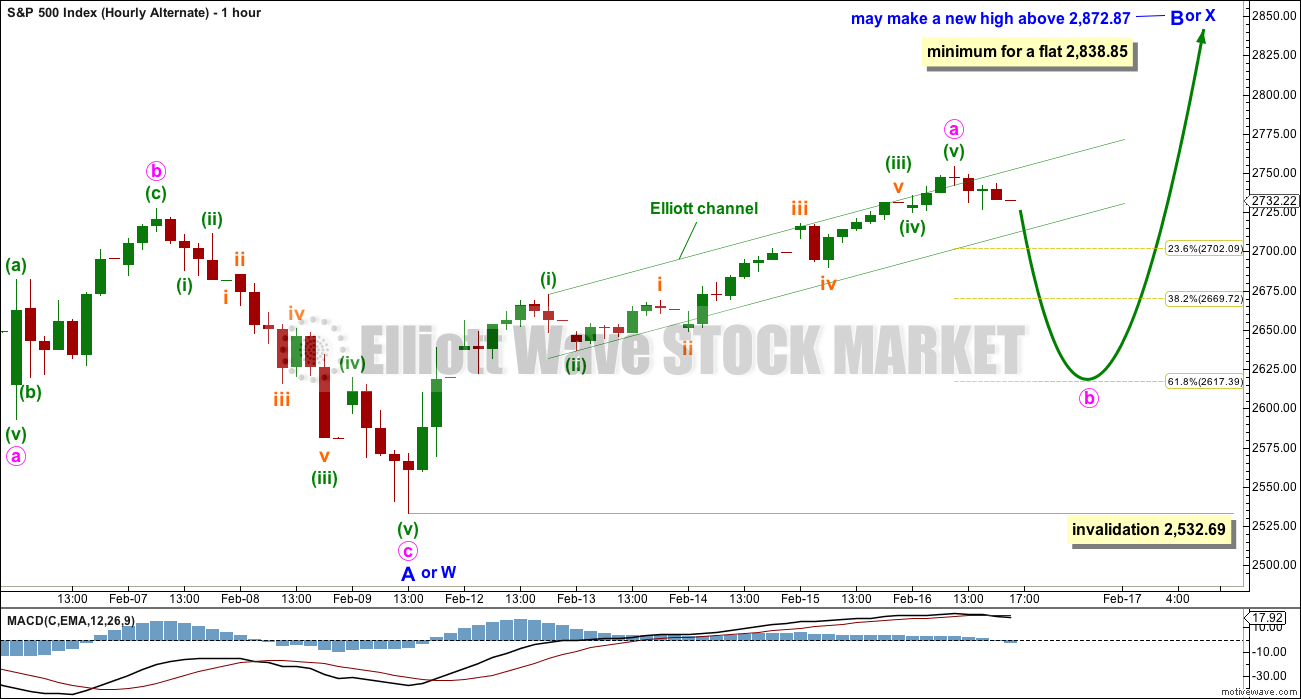
The downwards wave labelled intermediate wave (4) may be seen as either a three wave zigzag, as labelled on this daily chart, or it may be seen as a five wave impulse. Both possibilities must be considered. The main hourly and alternate hourly charts consider it as a zigzag. The second alternate hourly chart considers it may have been a five.
HOURLY CHART
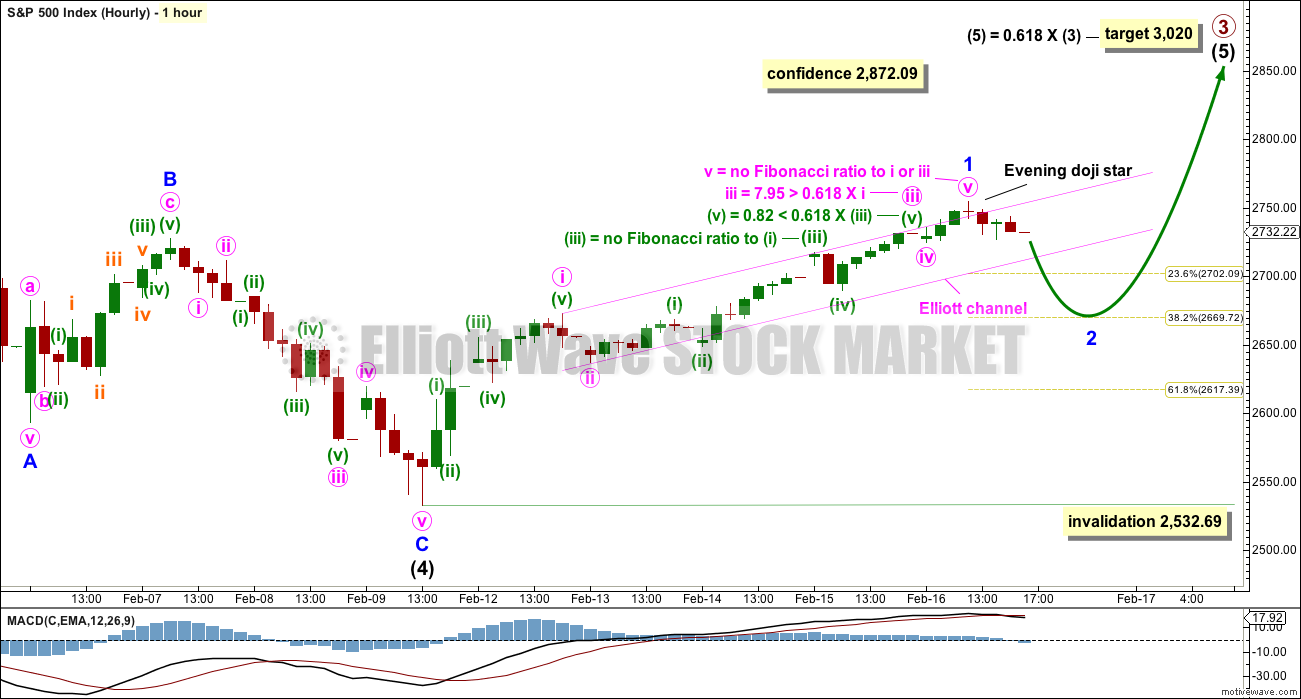
Click chart to enlarge.
A zigzag downwards may now be complete.
A new all time high would add confidence to this wave count (even though an alternate idea published would remain valid).
A five up off the low may now be complete. This may be minor wave 1 within intermediate wave (5). If this analysis of the bounce as a complete five is correct, then it should be followed by a three down for minor wave 2.
Minor wave 2 may correct to either the 0.382 or 0.618 Fibonacci ratios. Because a persistent feature of this bull market is relatively brief and shallow corrections do not be surprised if minor wave 2 reaches only the 0.382 Fibonacci ratio.
Minor wave 2 may not move beyond the start of minor wave 1 below 2,672.61.
ALTERNATE DAILY CHART
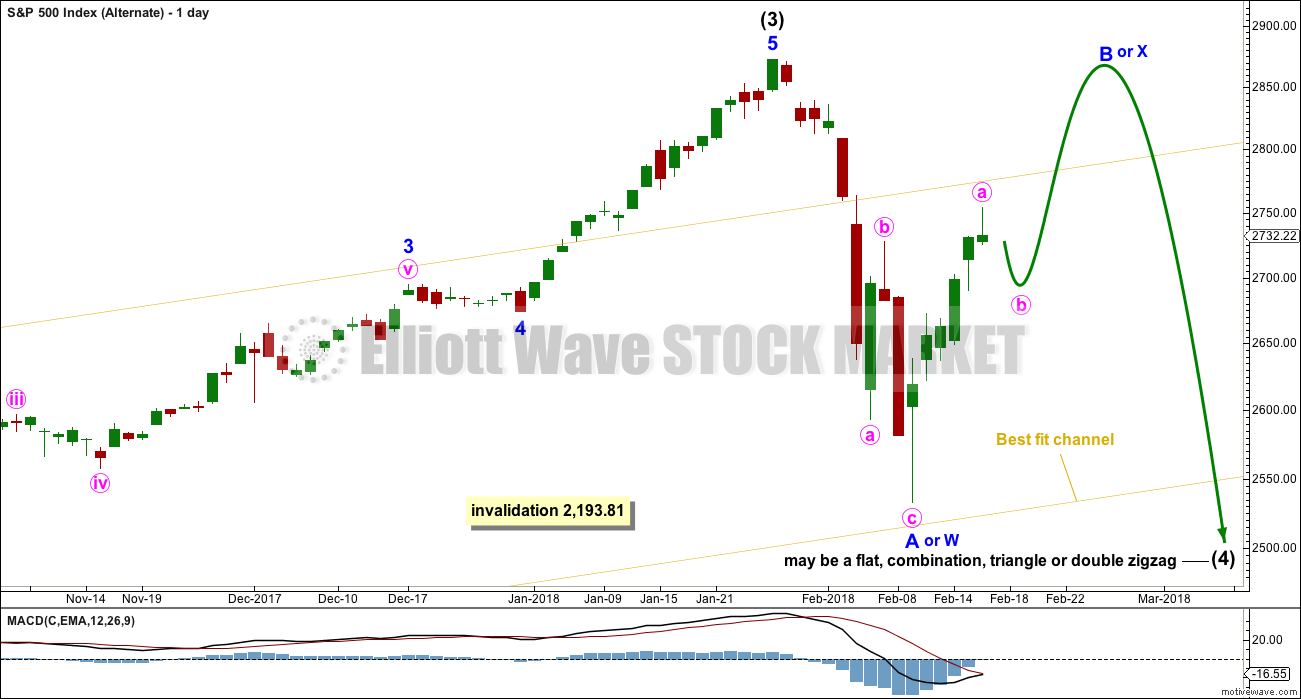
Click chart to enlarge.
This wave count is identical to the main daily chart, with the exception of the degree of labelling within intermediate wave (4). If the degree is moved down one, then only minor wave A may be complete within a continuing correction for intermediate wave (4).
If it continues further, and if analysis of minor wave A as a zigzag is correct, then intermediate wave (4) may be a flat, combination, triangle or double zigzag. Of all of these possibilities a double zigzag is the least likely because that was the structure of intermediate wave (2). Intermediate wave (4) should be assumed to exhibit alternation until proven otherwise.
If upwards movement continues further, then the idea of a double zigzag may be discarded. Double zigzags normally have a strong slope against the prior trend, and to achieve a strong slope their X waves are usually shallow.
All of a flat, combination or triangle would have a very deep minor wave B. An expanded flat, running triangle or combination may have minor wave B or X make a new all time high. Unfortunately, for this reason there is no upper price point which differentiates this alternate idea from the main wave count.
Minor wave B or X should be expected to exhibit weakness. Light and declining volume and divergence with oscillators at its end are features of B waves, and also of X waves which are analogous.
Minor wave B or X may be any one of more than 23 possible corrective structures, but it would most likely be a zigzag.
ALTERNATE HOURLY CHART
Click chart to enlarge.
The labelling of subdivisions for this alternate is identical to the main wave count. The degree of labelling within the last zigzag down is moved down one degree.
Upwards movement off the low may be a zigzag for minor wave B. Zigzags subdivide 5-3-5, exactly the same as the start of an impulse.
If intermediate wave (4) is a flat correction, then within it minor wave B must retrace a minimum 0.9 length of minor wave A.
If intermediate wave (4) is a triangle, there is no minimum requirement for minor wave B. It only needs to subdivide as a three wave structure.
If intermediate wave (4) is a combination, then the first structure may be a zigzag for minor wave W. Minor wave X may be any corrective structure and it may make a new high above the start of minor wave W. There is no minimum requirement for minor wave X of a combination, but it would very likely be fairly deep.
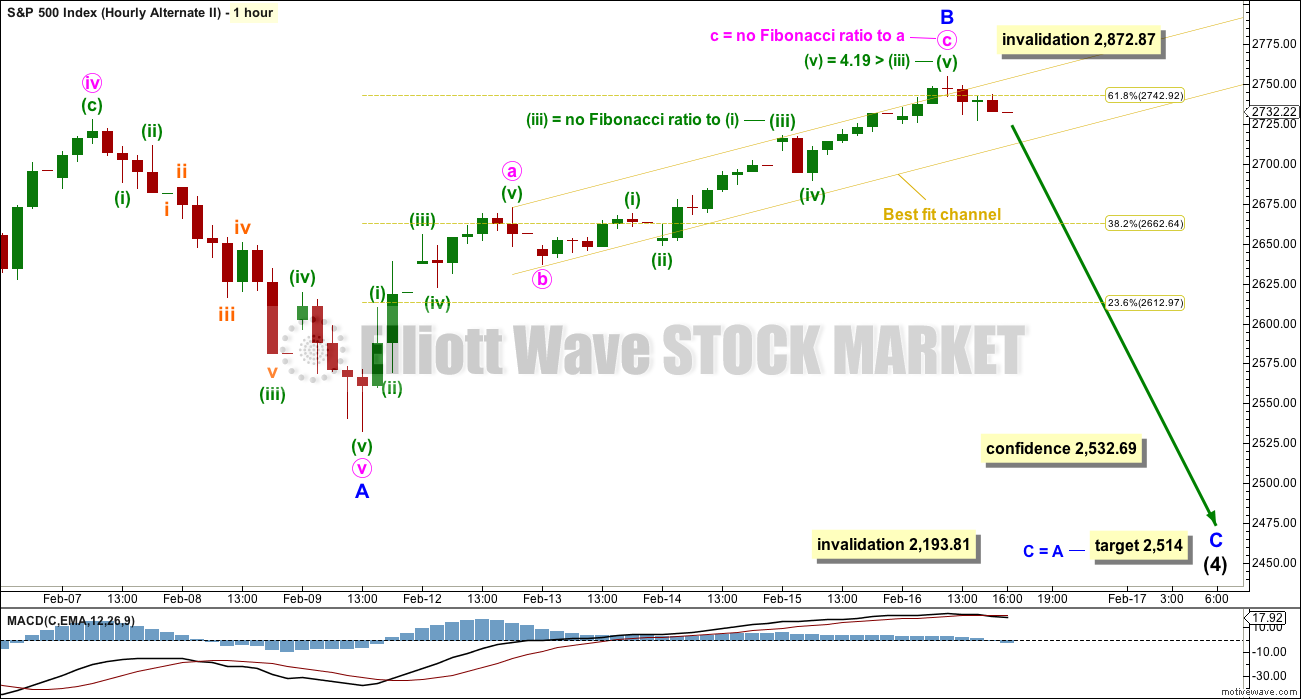
Minor wave B or X may be unfolding as a zigzag. So far, within minor wave B or X, minute wave a may be a complete five wave impulse. Minute wave b may correct to either the 0.618 or 0.382 Fibonacci ratios. Minute wave b may not move beyond the start of minute wave a below 2,532.69.
SECOND ALTERNATE HOURLY CHART
Click chart to enlarge.
It is also possible to see the last downwards wave as a five wave impulse. Intermediate wave (4) may be continuing lower as a single zigzag, subdividing 5-3-5.
Within a zigzag, minor wave B may not make a new high above the start of minor wave A at 2,872.87.
Minor wave B may be now complete ending close to the 0.618 Fibonacci ratio of minor wave A.
The yellow best fit channel as it was drawn previously was not proving very useful. It is redrawn here to be the same as the Elliott channels on the first two hourly charts. If this channel is breached by downwards movement, then it may indicate the upwards bounce is over, at least temporarily, and a new wave down may be underway.
TECHNICAL ANALYSIS
WEEKLY CHART
Click chart to enlarge. Chart courtesy of StockCharts.com.
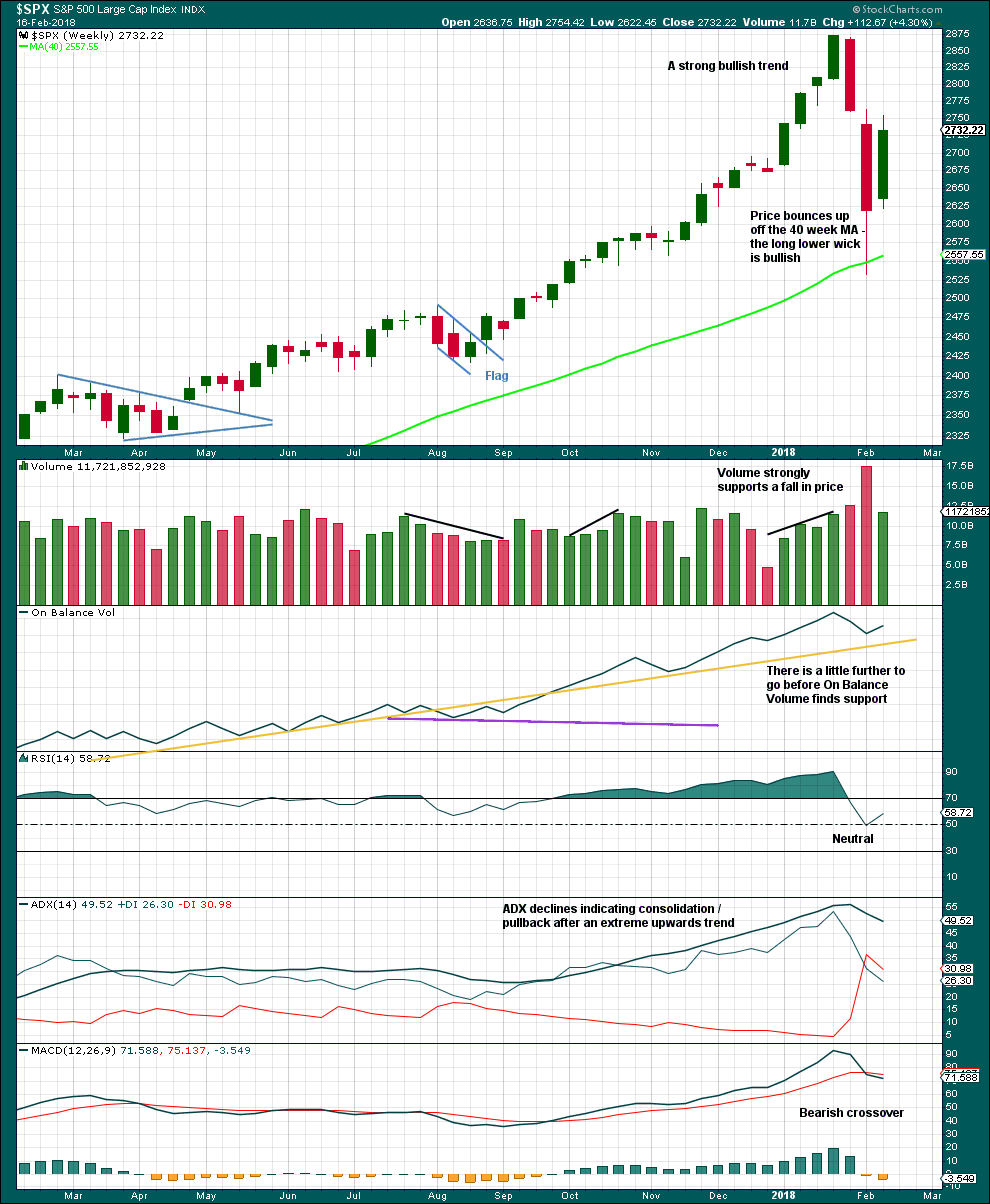
Volume this week is much lower than the last downwards week, which is bearish, but it is stronger than the previous four upwards weeks, which is bullish.
There is nothing bearish about this weekly candlestick.
The pullback has brought ADX down from very extreme. A possible trend change to down is indicated, but as yet no new trend is indicated.
DAILY CHART
Click chart to enlarge. Chart courtesy of StockCharts.com.
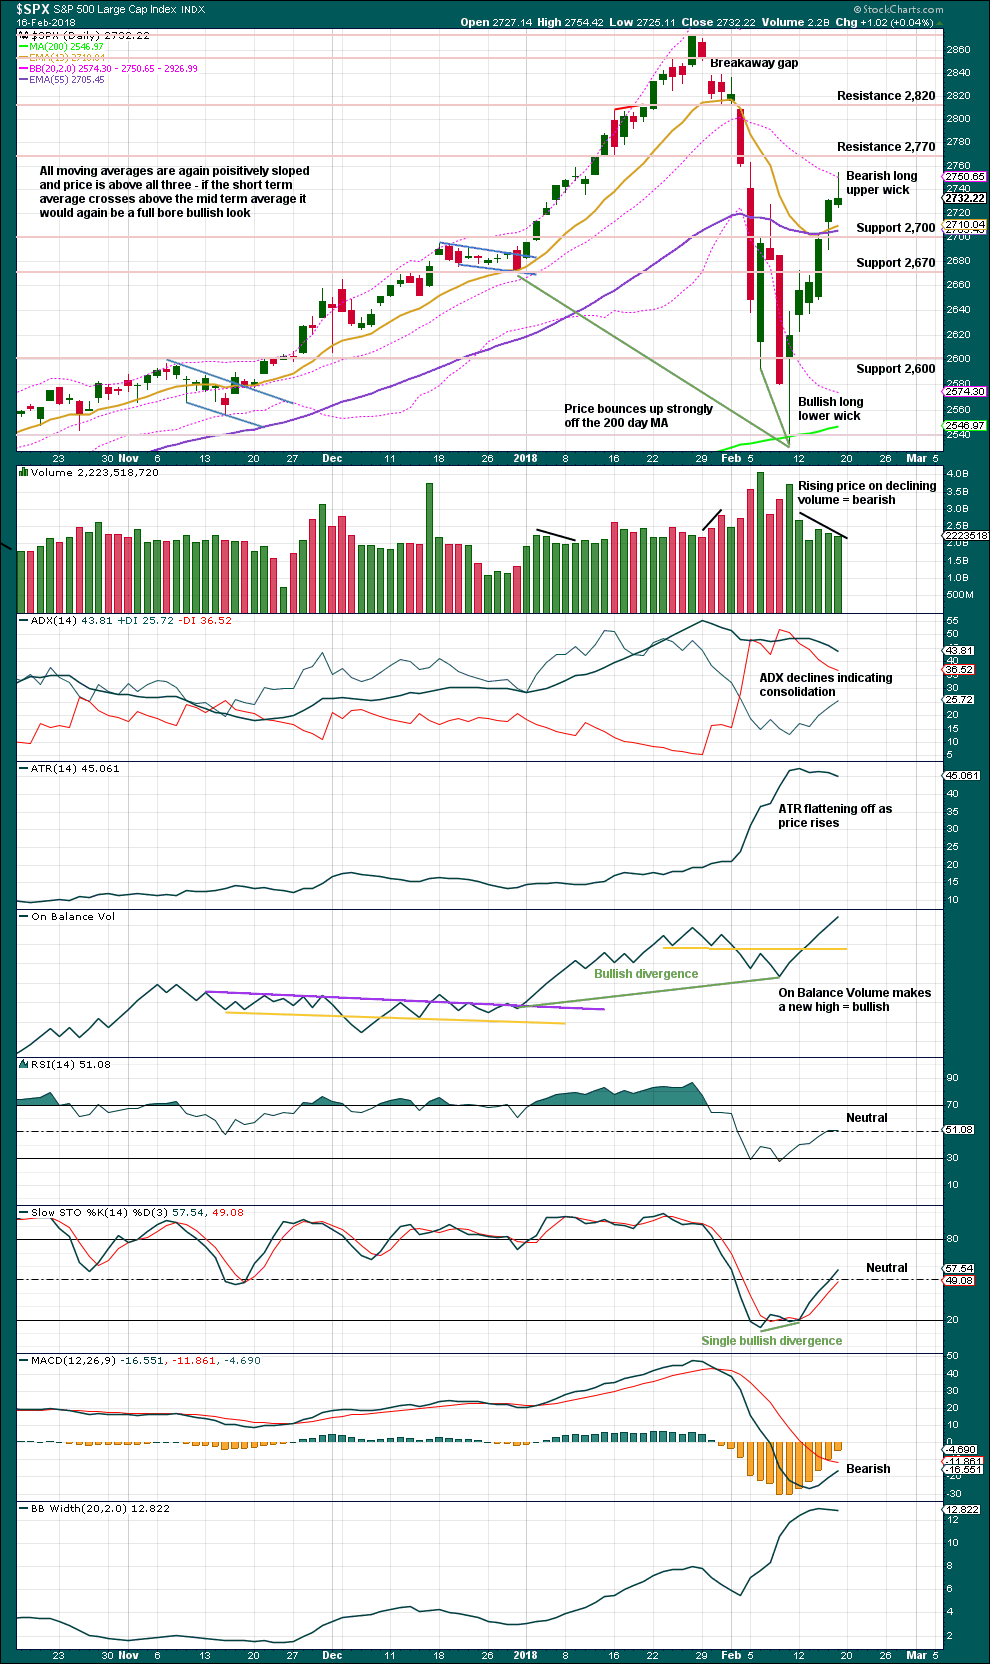
The long upper wick for Friday’s candlestick is bearish and indicates some downwards movement at least for Monday if not into the middle of next week.
Weak volume has long been a feature of this bull market. The decline in volume with rising price would normally be a concern for bulls, but at this stage it will not be given much weight even though it does support some pullback here.
On Balance Volume remains very bullish.
VOLATILITY – INVERTED VIX CHART
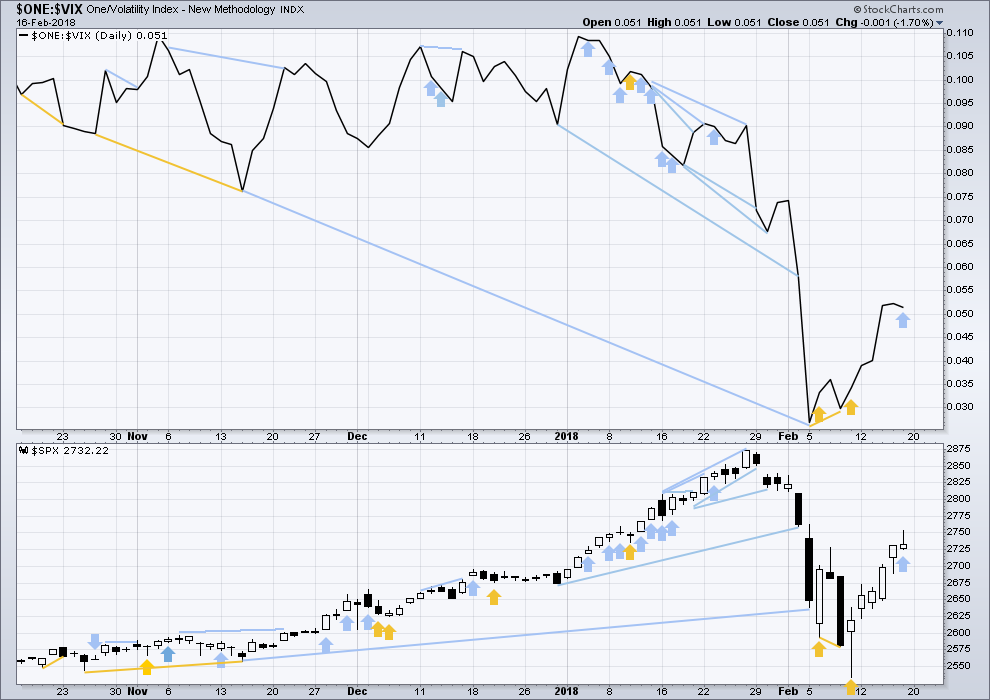
Click chart to enlarge. Chart courtesy of StockCharts.com.
So that colour blind members are included, bearish signals will be noted with blue and bullish signals with yellow.
Normally, volatility should decline as price moves higher and increase as price moves lower. This means that normally inverted VIX should move in the same direction as price.
Although price moved higher for Friday inverted VIX did not. The rise in price has not come with a normal decline in market volatility. The increase in volatility on Friday is bearish at least for the short term.
BREADTH – AD LINE
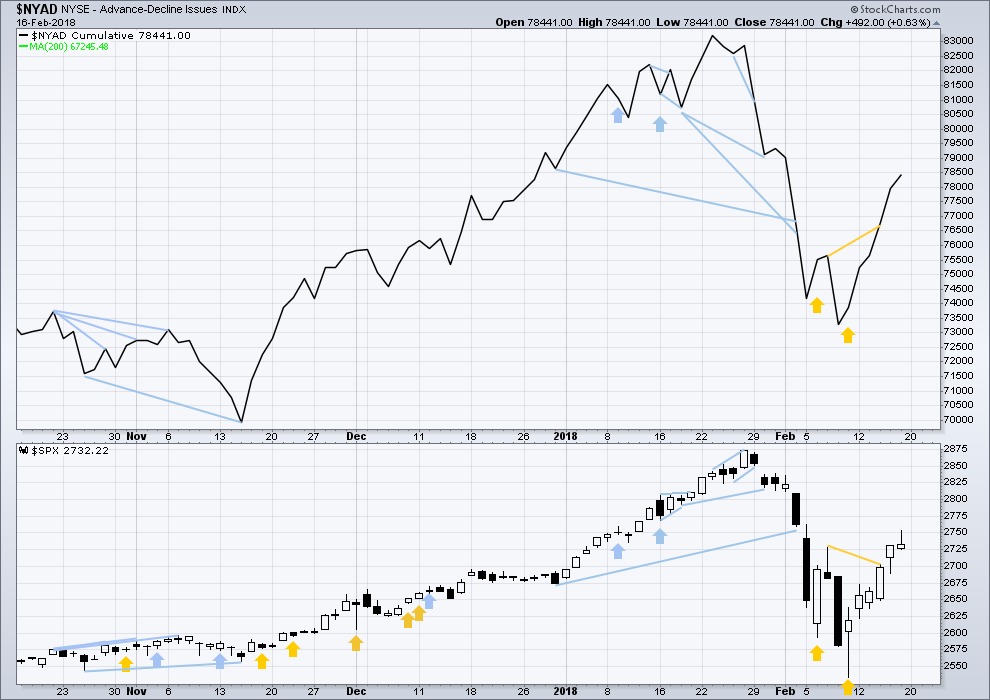
Click chart to enlarge. Chart courtesy of StockCharts.com.
There is normally 4-6 months divergence between price and market breadth prior to a full fledged bear market. This has been so for all major bear markets within the last 90 odd years. With no longer term divergence yet at this point, any decline in price should be expected to be a pullback within an ongoing bull market and not necessarily the start of a bear market.
All of small, mid and large caps this week moved higher. The bounce has support from wide breadth. They all also have long upper wicks on their daily candlesticks for Friday.
Breadth should be read as a leading indicator.
Both price and the AD line moved higher on Friday. The rise in price has support from rising market breadth. This is bullish.
DOW THEORY
All indices have made new all time highs as recently as four weeks ago, confirming the ongoing bull market.
The following lows need to be exceeded for Dow Theory to confirm the end of the bull market and a change to a bear market:
DJIA: 17,883.56.
DJT: 7,029.41.
S&P500: 2,083.79.
Nasdaq: 5,034.41.
Charts showing each prior major swing low used for Dow Theory are here.
Published @ 8:15 p.m. EST on 17th February, 2018.
These people are SO CORRUPT!!
Now news coming out that practically all the buying last week was corporate buy-backs and the CEOs are going running to the FED about rising interest rates and the removal of the FED put. Incredible!
Did you really expect anything different? The FED only answers to the .1 percent. Defaults ticking up, CMBS markets rattling, swaps rising steadily…..it’s a coming 😉
LQD and HYG seeing massive outflows. I had suspicion the trouble would begin in the bond market, and rising interest rates would be the trigger…seems we are close…
Yup, btw I bought Vix calls and UVXY right before close
Should return some nice coin!
Did a nice scalp for a quick double on SPY 270 puts expiring tomorrow.
I had to wait for the move out of the coil but it was worth the wait! 🙂
Nice!!! Apparently Gartman covered his short, so apparently my index shorts entered on the 50 day break are not big enough!!!
Did you hear that Gartman “invested” in Riot Blockchain???!!!
In his RETIREMENT account no less!! I was absolutely howling when I heard that! You can’t make this stuff up I tell ya! 🙂
Yikes!
Did anyone else see that 1450 green print in DJI futures?????
What the HELL was that????!!!
No VIX cap today. More downside tomorrow. Bye all!
Keep a close eye on UVXY. If it closes at the high today tomorrow is gonna be ugly….
Does anyone want to know what C-O-I-L stands for in Verne’s lexicon of trading terms???
🙂 🙂 🙂
Oops! Sorry Lara; posted right over your update!
I believe a coil is a BOING!
Huyk! Hyuk! 🙂
Also…”come on in lemmings!” (the water’s just fine! wink! wink!) 😉
No worries Verne
The Elliott channel may be in the process of being breached. If we can see a good red candlestick close fully below it then it would meet my definition of a breach.
I’ve played with Fibonacci ratios between minute waves a and c and cannot find a calculation that converges on the 0.382 or 0.618 Fibonacci ratios.
If minute a only reaches equality with minute c then minor 2 would end about the 0.236 Fibonacci ratio. So be warned, it is possible that this correction could be that shallow.
Thanks for the update Lara, momentum gathering by the looks of it
Thank you, Lara, for these before-the-close updates. You don’t owe them to us. They’re a most valuable extra, and I appreciate it!
You’re most welcome 🙂 It’s my job to keep you all happy.
🙂 🙂 🙂
It’s taking too long to be a minute 4 so yea, it’s a minor 2. But it’s awfully shallow so far. Time to relax and see what develops from here.
DJI 25K and SPX 2720 need to be decisively taken out to signal the run to the 200 day underway…
The coil shelf should be broken shortly….
The bulls may not like it but the fact of the matter is that they lost the 50 day battle last Friday, plain and simple. Now they are going to be dragged, granted kicking and screaming, to the 200 day where they will have another opportunity to make a stand. I expect the resolution of the coil to be downwards; one of my B&B trades! 🙂
All I know is that while my weekly chart shows a neutral trend…my daily shows a downtrend, my hourly just now switched from neutral to down, and of course the 5 minute is down. If price pushes through this support zone, a lot more down could be in store. Right now, double bottoming off it? It doesn’t fail until it does. Price could go down a fair amount more here and still be in the proper zone for a minute 4, too.
Every trader should have a few patterns that he is extremely confident of trading, regardless of what anyone else is saying. You just don’t find ’em in books unfortunately, but boy, do they serve up some fat pitches! 🙂
TMV is squeezing on the 5 minute Verne.
Started moving down out of squeeze, I insta-took profit.
Rather interesting leading indicator that TMV! I’ve notice the high correllation between TMV and SPX recently in general. Just now it squeezes on the 5 min, starts to suddenly fall, and sure enough, about 2-3 minutes later, there goes SPX.
Something is definitely afoot.
Nimble! 🙂
My first order presumption is that SPX is executing a minuette (or smaller timeframe) ii here. Watching to see the expected turn back up above this morning’s low. If not…reset and back to minute 4 or minor 2! But I’m doubtful that’s going to happen.
Think…C-O-I-L! 🙂
It just looks like there is a contest going on to mislead the gullible…. 🙂
“The lunatic is on the grass…remembering games, and daisy chains and laughs…got to keep the loonies on the path!!!”
Today is looking familiar, like those days last week with gap down opens, a little sell off, then a strong bull run the rest of the day for a large overall up day. We’ll see here.
Pink Floyd?
“Set the controls for the heart of the Sun!”
Be sure to watch the Wizard of Oz to Dark Side of the Moon as soundtrack. Set the disc to auto-repeat, and start it at precisely the start of the 3rd (and final) lion roars. Zero doubt they scored the movie, zero doubt. The number of “coincidences” is staggering (40+??). They had significant experience at that time already doing movie scores. They just won’t admit it because of course the risk that MGM would demand some coin, lol!!
The 2715-2718 support zone has held through one push down, and there’s a swing high exceeded on the 5 minute. 8/34 ema’s are just about to cross. Buy triggers for me…the minute 4 may be over, and there’s a very close and reasonable stop point (today’s low). The presumed minute 5 should take price well above 2755. I like the set up.
I see that too, but just not any of Lara’s charts?
Lara modeled this pullback as a minor 2, with expectation of a deeper sell off here. Last Thursday night’s hourly characterized it as a minute iv, and if price keeps moving upward here, that’s what it’ll be again IMO. Way too shallow so far for a minor 2. It’s got a classic WXY structure with a bounce off a pile of support. Now it’s got to break the downtrend line that’s formed since the high on Friday. If and as that breaks…I think this minute 4 is over.
Once again we have coiling sideways action in futures initiated in a short term down-trend. Odds favor a downside break….
Selling UVXY shares for 17.40. Rolling into 17 strike calls for 1.50.
Not early for stink bids on puts. 🙂
So far, all signs are that this is the final hours of a minute 4 (not a minor 2), and a minute 5 is soon to launch. As long as 2715 holds, that’s it. So far, no sign of any real selling pressure. If 2715 falls and downward momentum picks up..well, there’s actually a lot of room for price to fall here and still be in the minute 4 range. Below 2690 and then we can start talking about a minor 2 in progress…
Actually, we are moving impulsively away from this morning’s gap….trouble for bulls as long as it remains unfilled imho…
????. Sorry, I don’t see any impulse down here at all. Just sideways action on a 5 minute chart this morning, and a zig-zag (or WXY) down as a minute 4…so far. It could start dropping…but nyet. And price hasn’t even reached that 2715-2718 support zone yet. I’m waiting for buy triggers myself.
O.K. 🙂
The NDX bulls have totally lost their minds!
Buying SQQQ…
Appears the insane have control of the asylum.
OK this is what I got….
Fascinating! If you are right, we get a lower spike high in VIX.
Looks like that model was right on!
lol! The story of the short vol trade is just now starting to make its way into the lame stream media. Next thing you know, everybody and his grandma is going to go out and pile into UVXY! That ought to be interesting! 🙂
My UVXY shares were delivered, (despite the market makers’ shenanigans! ) and based on the pre-market bid, they are going to trade for about 17.50 at the open. I will sell at the open and buy the 20 strike calls in anticipation of yet another vol spike on what looks like an upcoming C wave down.
Extended periods of low volatility tend to to be followed by the opposite. What is very different in this case is what that unprecedented extended period of low vol has led to and which we have talked about (ad nauseam) on the forum. The same feed-back loop that led to the kinds of outlandish gains in the short vol ETPs can, and necessarily MUST, ultimately work in reverse. The only way to avoid this is for vol to return to prior low levels and REMAIN there. Not even the most wildly bullish trader believes that is going to happen.
Nick Cherney (creator of XIV) and Chris Cole got into a very spirited debate last May over his fund. The question of exogenous versus endogenous triggers, intetestingly enough, was a key point of disagreement. For a while it did seem as if Chris was mistaken in his analysis.
Is is possible to make reasonable assumptions, but assumptipns they remain.
Many assume this market is no different ftom previous markets.
Granting that point for the moment, they also assume, granted that were indeed the case, it will behave in the same way as prior markets. That is not necessarily an unreasonable assumption, but an assumption it certainly is. Some of us who have traded markets awhile would argue that this market is unlike any we have witnessed in our lifetimes. I do not know a single competent trader, bullish or bearish, who disagrees with that statement. Without getting into a useless debate about where the market is going to trade tomorrow, next week, ir even next month, I will simply say that I never cease to be amazed at how many people trading this market are completely indifferent to phenomenal systemic risks inherent in equity prices today. Chris Cole is absolutely right. Few people are going to learn anything from the XIV detonation, except perhaps those who got burned by it. Glad, silly as it appeared, I held onto my puts. The biggest mistake of my trading career was not holding them ONE day longer. I guess we must all ultimately have the courage of our convictions.
Big support zone just below at 2715-2718. And more support below that. It’s a minute 4 to me until it goes below 2690, at a minimum, and really below the invalidation and 38%. I don’t think it’s getting down there but it’ll do what it’ll do. The high probability trade for me is the long set up as and when it comes. I’m only interested in a consideration of a short if it starts accellerating and sustains itself and blows through some of these support levels with authority.
I think the bigger moving averages are far more important. The bulls and banksters clearly understand this and went all in to try and decisively conquer the 50 day. Their inability to do so on Friday was in my view quite telling, and I have a sneaking suspicion that they are now going to be forced to once again engage at the 200. Nothing is certain, but that is just one man’s opinion….have a great trading day everyone! 🙂
OBV is wayyy too bullish here for me to seriously contemplate a short. Breadth also showing no real negative divergence with price since the bounce began. Honestly I would have been more worried coming into tomorrow if futures weren’t pointing to a gap down.
Despite what all the perma-bears want to believe, there are still no immediate exogenous factors ready to derail the entire financial industry. This ain’t no early 2008. That means a bear market would have to emerge from technical internals, and we’re nowhere near that point. I like the hourly main going forward, although I do think we could revisit the top of the channel one more time before we head down in force. I do also think we need to consider an alternate where price just heads vertically.
One interesting development is the strength in Bitcoin that has developed over the last week or so. It hit a lot of technical downside targets and is now up 100% off the lows. The BTC crash preceded the correction in equities, and I think we’ll continue to see BTC as a leading indicator going forward. The big money is still betting heavily in favor of BTC.
I don’t deny the possibility that we could get the first bear market without breadth divergence in over 100 years… but the odds are against it.
Zero Hedge is reporting that they forgot to turn off the machinrs ahead of the holiday. They dutifully ramped up futures overnight and faded em until about 9:30 before someone turned em off lol! 😀
Anyone playing this 5 wave down?
I think Kevin and I have short trades loaded and waiting for a futures tell…
Very cautiously. Unless/until it starts getting some momentum. I’m not convinced it will, and even the minor 2 call is suspect; until invalidated, I’m viewing the situation as a minute 4 in progress. OBV supports the bullish view, so price action will have to convince me that a minor 2 is in play, or (later and much deeper) a C wave down.
We will get some kind of correction. I am starting to think that you may be right about it being somewhat shallow. MACD divergence at the current high is not nearly as steep as the last high so it looks like another BTFD moment ahead….
YM Down 142
ES Down 11.75
NQ Down 11.25
Asia Markets Closed most of this week
US and Canada closed today.
Here is my trading plan for Tuesday. If futures confirm the shooting star from Friday I will be selling the SPY Feb 23 275/280 bear call spread. I think we will bounce hard at the 200 day. What about youse guys? 🙂
I’ll be shorting at small/moderate size if/as price undercuts the recent hourly lows. My 5 minute trend indicator is already down (red). The hourly is still mildly up. I’ll expect it to be flashing gray right about the time I’m entering. The stochastics have turned down already with lots of room to fall, and the MACD is just now doing a bearish crossover. I’ll be looking for multiple hourly down bars, similar to the string of red price bars a week ago. I’ll incrementally cash as if and as it goes. If stopped or once cashed out with profits, I’ll be patiently watching for significant buy triggers to get in line with the primary trend, for significantly larger size than my short. There is some danger of getting whipsawed. Between counter-trend and risk of whipsaw, again I’ll keep it small. The large trade opportunity IMO is long and just up ahead, again.
Lara’s lower pink elliott channel line on the hourly main crosses exactly through this support zone at open, adding to the weight of the evidence.
Verne,
My thinking is that the bounce from support levels might not be as furious as seen in last 6 days. I suspect at some point the buy the dip buyers will get the nasty surprise and that will change their behavior. I am not to sure if the bounce will go as high as 3,000 given the churn that we have had. If there is more churn ahead, the bounce might be lower than the expected levels in 3,000s.
Entirely possible RR_001:
I was absolutely fascinated by their inability to make the ramp on Friday stick. They went all in at the open and yet barely managed to close in the green. One thing is certain, I do not think the price action around the 200 day is going to be ambiguous. Rather than a weak bounce, if that pivot is going to fail it will probably do so in spectacular fashion with price slicing cleanly through it and keeping on going. At that point, I would be looking for a last kiss good-bye on the next bounce…it in my mind would be a game-changer…
We shouldn’t forget to incorporate seasonal bias in our approach. If the efforts to lift as per your note yielded dismal outcome, I would lean towards a move by the markets to the downside. We shall see how the day and week turns out starting tomorrow.
As for bouncing hard at the 200 day…I don’t think so. I think the probability of a turn back up above the 200 sma (probably well above) is much higher than reaching it, for one. And on the other side, IF price reaches the 200 day sma…I don’t think it bounces. Why not? Because there’s ALREADY A DOUBLE BOTTOM IN PLACE. It doesn’t show on day session charts because the first hit was overnight in the futures market, the second hit the next day. So if price goes back there (not so likely but possible), I think it far more likely that it down through it. Interesting times just ahead!
In ES, NOT in the cash session so this is a non-confirmation. You really don’t want to see ES revist that pivot, but the ziz zag count if correct, predicts not just a revisit but a break. From a trading perspective, there is a high chance the cash session will retest recent lows prior to making any new highs…just one man’s opinion… 🙂
Any possibility of a zig zag with minor b complete at Friday’s high with a minor c down on deck to finish a fourth wave?
I believe that’s the second alternate hourly. I don’t think this count can be distinguished much if at all from the main count unless/until price undercuts the bottom of the A wave. So for all of these alternatives, the core question is “how far down now?”. We have a minute 4 down as one possibility (I’d expect that one to turn back up Monday), a minor 2 down (or a b down of an abc up) as a second (2-3 days?), and a minor C wave down as a third (3-7 days?), each expected to travel deeper than the proceeding. Should be an exciting week.
US Markets Closed Monday! So unless trading futures, out of luck.
I think, material down is over. Going higher for the foreseeable future.
Lara had this all right, all along. The couple of 1000 point declines and the XIV blow up… was the flush out for the time being. Looking for her to call end of this up cycle at some point.
Oops! Sorry about that. I should read the entire analysis before I post!
We could see a truncation of a possible C down but a move on to new highs will almost certainly see a test of the recent low. We will once again get a good heads-up from VIX.
The five wave impulse fo C should give a VIX high on the third wave down and a lower high on the fifth.
A minor two correction should not produce a new VIX high.
For a third wave down…well, no need for comment! 🙂
From Lara’s options, the anticipated move down could be a minute b wave, or a minor two or minor c. The shooting star in DJI I think favors the minor degree correction, and futures could hint if two or c more likely.
One thing was very evident, and that is a tremendous amount of capital was burned for practically no net market gain- that is short term quite bearish. VIX could gap higher.
I mentioned the possibility that the minor 1 could be over and the next pullback a minor 2 that could go “most of the way” back down. The hourly is now this model. However, I think the market has to prove the more bullish wave count from Friday (see chart) wrong first. My first model on Tuesday will be the more bullish view where the expected downward movement is only a minute iv. The expected turn zone is shown, the area of the prior 4 (2690-2717) and includes the 23.6% at 2701. This model gets invalidated if and only if price gets below the top of the minute i around 2673, and only then do I switch over to the hourly main model, and start thinking that the limit for the pullback is truly way, way below. The daily OBV reading supports the most bullish view IMO at least to start the day, and so that’s what I’ll be looking for until invalidated.
This will be an easy call, with the bulls holding the 50 day and a successful retest of the 200 day. I don’t think a credible bearish case can be made with either of those two pivots intact. Price action will leave no doubt what to expect going forward.
Thank you all for letting me be first even though we suffered a power outage today caused by severe winds knocking down a tree into the power lines!
No problem Doc! Happy to oblige!
Care to borrow my tree?