
Last analysis expected overall upwards movement, which is what has happened, but a short term pullback did not happen first.
Summary: The next target is at 3,020.
Increased volume and a new bullish signal from the AD line offer support to the Elliott wave count today.
Always practice good risk management. Always trade with stops and invest only 1-5% of equity on any one trade.
The biggest picture, Grand Super Cycle analysis, is here.
Last historic analysis with monthly charts is here. Video is here.
An alternate idea at the monthly chart level is given here at the end of this analysis.
An historic example of a cycle degree fifth wave is given at the end of the analysis here.
MAIN ELLIOTT WAVE COUNT
WEEKLY CHART
Click chart to enlarge.
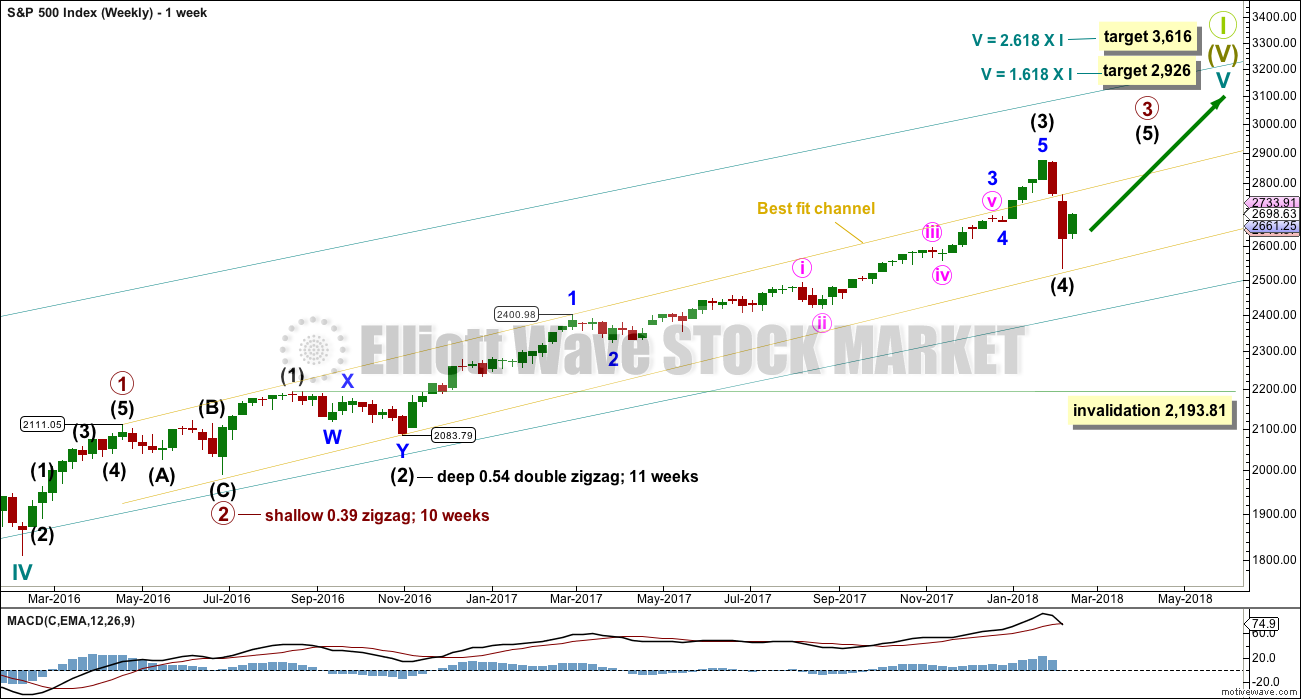
Cycle wave V must complete as a five structure, which should look clear at the weekly chart level. It may only be an impulse or ending diagonal. At this stage, it is clear it is an impulse.
Within cycle wave V, the third waves at all degrees may only subdivide as impulses.
Due to its size intermediate wave (4) looks proportional to intermediate wave (2), even though their durations so far are quite different.
Intermediate wave (4) has breached the Elliott channel drawn using Elliott’s first technique. The channel may be redrawn when it is confirmed as complete using Elliott’s second technique. A best fit channel is used while it may still be incomplete to show where it may find support. Price points are given for this channel, so that members may replicate it on a semi-log scale.
Intermediate wave (4) may not move into intermediate wave (1) price territory below 2,193.81.
DAILY CHART
Click chart to enlarge.
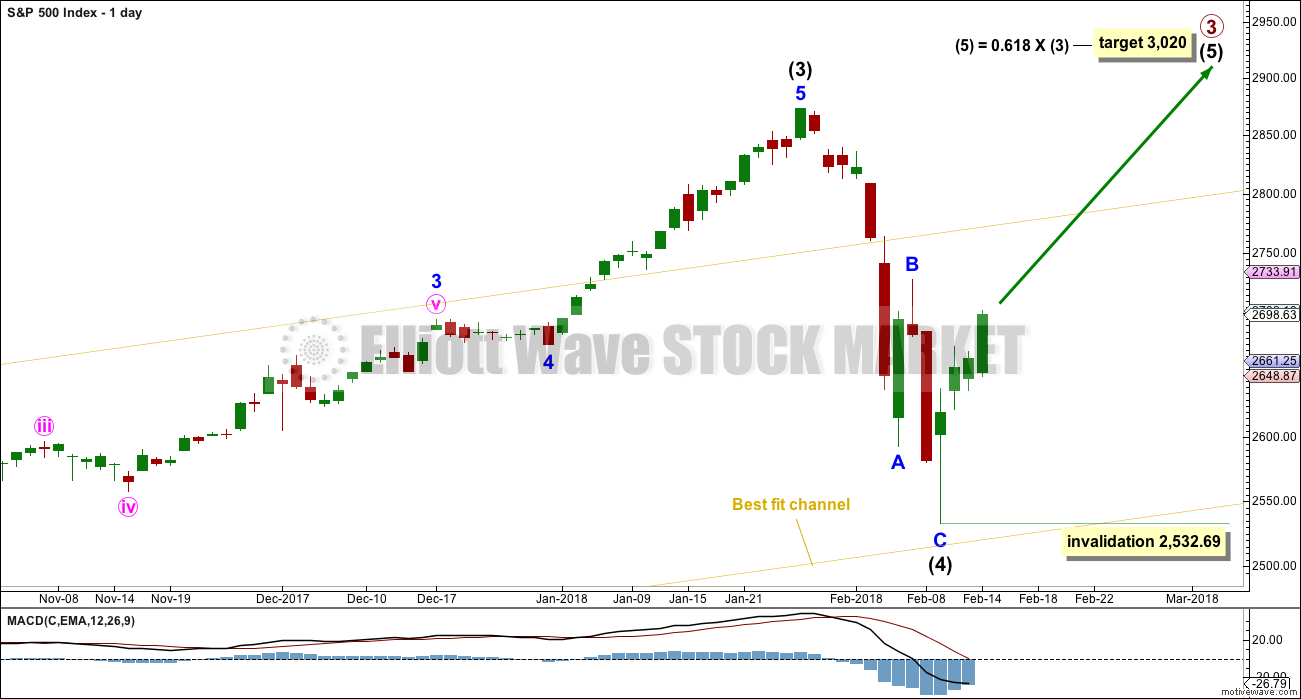
The S&P has behaved like a commodity to end intermediate wave (3): a relatively strong fifth wave with a steep slope. The high looks a little like a blow off top. This is followed by a sharp decline, which is typical behaviour for a commodity and not common for the S&P.
Friday’s low is only a little above the lower edge of the best fit channel. The very long lower wick on Friday’s candlestick is bullish. It looks like intermediate wave (4) may now have found its low.
Despite the duration of intermediate wave (4) being much quicker than intermediate wave (2), the size is proportional. On weekly and monthly time frames intermediate wave (4) now has the right look.
HOURLY CHART
Click chart to enlarge.
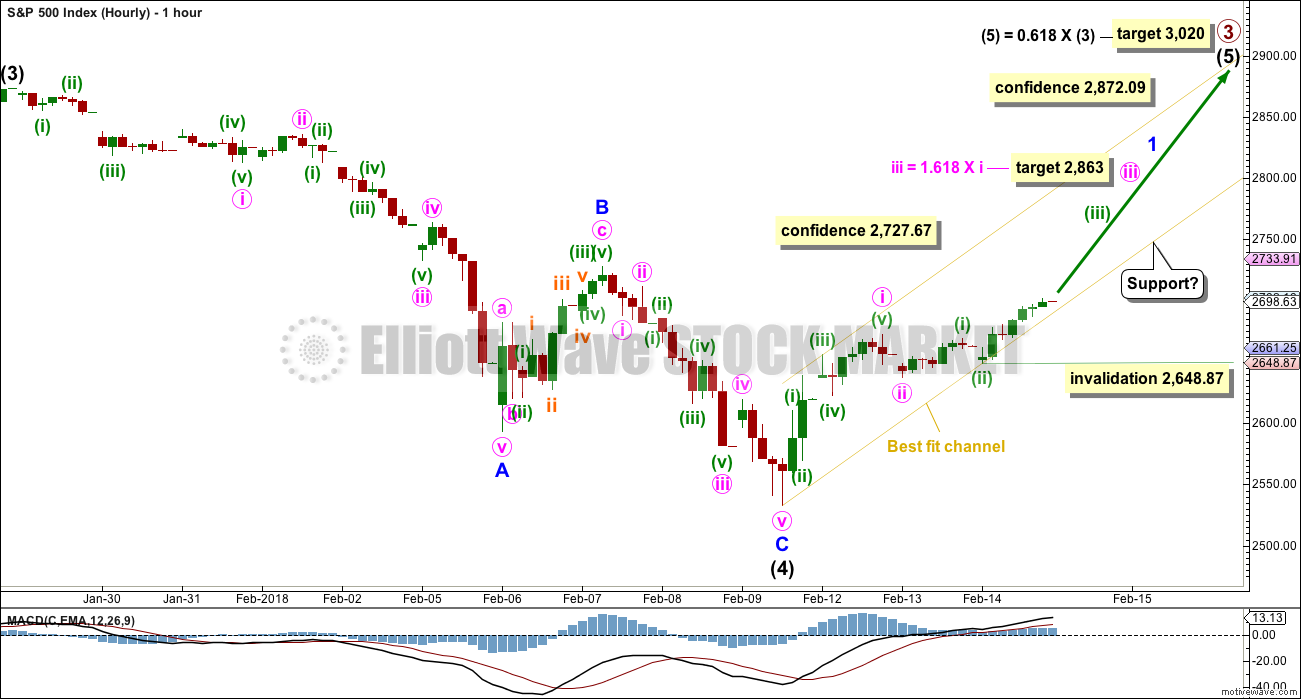
A zigzag downwards may now be complete.
2,727.67 is the start of minor wave C. A new high above this point could not be a second wave correction within minor wave C, and so at that stage minor wave C would have to be over. This would add further confidence to this wave count.
A new all time high would add confidence to this wave count (even though an alternate idea published today would remain valid).
Minute wave ii looks to have been over as a relatively quick and shallow zigzag. The most commonly exhibited Fibonacci ratio is used to calculate a target for minute wave iii.
Minute wave iii may only subdivide as an impulse, and it may continue within the new best fit channel drawn today about upwards movement. Support from volume today offers support to this wave count; a middle of a third wave is often relatively strong for the S&P.
Within minuette wave (iii), no second wave correction may move beyond its start below 2,648.87.
ALTERNATE DAILY CHART
Click chart to enlarge.
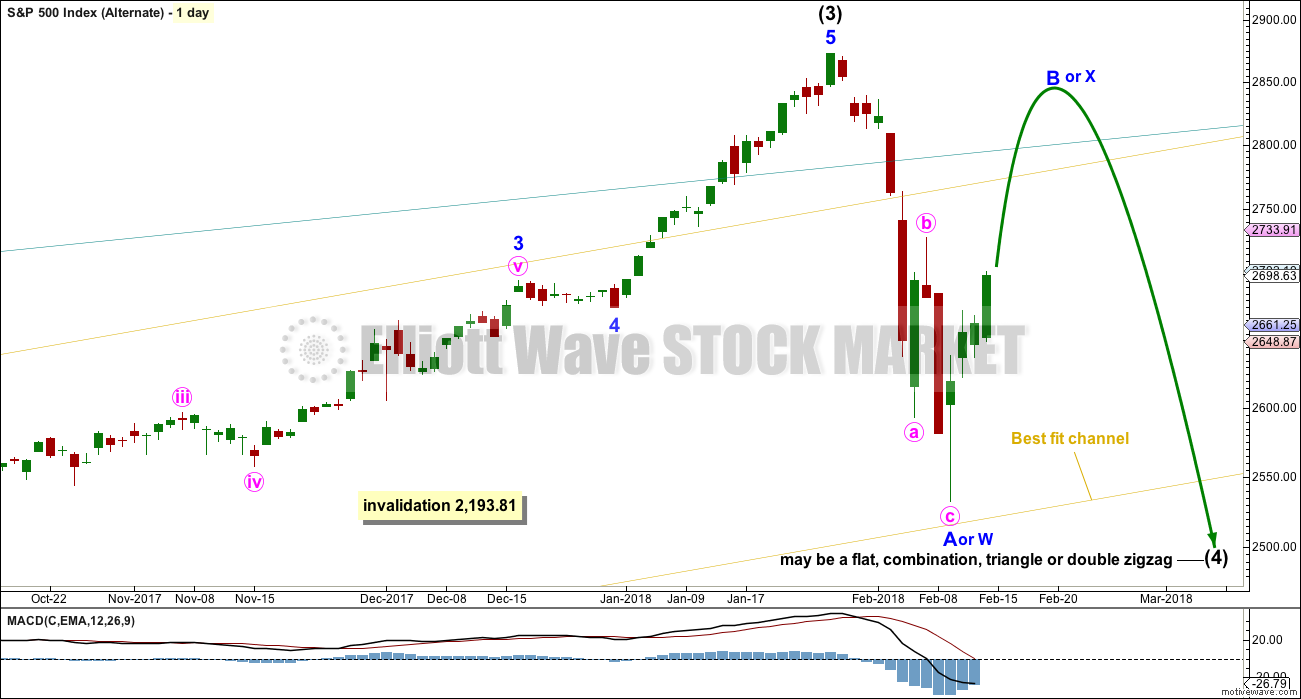
This wave count is identical to the main daily chart, with the exception of the degree of labelling within intermediate wave (4). If the degree is moved down one, then only minor wave A may be complete within a continuing correction for intermediate wave (4).
If it continues further, and if analysis of minor wave A as a zigzag is correct, then intermediate wave (4) may be a flat, combination, triangle or double zigzag. Of all of these possibilities a double zigzag is the least likely because that was the structure of intermediate wave (2). Intermediate wave (4) should be assumed to exhibit alternation until proven otherwise.
If upwards movement continues further, then the idea of a double zigzag may be discarded. Double zigzags normally have a strong slope against the prior trend, and to achieve a strong slope their X waves are usually shallow.
All of a flat, combination or triangle would have a very deep minor wave B. An expanded flat, running triangle or combination may have minor wave B or X make a new all time high. Unfortunately, for this reason there is no upper price point which differentiates this alternate idea from the main wave count.
Minor wave B or X should be expected to exhibit weakness. Light and declining volume and divergence with oscillators at its end are features of B waves, and also of X waves which are analogous.
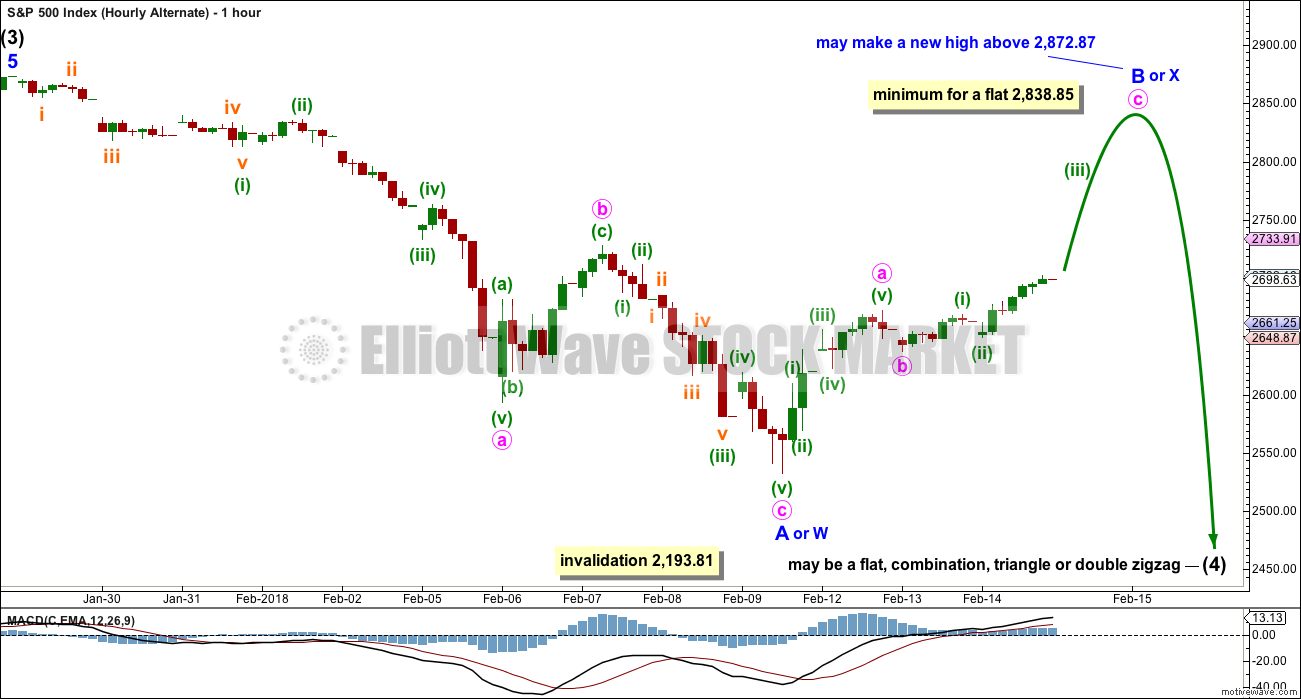
ALTERNATE HOURLY CHART
Click chart to enlarge.
The labelling of subdivisions for this alternate is identical to the main wave count. The degree of labelling within the last zigzag down is moved down one degree.
Upwards movement off the low may be a zigzag for minor wave B. Zigzags subdivide 5-3-5, exactly the same as the start of an impulse.
If intermediate wave (4) is a flat correction, then within it minor wave B must retrace a minimum 0.9 length of minor wave A.
If intermediate wave (4) is a triangle, there is no minimum requirement for minor wave B. It only needs to subdivide as a three wave structure.
If intermediate wave (4) is a combination, then the first structure may be a zigzag for minor wave W. Minor wave X may be any corrective structure and it may make a new high above the start of minor wave W. There is no minimum requirement for minor wave X of a combination, but it would very likely be fairly deep.
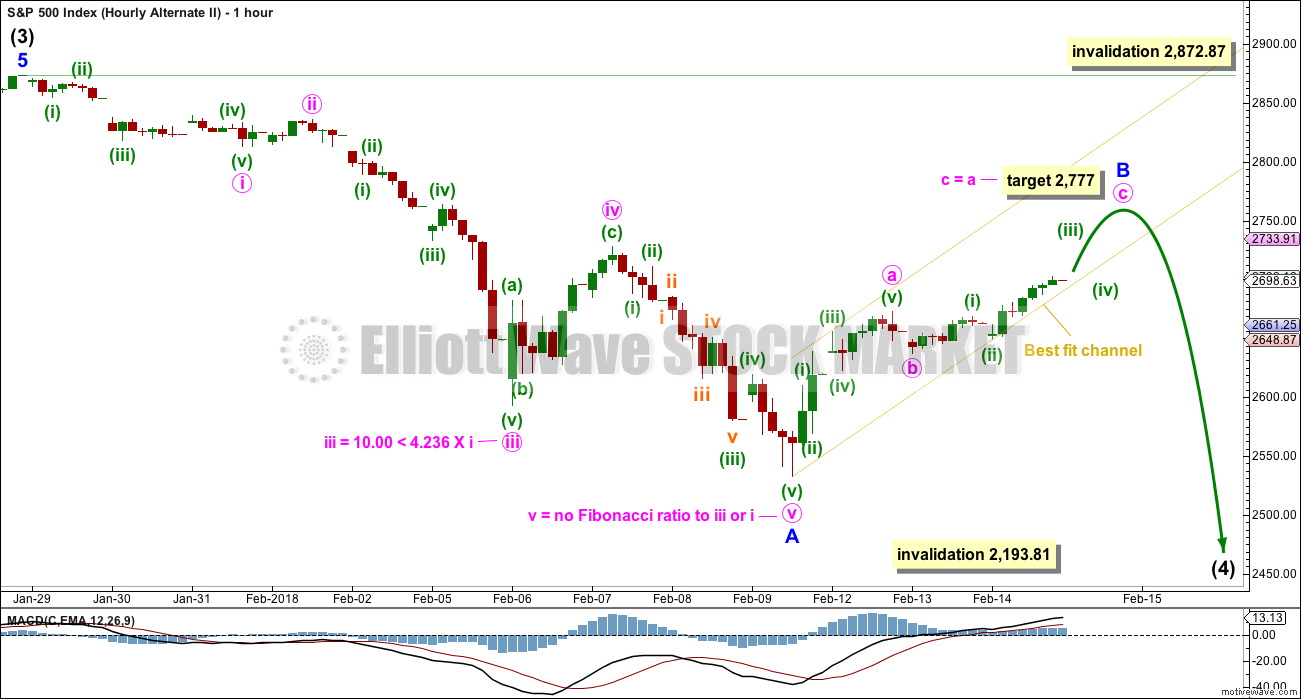
SECOND ALTERNATE HOURLY CHART
Click chart to enlarge.
It is also possible to see the last downwards wave as a five wave impulse. Intermediate wave (4) may be continuing lower as a single zigzag, subdividing 5-3-5.
Within a zigzag, minor wave B may not make a new high above the start of minor wave A at 2,872.87.
A target for minor wave B to end is calculated assuming the most common Fibonacci ratio between minute waves a and c. When minor wave B may be complete, then a target for minor wave C to complete a possible zigzag for intermediate wave (4) may be calculated using the ratio between minor waves A and C. That cannot be done yet.
A breach of the yellow best fit channel by downwards movement (not sideways) would be an early indication that the upwards zigzag of minor wave B may be complete.
TECHNICAL ANALYSIS
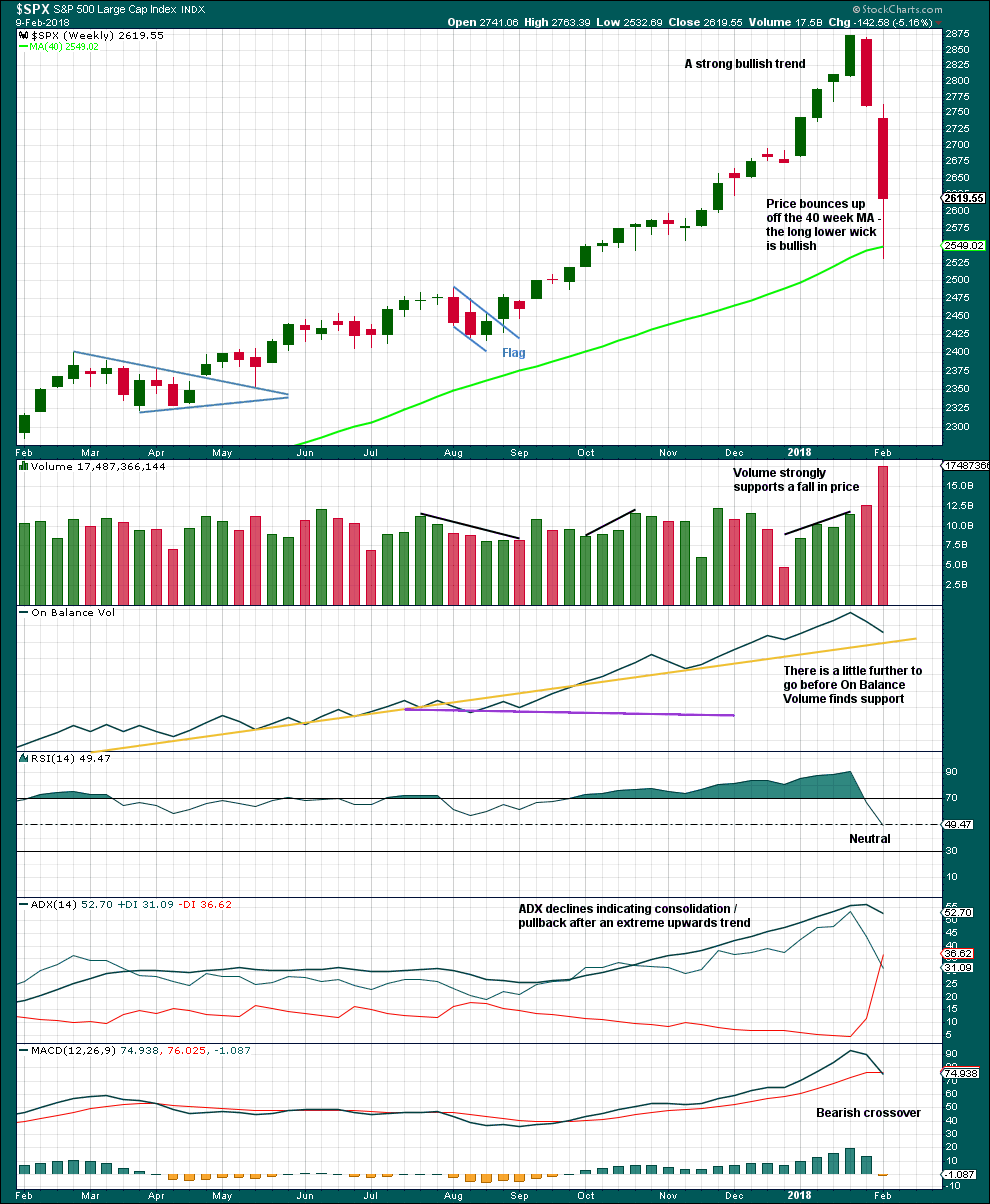
WEEKLY CHART
Click chart to enlarge. Chart courtesy of StockCharts.com.
This pullback has now brought RSI well back down into neutral territory. ADX is declining from very extreme. A possible trend change to down is indicated, but as yet no new downwards trend at this time frame.
In the first instance, support should be expected for On Balance Volume at the yellow trend line. A breach below this line by On Balance Volume would be a very strong bearish signal. A bounce up off the line would be a strong bullish signal.
DAILY CHART
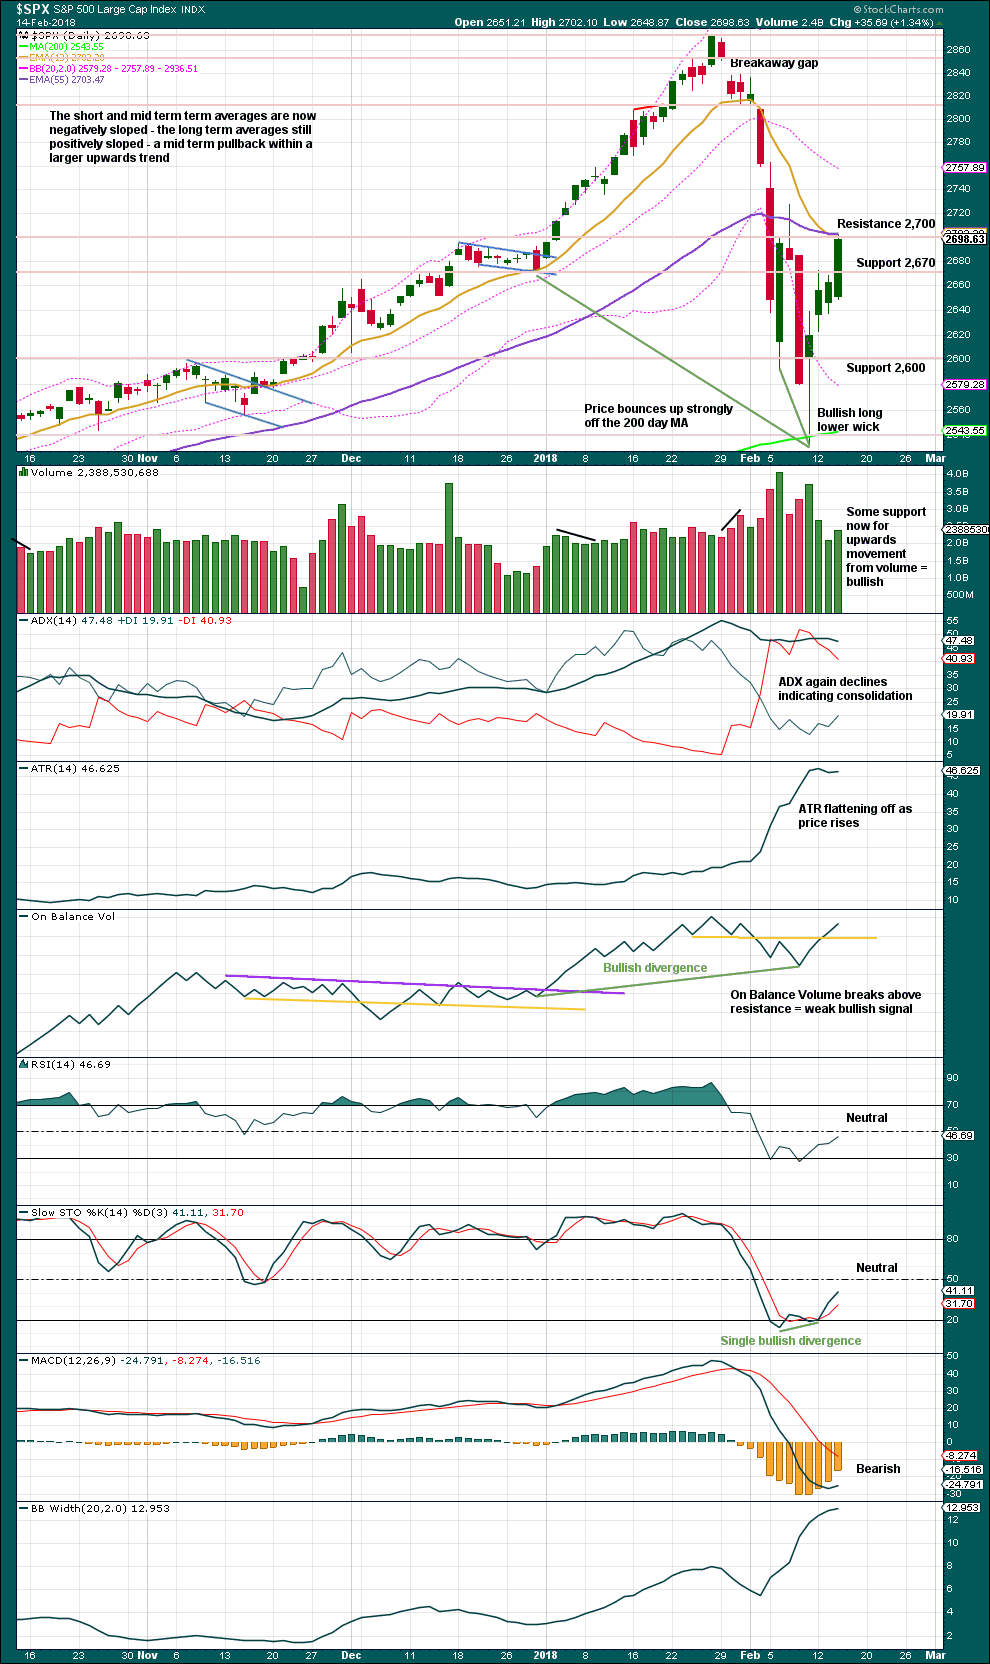
Click chart to enlarge. Chart courtesy of StockCharts.com.
Volume now offers some support to upwards movement, which is increasing in strength. This favours the main daily Elliott wave count.
There is plenty of room now for price to rise before Stochastics and RSI reach overbought.
ADX is a lagging indicator as it is based upon averages. The pullback of last week brought ADX down from very extreme for the prior upwards trend. If there is a new upwards trend, then it will take some time now for ADX to catch up. A new upwards trend may no longer be indicated as extreme by the time that ADX may catch up, allowing room for price to continue to rise for a reasonable period of time.
VOLATILITY – INVERTED VIX CHART
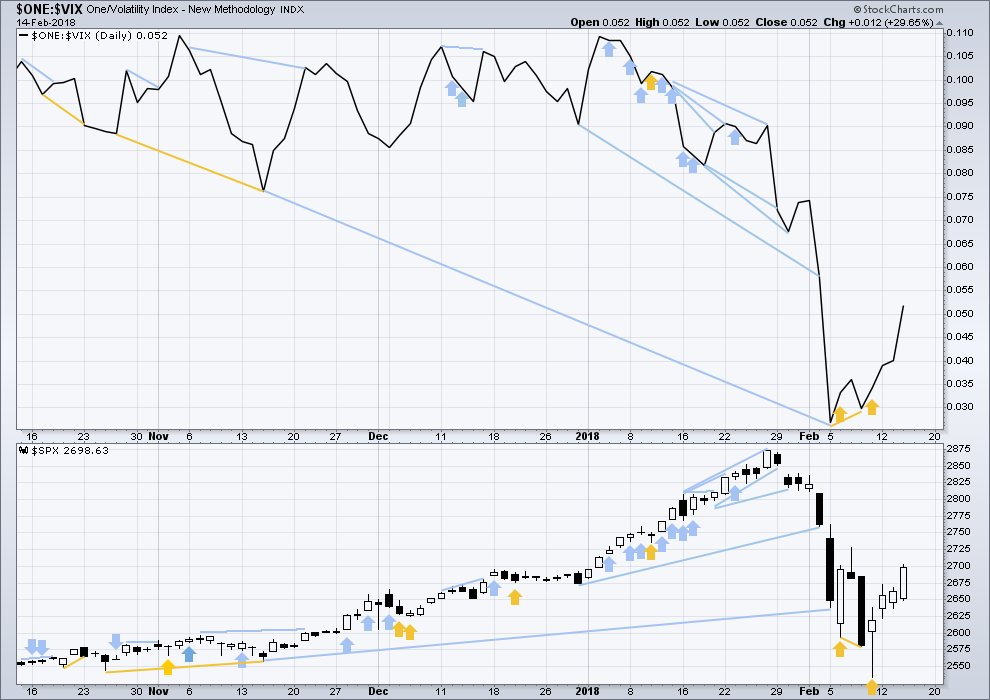
Click chart to enlarge. Chart courtesy of StockCharts.com.
So that colour blind members are included, bearish signals will be noted with blue and bullish signals with yellow.
Normally, volatility should decline as price moves higher and increase as price moves lower. This means that normally inverted VIX should move in the same direction as price.
Both price and inverted VIX have moved higher today. The rise in price comes with a normal corresponding decline in market volatility.
BREADTH – AD LINE
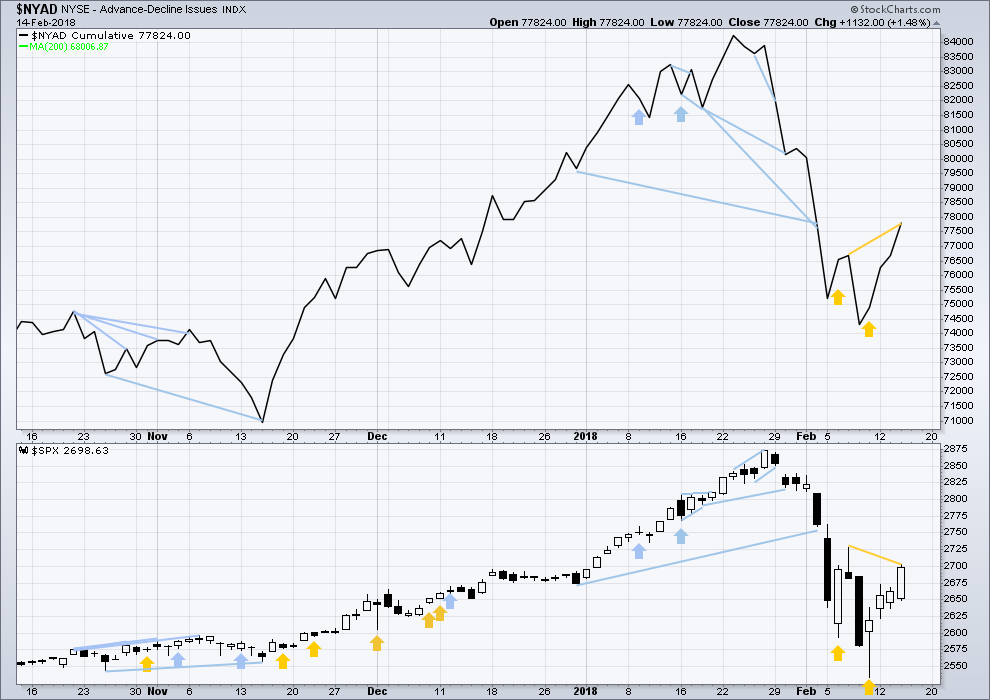
Click chart to enlarge. Chart courtesy of StockCharts.com.
There is normally 4-6 months divergence between price and market breadth prior to a full fledged bear market. This has been so for all major bear markets within the last 90 odd years. With no longer term divergence yet at this point, any decline in price should be expected to be a pullback within an ongoing bull market and not necessarily the start of a bear market.
All of small, mid and large caps last week moved lower. The decline has support from wide breadth.
Breadth should be read as a leading indicator.
The AD line has made a new high above the prior swing high of the 7th of February, but price has not. This is a bullish signal from the AD line, which supports the main Elliott wave count today.
DOW THEORY
All indices have made new all time highs as recently as three weeks ago, confirming the ongoing bull market.
The following lows need to be exceeded for Dow Theory to confirm the end of the bull market and a change to a bear market:
DJIA: 17,883.56.
DJT: 7,029.41.
S&P500: 2,083.79.
Nasdaq: 5,034.41.
Charts showing each prior major swing low used for Dow Theory are here.
Published @ 7:54 p.m. EST.
Whaddisaynow? LOTS of buying pressure. Resistance blown away, weak hand sell offs bought up furiously. It’s a raging bull market. For the moment. For the week, which overall must be one of the strongest on record. Sure, it may end up as a massive B wave. Meanwhile…
Not entirely convinced. What I see is deep pockets buying and lots of FOMO at the close. People have such short memories as they seem to have forgotten the manic run-up to the recent highs. We’ve seen this movie before. I shorted the pop via a few long vol trades.
I know we have had low volume for a long time but that is also a cautionary note. Close above the 50 day is bullish if they can hold it. Bye! 🙂
Verne,
I am personally waiting till Monday as this weeks options expiration might have added to the ramp as well. Don’t forget a lot of PUTS weer sold into the drop to folks trying to game the drop in markets.
That is probably wise. We have quite a few options that still allow this to be a deep second wave correction, including an expanded flat in its final C wave up, and a zig zag in its initial A wave up. They both would lead to new lows, and the flat would be particularly violent if that turns out to be what unfolds. My plan calls for going long if we can bounce higher after a proper retest of any reclaim of the 50 day. A clean slice back down through it means this correction is not done imho… 🙂
Amazingly —
this was the best 5 days in SPX since 2011!
They have absolutely got to hold 2723. If they don’t, they have burned so much capital the bears are going to make mince meat of them…! 🙂
The bears are headed back into hibernation. They know there’s no real momentum behind the move down. A 12% correction, one of the four fastest in over 100 years of data, is a significant win. The short volatility trade got wiped out. But at this point, stocks aren’t looking as expensive as they were at the beginning of the year. For the first time in an extremely long time, we saw EPS projections go up as price plummeted.
Price action this week has looked a lot like it did throughout all of 2017. Short, quick, corrections, steady movement upward. Even VIX finished negative. RUT just had its best two days since April. Berkshire Hathaway just increased its stake in AAPL.
I think there is definitely some damage that was done that could have a ripple effect through the economy, but the main wave count still looks good to me. I still expect to see a day where we get 100+ Spooz points before all is said and done.
Everyone thinks they’re going to be able to call the top on this market. The fact that last week saw the largest volume of outflows in SPY history is quite significant. I don’t claim to know where the market will top, but I do think Ray Dalio may get the last laugh after all.
The penetration of the 50 day comes at the expenditure of an phenomenal amount of buying power. Unless they can hold it, it is all “sound and fury”…! 🙂
Let’s see if we can close above the 50 day SMA…no push-back from the bears… yet
And VIX is still green for the day. Sure wish it would go red.
2727.67 is the next hurdle to the upside. Grinding higher ……….
Gone!
Main hourly chart updated:
Second alternate hourly updated:
I’m publishing this one because this is the point in time at which they begin to diverge.
It’s possible that the big bounce is just a B wave and it’s possible now that it could be over, the structure may now be complete.
The target is calculated to expect price to remain mostly within the yellow best fit channel on the weekly chart, with possibly an overshoot on a long lower wick. If support holds about that trend line then another new low may not be by a huge amount. Let us expect support as most likely initially.
Oh, and please note I’ve redrawn the yellow channel about this upwards movement on the hourly charts. The S&P is up to its old tricks again of moving a bit below a channel then continuing on upwards. When it does that we have to keep redrawing the channel.
Which is why I advise wait for a channel breach by clearly downwards movement, not sideways, before expecting a trend change in this market.
I understand the target of iii = 1.618 * i.
Is there not a fibonacci based target of minute iii = 1.0 * i? I have such a target at 2778 or so for minute iii. Why do you not view wave equality as a viable or likely target?
Right back up to the 50 day SMA.
Will they find a Grizzly waiting? 🙂
With the break above this morning’s SPX high of 2717.66, the chart below is possible. However, I am always cautious with a series of 1-2 nested together. So very often it does not pan out.
That’s possible. Incredibly bullish view. Here’s the extreme opposite, perhaps: a giant ending diagonal!! Lol!!! (Excuse me if I’ve taken liberties with it, all in good fun.) Only price action will tell…
What I posted for the hourly count is essentially Lara’s main daily and hourly count with today’s waves added. If her target for 2863 for minute iii turns out to be correct, it will need to and mostly be an expanded third wave.
However, at the moment it is not increasing in momentum. Something I would like to see. And VIX is still green on the daily albeit barely.
Hmmnnn….that’s intetesting…I had bern thinking rising wedge myself… 🙂
Like I said, nested 1-2s are so very often proven incorrect. Caution needed because it could be a long way down.
If we break down to 2590 region, it could form an inverse H&S. But if that fails, it looks like new lows are the order of the day / week. Caution.
More seriously (than my “ending diagonal” nonsense), I do think the 5 wave up from the low on Feb 11 is approaching doneness, rather than yet more 1-2 action. The chart shows my count.
A large double top in SPX may be on its way. I can make out a 5 wave pattern in today’s up move, and 3 is shorter than 1. The resulting max for the 5 is right around the high for the day, surprise surprise. I’ll be watching there for a turn and fresh sell triggers.
In my experience, you rarely get a more glaring caution signal than both VIX and the market printing green…
So much for all our theories! Lol!!! The bull kicks some ass. Again. Volatility is much higher, BUT the overall behavior is the same: dips are bought HARD, and the mood is to get money in.
That is what worries me! 🙂
This has been one incredible rally so far…
One day DJI chart shows impulse down, three waves up to area of previous fourth wave….
50 day last proved resistance on Feb 7 bounce but the fight lasted the entire session. We may see a repeat….
Looks like they are trying to make another run at the 50 pivot at 2722.47. I expect resistance there to persist, until proven otherwise….
I suspect price turns back down well before that level. I expect minimally some backing/filling here, if not a strong C wave down. Unless 2710.5 is pushed through (the 76% retrace of the high/low today). In which case, yup.
TMV has a nice bottom-ish structure in place now…
Hi Kevin
What do you mean 76% retreat from Fridays low?
Or just 76% of today’s retracment?
Why does Elliott wave International calling this a suckers rally?
Thank You
76% RETRACE. Meaning, price has move back up 76% (a fibonacci level) of the price range of the high today, to the low today.
Their view of it as a suckers rally is due to them putting what we have as the “daily alternate” as their primary. They think price is in a very large B wave up, and an even larger C wave down is right around the corner. They could be right. Or not.
Lastly, I’ll say that the term “suckers rally” is rediculous. SPX has come up 7% in 4 days!!!! As I see it, the sucker is the market player who hasn’t benefited from at least some of that. Regardless of whether it turns out to be a B wave or not.
Whatever EWI says, you are generally safe ignoring them, and in many cases doing the exact opposite! 🙂
Hi Verne
Why are they always so negative
I would think they would be somewhat neutral and go with the wave counts.
The other negative about there site is theres no messaging the person putting out those daily updates to get some sort of feedback.
Thanks for you and Kevins Feedback.
They also feel the Us dollar is going to have a massive rally.
Does anyone here follow the Us dollar and if so any thoughts on that.
Thank You
Before I found Lara, I lost a lot of money trading their wave counts. I have mentioned here before that I finally started making profitable trades by doing the exact OPPOSITE of Hochberg’s counts. Their persistent bias and lack of discipline is nothing short of stunning. The most amazing and consistent error is a complete failure to properly recognize expanded flats. Follow them at your own considerable risk. Just one man’s honest opinion. 🙂
USD is probably in a fifth wave down ahead of a turn higher to new highs…
My current take. Whether this 4 is over is uncertain. Wave 5 cannot proceed past the indicated maximum, or else 3 becomes the shortest wave. And note the fairly close by invalidation at the top of the 1. If price gets close to that and turns up, I will be a heavy buyer.
Hi Kevin i don’t understand will you become a heavy buyer at the 2770 – 2775 level?
Or if it goes above that level?
Thank You
No, that 2770 area is the HIGHEST I expect price to go in the wave structure shown (i.e., the end of the 5th wave). If anything, that would be where I would SHORT if price got there and turned back down, i.e., after getting some sell triggers, like a 8/34 ema crossover to the downside on a 5 minute, and a swing low on the 5 minute taken out to the downside.
My buying comment was about IF price got all the way DOWN close to the top of the 1, and turned back UP, I’d be a heavy buyer.
A new VIX high above 20.66 and the banksters are going to have to re-group…bullish MACD divergence at last low…
Cash dumps. No big surprise. They no longer have the risk parity trade tail-wind. Let’s see if the bears turn up the heat…
That was an impulsive move down off the morning’s high…
Yes it definitely was impulsive down. In theory, should be a 3 up and another 5 down. Stay nimble…
I’m gonna call it miniscule 4
Key decision the next few days. Now that the 50 day has rejected the market advance, we will probably get a retest of the 200, which if it holds, would be wildly bullish. If it does not…., well…you know…”Farewell and Adeiu…” 😉
We are right at the lower best fit channel line. It needs to hold. We also have negative divergence on MACD at the 15 minute level. If we start to break down from here, I would think the probabilities of the Alternate Daily will increase significantly.
Certainly the more it falls the more potential for the alternate. That said, I see this so far as a simple profit taking correction on this massive move off the recent low (200 daily MA bounce). Well within parameters of the main, IMO. So far…
It’s bounced cleanly off the 38% retrace of today’s high and yesterday’s low.
Let’s see if we close that gap….
Well Verne I see that interest rates are getting the pullback you suggested they would get soon. I smell another TMV buy coming up Very Soon Now.
Indeed! I initially thought we would kiss that 200 day goodbye, but apparently no valentine smooches will be forth-coming.
Market response to 50 day, as expected, is quite telling… 🙂
2727.6 and 2742.6 key levels this morning. 27 is the Feb 7 peak and 42 is the 61.8% of the entire ABC down. Watch for turns and sell triggers off those levels. But ya’ll knew that! Best of luck today all.
Verne, re-loading shorts that never triggered yesterday and inching back in to long vol with put spreads on UVXY and long VIX calls
Yep. Selling Diamond 247 hedging calls. Adding more bull put spreads.
Everyone should listen to this prophetic interview with Chris Cole of Artemis Capital from last Jan 25, the day before the all time market high. Take away: we are only in the first inning of the short vol unwind…!
http://www.macrovoices.com
Yep! Unloaded DIA 247 strike hedging calls as we kissed the 50 day…picture perfect!! 🙂
Perhaps a broad based infrastructure plan – or some other global stimulus – can get us to new ath. But I’m tempted to lean toward one of the alternates as long as yields keep trending up. I know I shouldn’t mix qualitative with technical but it’s a bad habit…
After PPI release… 30 Year Treasury Yield declines!
NO… NONE… ZERO… worry of accelerating inflation is showing up in the one spot where it really matters.
Remember… 3.26% is the key! 3.26%+ an acceleration Higher in the blink of an eye!
It appears to me given everything I see at the moment… that 30 Year Yield at least short-term may go back to near or below 3.00%. Meaning the Yield Curve will get as FLAT as can be. I have a visualization but people will get mad at me if I express it. After all you can’t make a joke about anything any more in these times.
I love jokes …. let it rip!
ditto
Nah… Not the right forum. Sorry!
I tend to agree with you about inflation. I’m a buyer of 10 year bonds anywhere near 3%. But my comment related to equities is more about risk-parity re-balancing than inflation, which is why I have a hard time believing we jump back to ATH. But days like today show that Bull is still strong!
Happy Valentine’s Lara et al.
1st is usually fun.
Thank you.
Funny story:
A few years ago a member emailed me to wish me a Happy Valentines.
Here in NZ Valentines is for lovers pretty much exclusively. To wish someone a Happy Valentines has a strong romantic connotation.
I replied that I was married.
He replied that he didn’t mean anything romantic about it. I spoke with Cesar (he’s from Texas) and he explained to me that in USA it can be just a friendly thing.
Oops! Cultural differences. Even in English speaking countries.
So yeah. Happy Valentines everybody!
Well, now I am blushing and I am quite glad that Cesar explained this to you. I would never want to get between a man from Texas and his woman / wife / lover!
Also, thanks for answering my question yesterday regarding the probability of the main count versus the alternate.
To all you happy lovers…!
https://www.google.com/url?sa=t&source=web&rct=j&url=%23&ved=0ahUKEwipu9KksajZAhWmmOAKHaYABNIQ8TUINDAB&usg=AOvVaw0VTJzWxrN8ZFOD4xbU2nov
🙂
Oops! Here is the link I meant to post. Featuring the incomparable Ella Fitzgerald…
https://www.youtube.com/watch?v=UjuaZDdqmCw
Speaking of which Lara, I seem to also recall an on-forum marriage proposal awhile back…? 🙂