
Another green daily candlestick has completed as expected.
Summary: The next target is at 3,020.
In the short term, look for a pullback tomorrow for a second wave correction. The pullback may find support now about the upper edge of the best fit channel on the hourly chart.
Today the AD line is bullish and On Balance Volume gives a weak bullish signal.
Always practice good risk management. Always trade with stops and invest only 1-5% of equity on any one trade.
The biggest picture, Grand Super Cycle analysis, is here.
Last historic analysis with monthly charts is here. Video is here.
An alternate idea at the monthly chart level is given here at the end of this analysis.
An historic example of a cycle degree fifth wave is given at the end of the analysis here.
MAIN ELLIOTT WAVE COUNT
WEEKLY CHART
Click chart to enlarge.
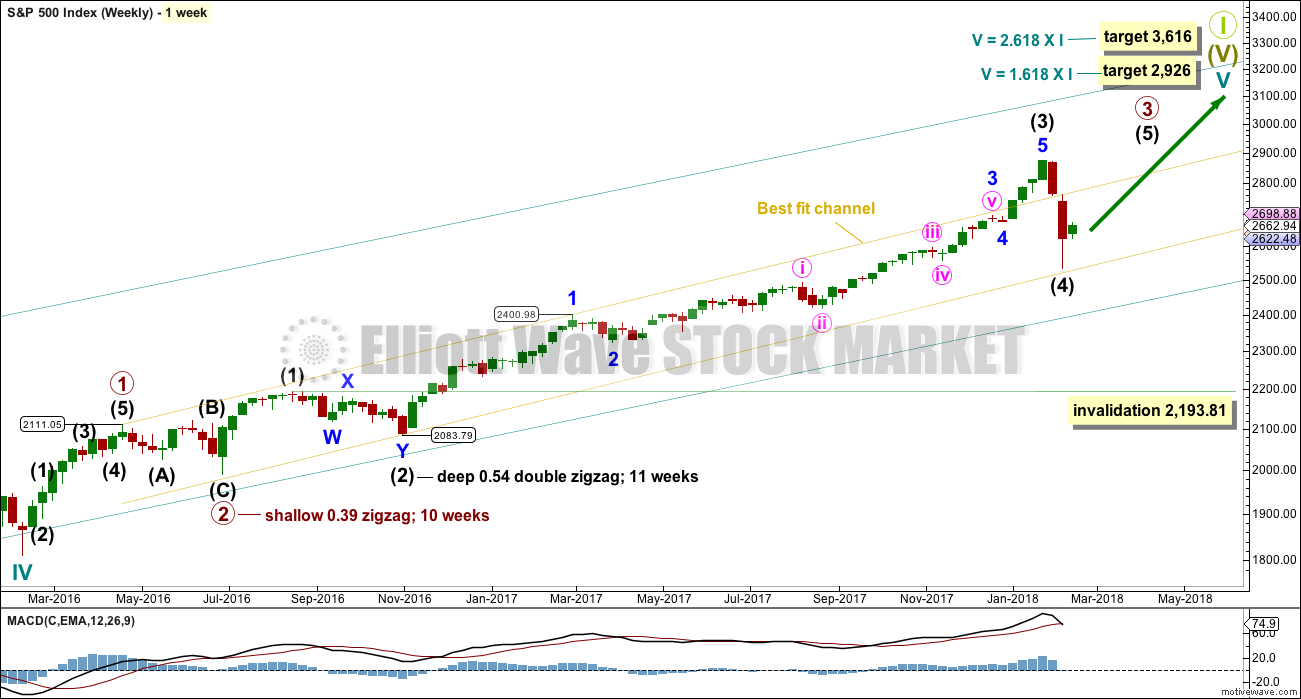
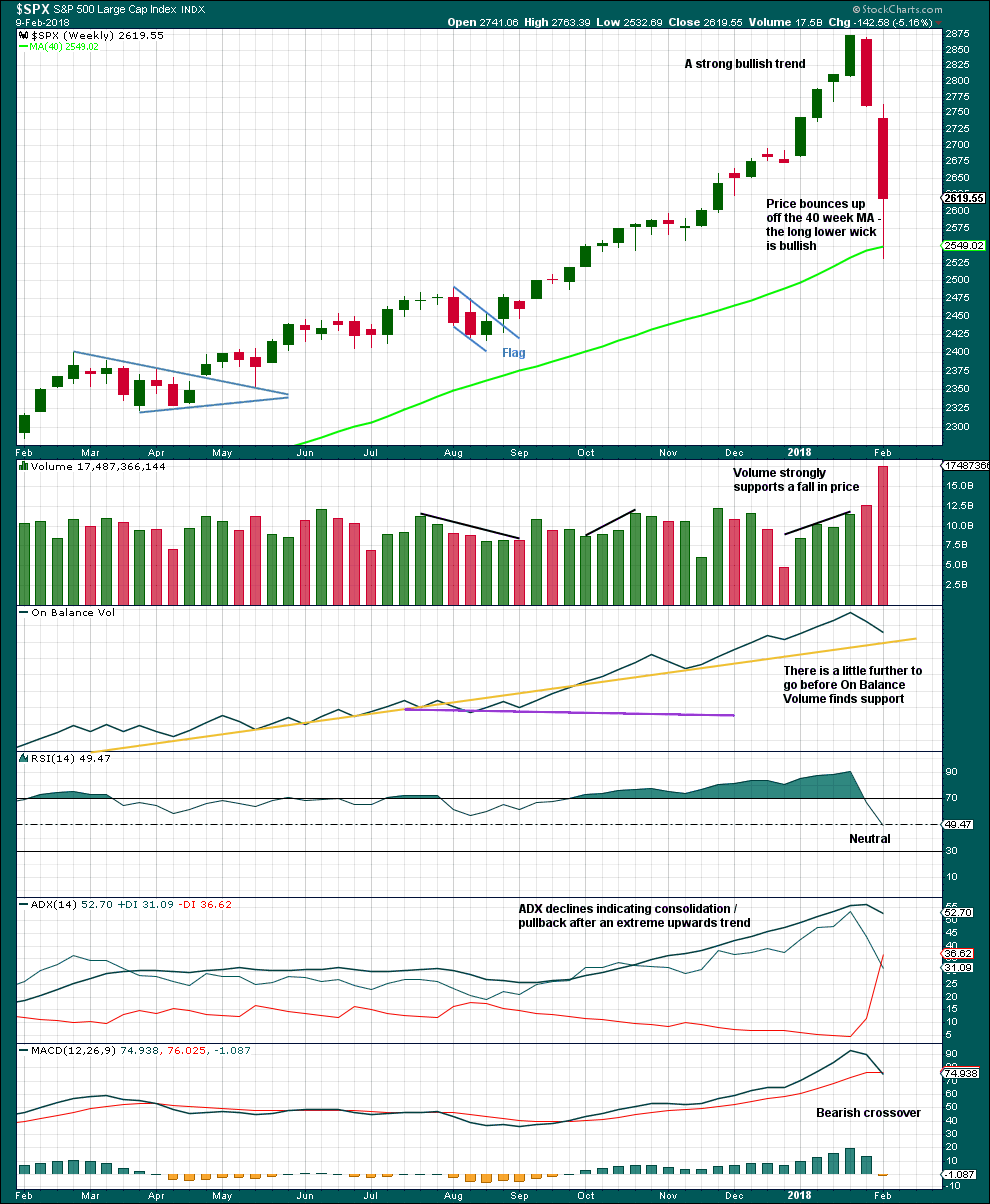
Cycle wave V must complete as a five structure, which should look clear at the weekly chart level. It may only be an impulse or ending diagonal. At this stage, it is clear it is an impulse.
Within cycle wave V, the third waves at all degrees may only subdivide as impulses.
Due to its size intermediate wave (4) looks proportional to intermediate wave (2), even though their durations so far are quite different.
Intermediate wave (4) has breached the Elliott channel drawn using Elliott’s first technique. The channel may be redrawn when it is confirmed as complete using Elliott’s second technique. A best fit channel is used while it may still be incomplete to show where it may find support. Price points are given for this channel, so that members may replicate it on a semi-log scale.
Intermediate wave (4) may not move into intermediate wave (1) price territory below 2,193.81.
DAILY CHART
Click chart to enlarge.
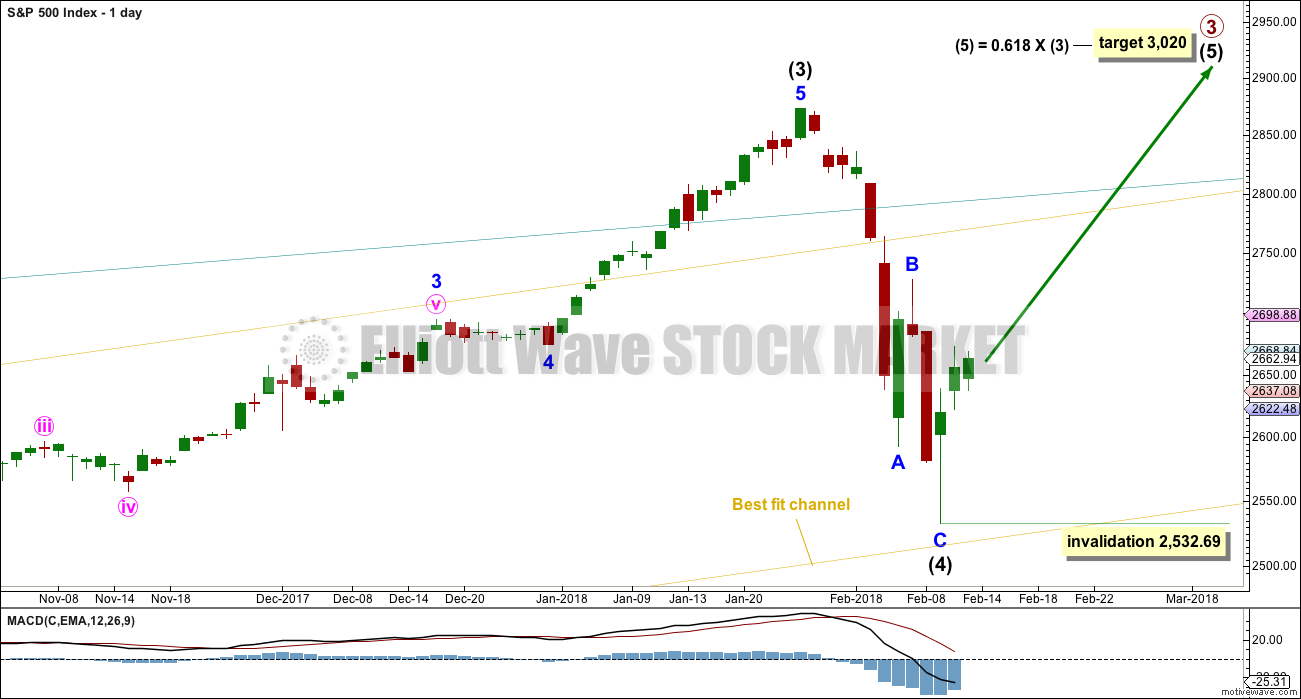
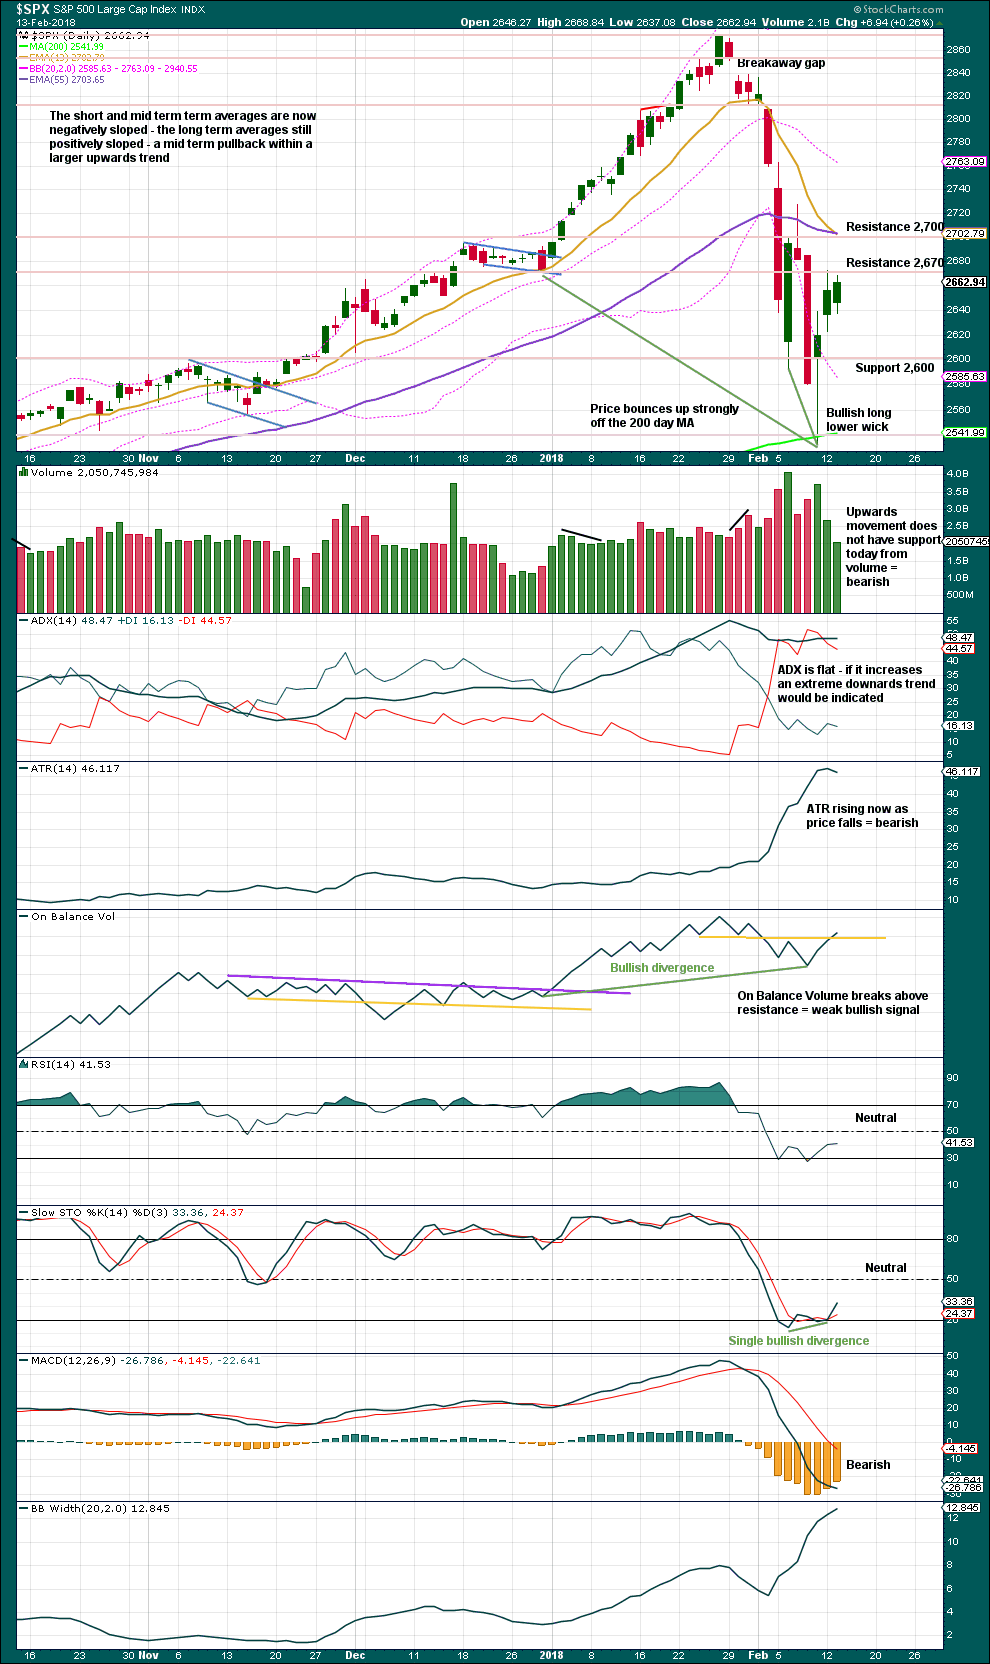
The S&P has behaved like a commodity to end intermediate wave (3): a relatively strong fifth wave with a steep slope. The high looks a little like a blow off top. This is followed by a sharp decline, which is typical behaviour for a commodity and not common for the S&P.
Friday’s low is only a little above the lower edge of the best fit channel. The very long lower wick on Friday’s candlestick is bullish. It looks like intermediate wave (4) may now have found its low.
Despite the duration of intermediate wave (4) being much quicker than intermediate wave (2), the size is proportional. On weekly and monthly time frames intermediate wave (4) now has the right look.
HOURLY CHART
Click chart to enlarge.
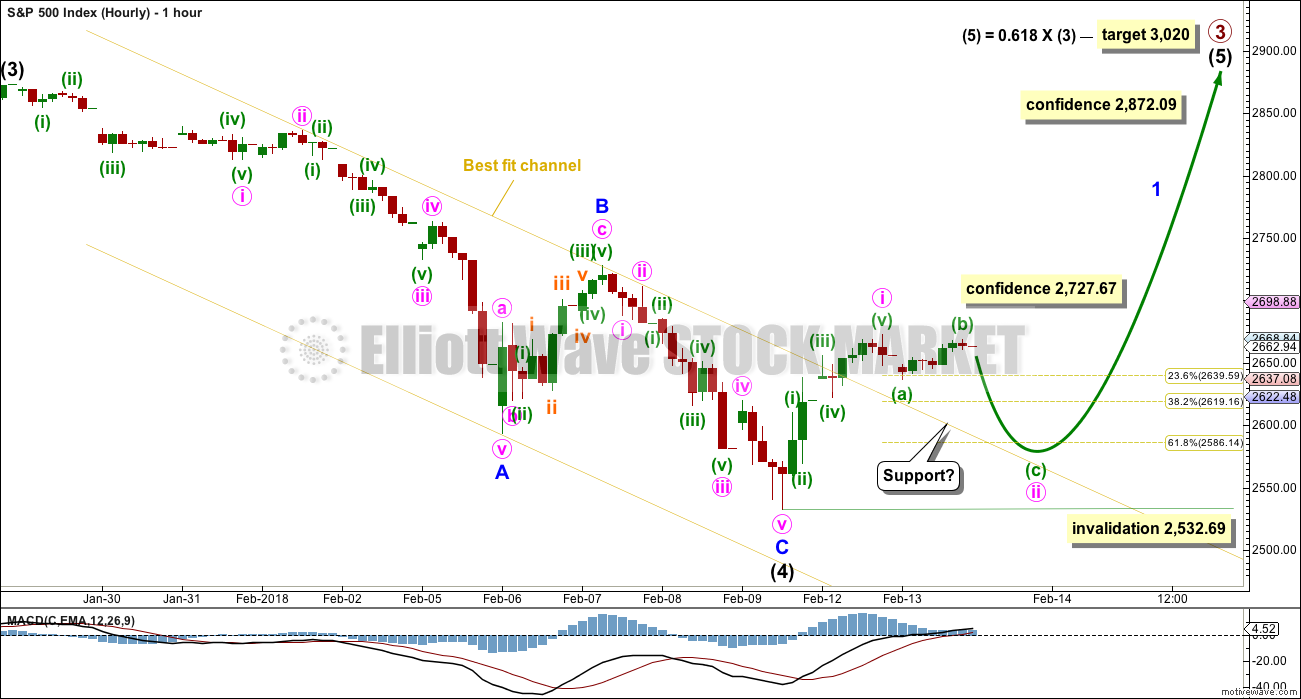
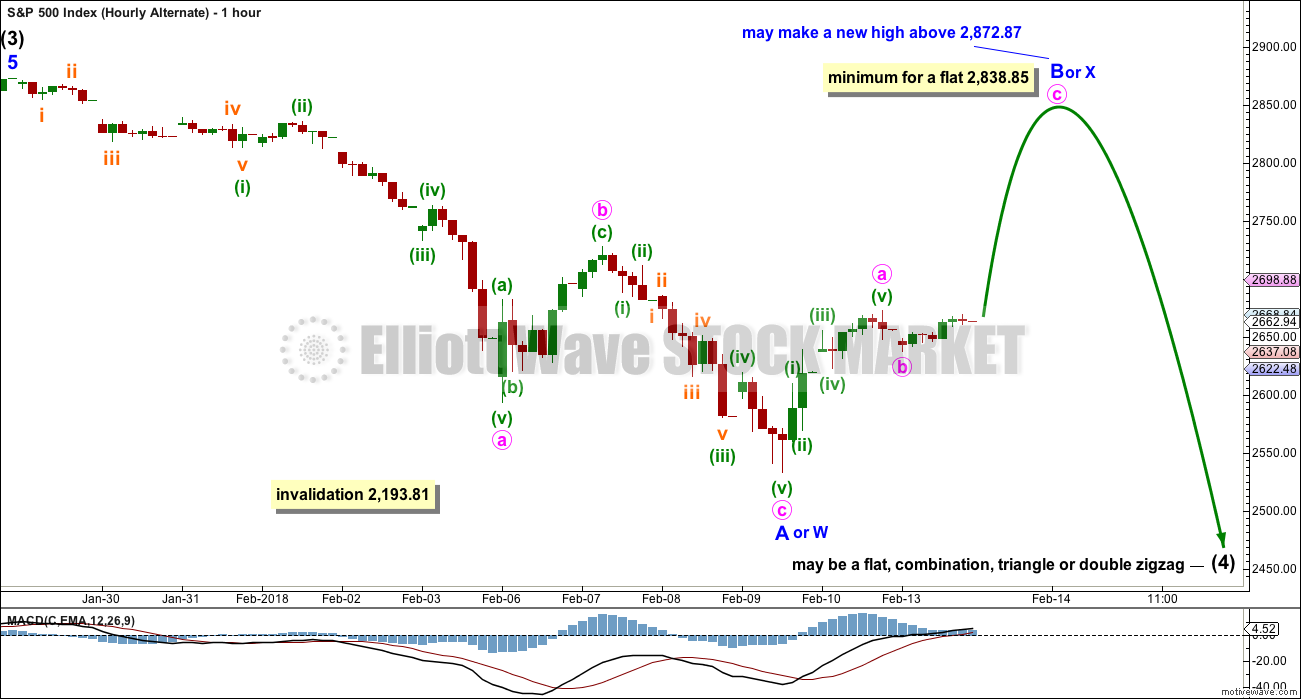
A zigzag downwards may now be complete.
2,727.67 is the start of minor wave C. A new high above this point could not be a second wave correction within minor wave C, and so at that stage minor wave C would have to be over. This would add further confidence to this wave count.
A new all time high would add confidence to this wave count (even though an alternate idea published today would remain valid).
Minute wave ii may move lower tomorrow. If it finds support about the upper edge of the best fit channel, then it may end a little below the 0.618 Fibonacci ratio of minute wave i.
Minute wave ii may not move beyond the start of minute wave i below 2,571.12.
ALTERNATE DAILY CHART
Click chart to enlarge.
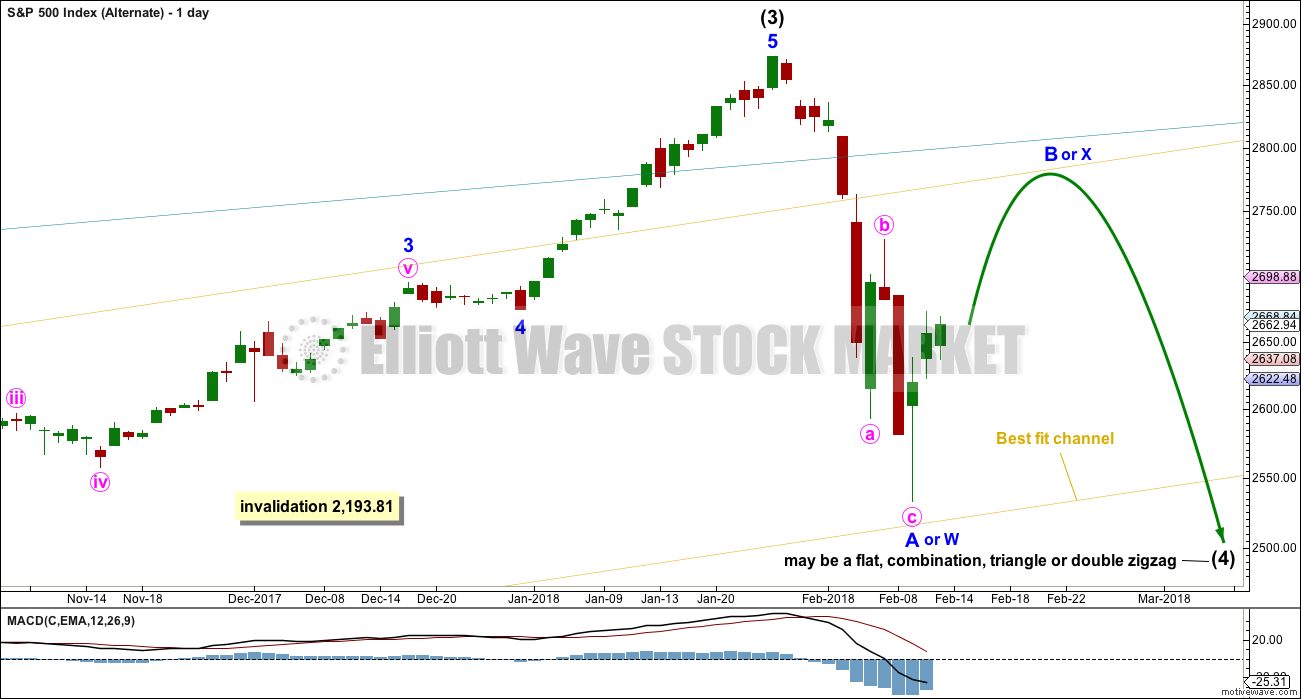
This wave count is identical to the main daily chart, with the exception of the degree of labelling within intermediate wave (4). If the degree is moved down one, then only minor wave A may be complete within a continuing correction for intermediate wave (4).
If it continues further, and if analysis of minor wave A as a zigzag is correct, then intermediate wave (4) may be a flat, combination, triangle or double zigzag. Of all of these possibilities a double zigzag is the least likely because that was the structure of intermediate wave (2). Intermediate wave (4) should be assumed to exhibit alternation until proven otherwise.
All of a flat, combination or triangle would have a very deep minor wave B. An expanded flat, running triangle or combination may have minor wave B or X make a new all time high. Unfortunately, for this reason there is no upper price point which differentiates this alternate idea from the main wave count.
Minor wave B or X should be expected to exhibit weakness. Light and declining volume and divergence with oscillators at its end are features of B waves, and also of X waves which are analogous.
ALTERNATE HOURLY CHART
Click chart to enlarge.
The labelling of subdivisions for this alternate is identical to the main wave count. The degree of labelling within the last zigzag down is moved down one degree.
Upwards movement off the low may be a zigzag for minor wave B. Zigzags subdivide 5-3-5, exactly the same as the start of an impulse.
If intermediate wave (4) is a flat correction, then within it minor wave B must retrace a minimum 0.9 length of minor wave A.
If intermediate wave (4) is a triangle, there is no minimum requirement for minor wave B. It only needs to subdivide as a three wave structure.
If intermediate wave (4) is a combination, then the first structure may be a zigzag for minor wave W. Minor wave X may be any corrective structure and it may make a new high above the start of minor wave W. There is no minimum requirement for minor wave X of a combination, but it would very likely be fairly deep.
TECHNICAL ANALYSIS
WEEKLY CHART
Click chart to enlarge. Chart courtesy of StockCharts.com.
This pullback has now brought RSI well back down into neutral territory. ADX is declining from very extreme. A possible trend change to down is indicated, but as yet no new downwards trend at this time frame.
In the first instance, support should be expected for On Balance Volume at the yellow trend line. A breach below this line by On Balance Volume would be a very strong bearish signal. A bounce up off the line would be a strong bullish signal.
DAILY CHART
Click chart to enlarge. Chart courtesy of StockCharts.com.
Volume for an inside day is very light. Price is rising on light and declining volume. Normally this would be a large cause for concern for bulls, but at this time it is a persistent feature of this market. Price has been rising on declining volume now at all time frames for years.
ADX indicates the prior downwards trend reached extreme and may now have ended.
The bullish signal from On Balance Volume is weak because the trend line is weak. However, this along with bullish divergence puts On Balance Volume into bullish territory, supporting the main wave count.
VOLATILITY – INVERTED VIX CHART
Click chart to enlarge. Chart courtesy of StockCharts.com.
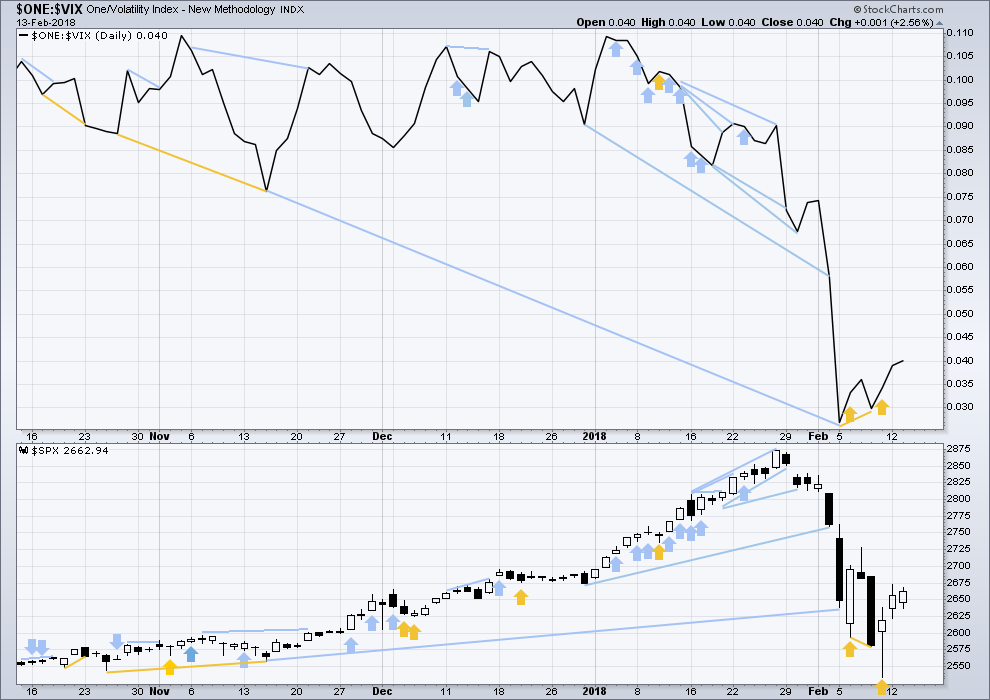
So that colour blind members are included, bearish signals will be noted with blue and bullish signals with yellow.
Normally, volatility should decline as price moves higher and increase as price moves lower. This means that normally inverted VIX should move in the same direction as price.
Both price and inverted VIX have moved higher today. The rise in price comes with a normal corresponding decline in market volatility.
BREADTH – AD LINE
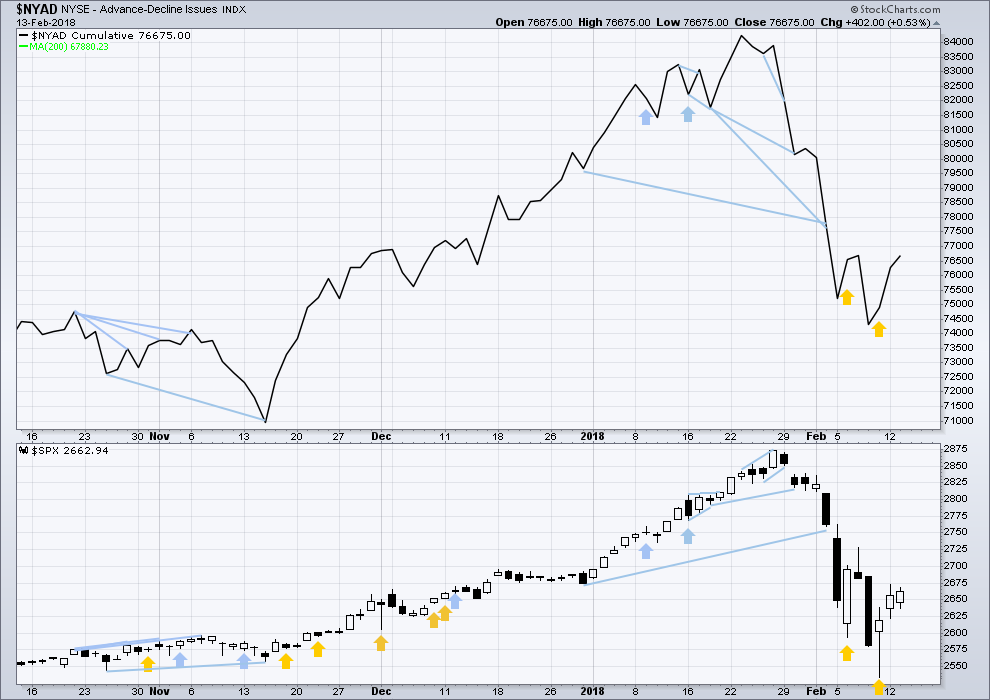
Click chart to enlarge. Chart courtesy of StockCharts.com.
There is normally 4-6 months divergence between price and market breadth prior to a full fledged bear market. This has been so for all major bear markets within the last 90 odd years. With no longer term divergence yet at this point, any decline in price should be expected to be a pullback within an ongoing bull market and not necessarily the start of a bear market.
All of small, mid and large caps last week moved lower. The decline has support from wide breadth.
Breadth should be read as a leading indicator.
Upwards movement today has support from rising market breadth. This is bullish.
DOW THEORY
All indices have made new all time highs as recently as three weeks ago, confirming the ongoing bull market.
The following lows need to be exceeded for Dow Theory to confirm the end of the bull market and a change to a bear market:
DJIA: 17,883.56.
DJT: 7,029.41.
S&P500: 2,083.79.
Nasdaq: 5,034.41.
Charts showing each prior major swing low used for Dow Theory are here.
Published @ 7:22 p.m. EST.
Does anyone hold ES futures contracts overnight here? Do you use Lara’s invalidations as stops? I worry that overnight the stops could get triggered just to find that you open right back at the close. Thanks for sharing.
Today smells like distribution with short covering as folks who were short or got short after CPI were squeezed.
Well, it didn’t go down to test the trend channel about the downwards movement as I’d expected it to. But it does continue upwards as overall is expected.
If this main wave count is correct then at these prices this should still be the buying opportunity of 2018.
And if the alternate which sees intermediate (4) continuing further is correct, then towards the end of minor wave B upwards pulling stops up to protect a little profit would see members closed out for no risk if the alternate is correct. When B ends and C down unfolds that is.
Lara,
Do you have a thought on the probability of the daily main versus the alternate?
Yes. I think the main is more likely but a fair margin.
I’d judge it to be about 70% likely.
Ari,
Taking half of svxy @ todays close. Can’t resist. I’ll wait for Lara’s direction to re-evaluate the other half.
That was a great hold Jonathan. I closed my position 2 days ago because it wasn’t giving me the bounce I was expecting. UVXY percentage movement are much greater, up and down. But I still made a profit and I’m happy.
Good hold my though my man!
Yes, UVXY “should” move -2x SVXY. I wanted to buy uvxy puts originally but found the bid – offer spread to be too wide at the time. There was better liquidity in the SVXY calls, which was surprising considering it had just dropped 90%!
I’m not so sure. I think this could equally be wave c of an ABC flat in a wave 2 up
Indeed, my take is the bullish view, and there’s an equally valid bearish view, and only further price action will decide. I note that at this moment, price is ALREADY 50% recovered from the ATH drop to the Feb 9 low. Over 6% rise in about 3 trading days. That is a MASSIVE up move, and it’s hard for me to take the bearish outlook in the face of that. But let’s see what tomorrow brings.
Hi Kevin
Regarding your post from yesterday if the ATH to the friday’s low Was wave A.
This could be Wave B for a possible coming C.
Usually in A-B-C corrections are they ususally a 50% Fib retraction?
Which is exactly what we saw today.
I guess tomorrow will tell.
What are your thoughts
Thank You
Suffice to say, that end of day Feb 12/early Feb 13 down move was indeed the “2”, and price is now in a 3 up. My best guess is that this 3 finishes around the Feb 7 high at 2728. Then a 4 and the 5 takes price up to the 1.27% extension around 2785.
Don’t forget…the 200 SMA was hit TWICE, once in after hours market, then again in a day session. I think price is up and away here, not heading back down. Soon anyway.
Hi Kevin if you are correct do you expect a correction after the 2785?
And if so What are your thoughts on the Down side after that?
Thank You
Can someone explain to me why XIV still sits in the 5-6 range, even as VIX and VIX futures (/VX is what I’m looking at in ToS) drop from the 40’s and 50’s to below 20? Why isn’t and why shouldn’t XIV be motoring up at lightspeed??? I don’t get it (I don’t get lots of things). And no I don’t hold any, just curiousity.
Because the issuer, Credit Suisse, has issued a call on all outstanding shares of XIV.
Yes. But….as long as it’s active and available to be bought/sold, shouldn’t it be tracking what it’s supposed to track??? I still don’t get it, sorry. I guess it’s “right”, because no one seems to be upset about it, but I just don’t understand it. I’d expect that thing to be back to 30, 40, 50 by now? Maybe more? Obviously I’m quite ignorant about what’s really going on with how XIV gets priced. Or…???
It’s Broke! Trading ends on the 20th. Why the 20th??? To suck some fools in… I guess.
For anyone interested, I think HAL looks very profitable on the long side right now. ITW too.
Price is now above the 76% retrace of the C wave down. Usually that means price will move up minimally to the 100% (2727.50), and very often to the 127% (around 2765). My hourly trend indicator has for the first time since the crash gone to green, just right now. On the daily, there’s a break up and away from what I use as a volatility band (21 period average of bollinger bands and keltner channels), and that is often a strongly bullish signal.
Correction, my hourly trend indicator went positive mid-late yesterday. Too bad I didn’t believe it, lol!!!
A market can consolidate both gains and losses. Right now in seems to be in the process of doing the latter. Even if we are consolidating prior to a sustained move higher, the smart entry will be on a test and strong bounce off the recent lows… 🙂
Hear you and waiting…anyone watching SHOPIFY….unreal
The situation with interest rates is really fascinating. I think rates are ultimately going higher and with global debts at unprecedented levels, this will be the trigger that blows up the factory. However, at the moment short bonds, both 30 and 10 year, is now an incredibly crowded trade and there is going to be a shake-out…there always is. The 30 year bond is also not at very long term support that has heralded the start of economic downturns and the long bond heading back toward the top of the channel. I suspect that this time we are going to see BOTH equities and bonds implode, NOT what a lot of folk are expecting!
The 30 Year Yield is near MAJOR Resistance!
When, If 30 Year T Yield penetrates 3.26% and accelerates higher in the blink of an eye… That is the only signal for a Higher Range of Yields and a sign that inflation may materially blip up!
Until that happens no worry at all about a material and lasting blip up in the inflation rate! A slow long-term gradual increase in inflation will come with the New wave of Growth in the USA that is just beginning!
The market Cry Babies can go to hell for now! Markets go up and markets go down… The retaining wheels have come off! The market is no longer going to go straight up like the last 6 years. The Fed Put is DONE! Get used to it… Babies! You may get you knee skinned and you may feel some pain! The Algo’s models are all out the window and now deemed useless! SO you computer programmers and mathematicians… go to hell! Your free ride to profits IS NOW OVER!
Funny how it all changed the minute they showed Yellen the exit.
A few years ago she was smugly talking about the Chinese banksters not being “deft” enough during their market melt-down. Powell may well be cut from a different cloth. We will see!
Yesterday’s and today’s SPX action all looks corrective to me. Perhaps today’s high is the end of ‘b’ up with wave ‘c’ down yet to come to complete this 2nd wave correction
I have to resort to higher order logic here. I do “believe” the market top is NOT in. This market will move back to new ATH’s. The bounce off the current bottom is strong. The 34/8 ema’s on the hourly have now cross to the positive side. I don’t want to sit and watch another 50 points click off if/as the market rises. So I’m long (although at a quite small level). If it drops below the hourly 34 ema, I”m out with a loss, and will look to try again at a lower price, with larger size. Eventually, I get a ride up using the 34 ema as my stop and mechanism to not exit too early. Eventually…
yup, I have shorts ready to stop in on a roll lower
BTW, on an hourly chart, the 8 and 34 period EMA’s are all tied up here. If price continues break upward, well, I like the long side, and riding the 34 period up may be a good play. Similarly if it turns tail and starts heading into a serious 2.
So where are we at C over? Impulse up? I’m easily confused.
No clue.
All I can say is, today, there are higher and higher swing lows. The general pressure is “up”…so far. Otherwise, it’s a choppy mess.
I got a impulse working with short term target of 2692…
Great call!!!
No real change on the 5 hour chart; the rangebound sideways coil continues. I still expect the break from this range to be to the downside.
Kevin,
Yesterday, you mentioned your interest in gold. I hope your NUGT is shining like mine is today!
Joseph,
Regarding today’s comment, are you always so subtle? Well, I always appreciate a person who does not beat around the bushes. Sometimes you make me laugh out loud like calling people ‘dumb-asses’. But I am glad you are not worried about inflation. I trust your thoughts on this.
Everyone,
Have a great day and don’t forget, it is both Valentine’s Day and Ash Wednesday. Any historical facts about the markets on Valentine’s Day or Ash Wednesday?
Nice play in NUGT, I see it’s acting like a Falcon Heavy! I’m in GLD.
I must admit, I had to look up ‘Falcon Heavy’. Elon Musk certainly makes news along with rocket ships.
I am not in that, I am in AG & GDXJ.
AG short position moved up to 13.60% of Float 1-31 & 2-1 to present more shorted. SSq may come into play soon into $8++++!
Nothing more challenging than a market in the midst of a massive 4 wave! Choppy muck. The action is in GLD and TMV, IMO! I’m letting this little bull/bear war in SPX sort itself out, as I guess those two camps disagree on gangland boundaries. I’ll wait for a victor.
There is the move down… markets are a bunch of cry babies! Afraid of an extra 1/4 % move up in the Fed Funds Rate for 2018. Waaa Waaa Waaaa!
Yet a 30 Year Treasury is still only at a 3.14% Yield!
NO… NONE… ZERO… worry about inflation showing at all in a 30 Year Treasury at a 3.14% Yield! That is the smart money! All the rest are a bunch of dumb asses!
STOP all the BS! Time for the Lara main hourly bounce!
Joseph,
I am still hoping for 2,585 level (maybe a little lower for scaring the mom players) as lat two days momentum players bought and now with market dropping below 2,639 key level, many will likely bailout.. Waiting and watching how this develops but overall until there is fear in the buy the dip buyers this market has not hit a tradeable bottom. The last few days ramp was bit too fast for a healthy market.
To me… the momentum players and the algos are the dumb asses!
Yep. We will almost certainly test the recent lows around the 200 and how price reacts there will tell us how long this correction, or otherwise is likely to be. There is a long term trend-line in that area as well that should be revisited prior to any serious run higher….
Gap down C?
https://www.bloomberg.com/news/articles/2018-02-14/billions-in-vix-rigging-profits-a-battered-index-takes-new-hit
Vix being fixed – no really?
Sorry, correction – don’t think we can be as the second wave in that flat is a five so can’t be a b.
I think we are in wave c of an abc flat wave 2 which is none of the above counts.
Speedy!!
Allright Doc, we’ll call it a tie!