
Price overshot a support line and has reversed strongly from just below it.
Volume, RSI and the AD line today all point to the same direction next.
Summary: Today’s classic analysis favours a low in place: a piercing pattern, long lower candlestick wick on the daily chart, strong volume for upwards movement within today’s session, single day divergence with RSI from oversold, a bullish signal from the AD line, and a strong bounce after an overshoot of support.
A breach of the yellow best fit channel on the hourly charts would add some confidence to the idea a low may be in place. The targets are either 2,909, 2,920 or 3,104.
Always practice good risk management. Always trade with stops and invest only 1-5% of equity on any one trade.
The biggest picture, Grand Super Cycle analysis, is here.
Last historic analysis with monthly charts is here. Video is here.
An historic example of a cycle degree fifth wave is given at the end of the analysis here.
MAIN ELLIOTT WAVE COUNT
WEEKLY CHART
Click chart to enlarge.
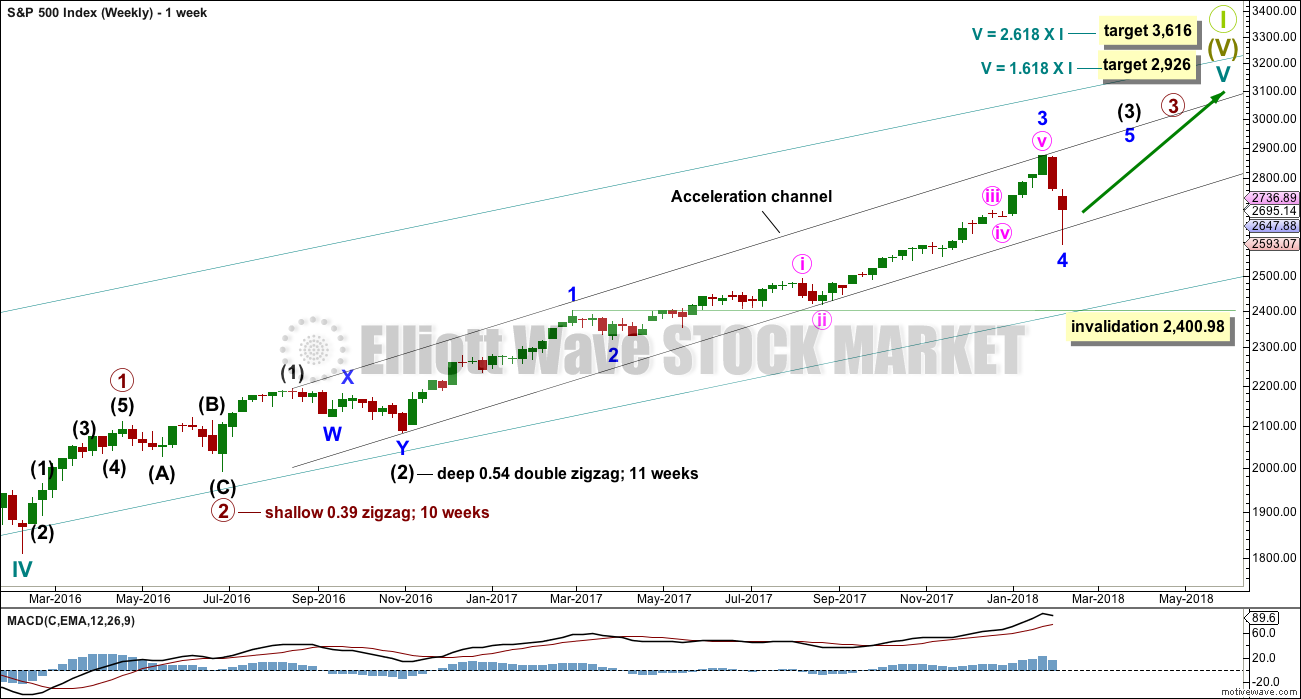
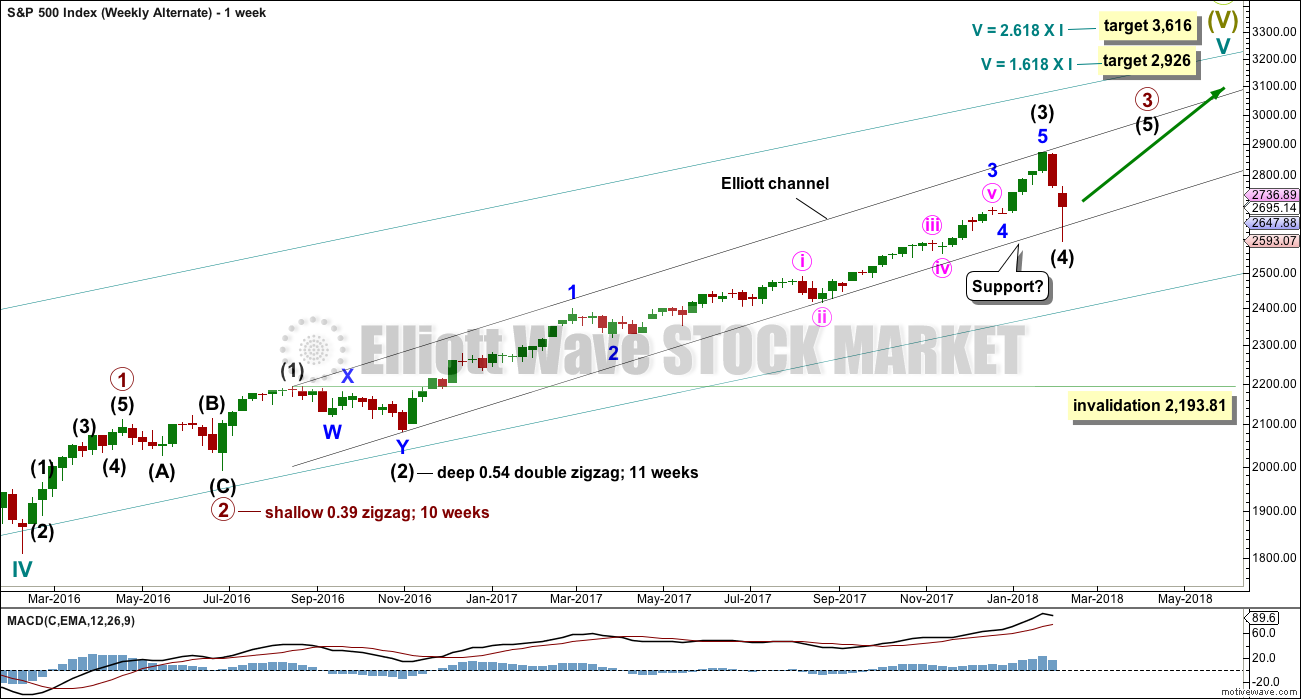
Cycle wave V must complete as a five structure, which should look clear at the weekly chart level. It may only be an impulse or ending diagonal. At this stage, it is clear it is an impulse.
Within cycle wave V, the third waves at all degrees may only subdivide as impulses.
Within cycle wave V, the corrections for primary wave 2 and intermediate wave (2) both show up clearly, both lasting several weeks. The respective corrections for intermediate wave (4) and primary wave 4 would most likely also last several weeks, so that they show up at weekly and monthly time frames. The right proportions between second and fourth wave corrections give a wave count the right look. This wave count expects to see two large multi week corrections coming up.
Cycle wave V has passed equality in length with cycle wave I, which would be the most common Fibonacci ratio for it to have exhibited. The next most common Fibonacci ratio would be 1.618 the length of cycle wave I. This target at 2,926 now looks too low. The next most common Fibonacci ratio would be 2.618 the length of cycle wave I at 3,616. This higher target is looking more likely at this stage.
Intermediate wave (3) has passed all of equality in length with intermediate wave (1), and 1.618 and 2.618 the length of intermediate wave (1). It is possible that intermediate wave (3) may not exhibit a Fibonacci ratio to intermediate wave (1). The target calculation for intermediate wave (3) to end may have to be done at minor degree; when minor waves 3 and 4 are complete, then a target may be calculated for intermediate wave (3) to end. That cannot be done yet.
The many small subdivisions within minor wave 3 may be seen in several different ways. The pullback may be minor wave 4. Minor wave 2 was a shallow 0.25 double zigzag lasting 4 weeks. Minor wave 4 may be a single zigzag, or it may also be a sideways flat, combination or triangle which may last longer. So far minor wave 4 is 0.51 the depth of minor wave 3, and so now there is alternation in depth.
If minor wave 4 ends this week at support, then it would look reasonably in proportion to minor wave 2.
The black acceleration channel is drawn about intermediate waves. It shows where downwards movement may find support. If this support holds, then it is possible that minor wave 4 could be over.
The alternate hourly wave count below will consider the possibility that minor wave 4 may continue lower. Minor wave 4 may not move into minor wave 1 price territory below 2,400.98.
DAILY CHART
Click chart to enlarge.
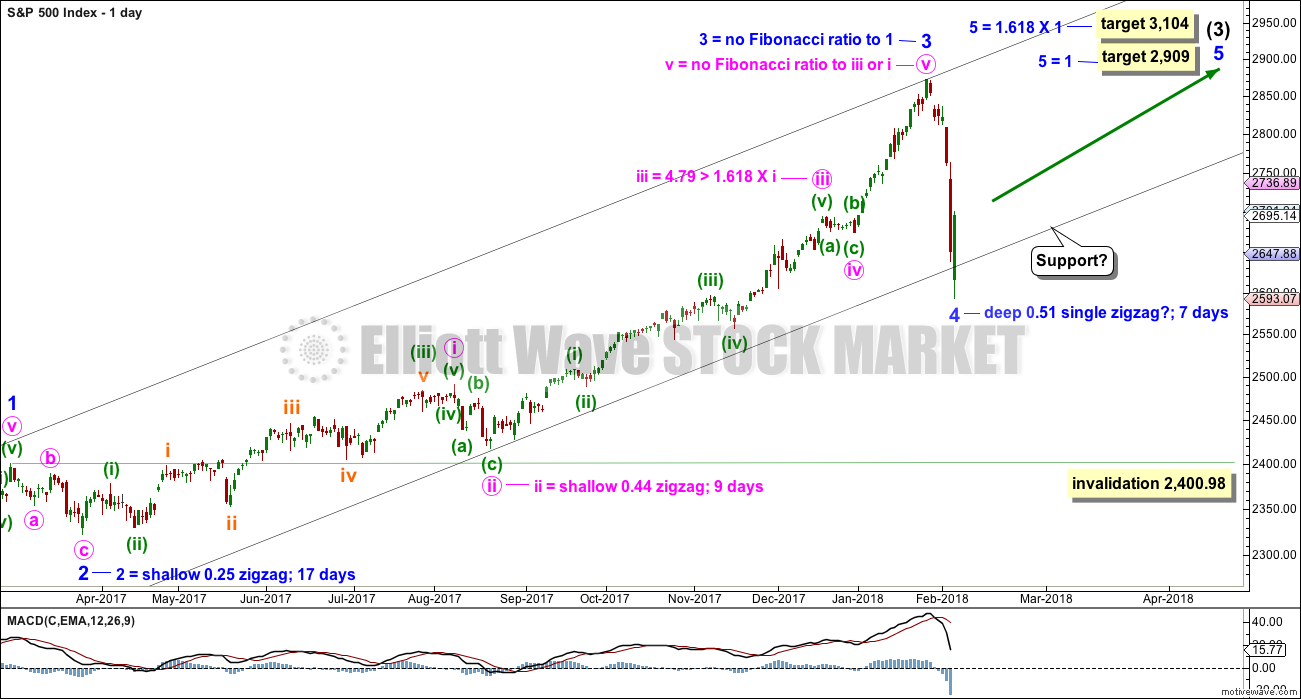
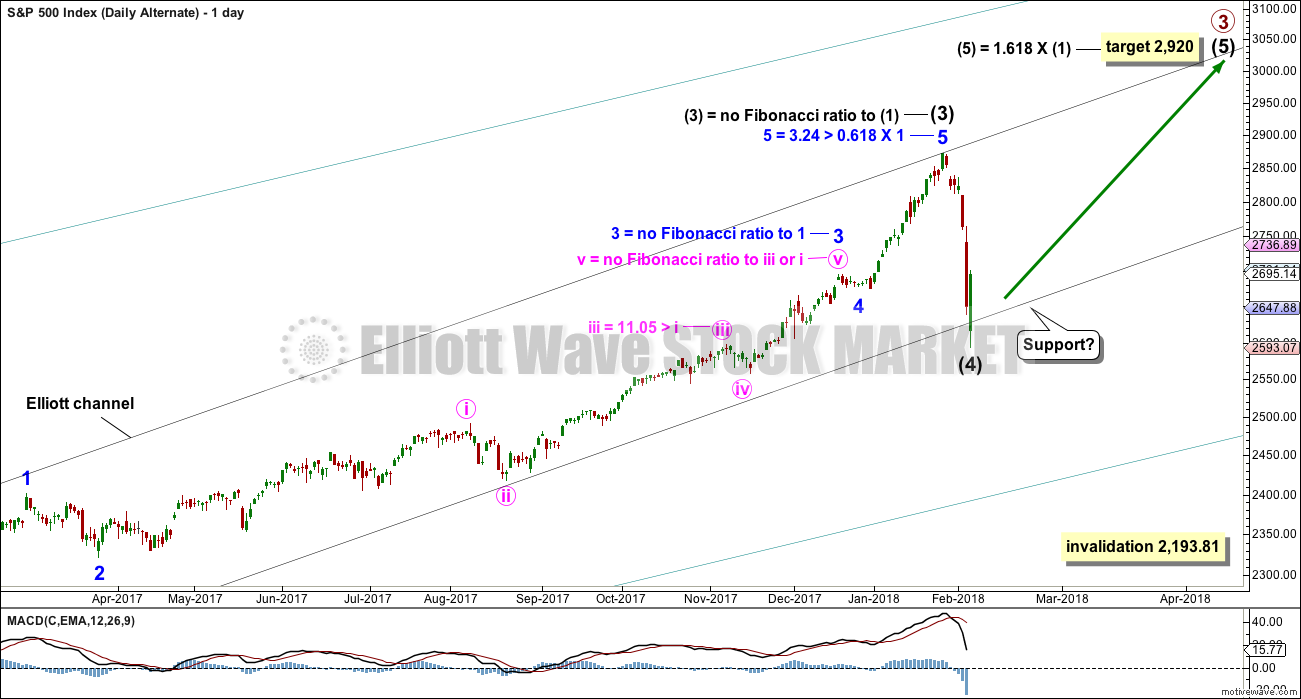
The black acceleration channel is copied over to this daily chart. Minor wave 4 has now overshot the channel, but at the daily chart level the channel is not breached. As this downwards movement was swift and strong an overshoot is entirely acceptable.
Fibonacci ratios for this main wave count and for the alternate below are provided on both daily charts. There is not enough difference between the two wave counts in terms of Fibonacci ratios to indicate which may be more likely.
Two targets are today provided for minor wave 5 to complete the impulse of intermediate wave (3).
HOURLY CHART
Click chart to enlarge.
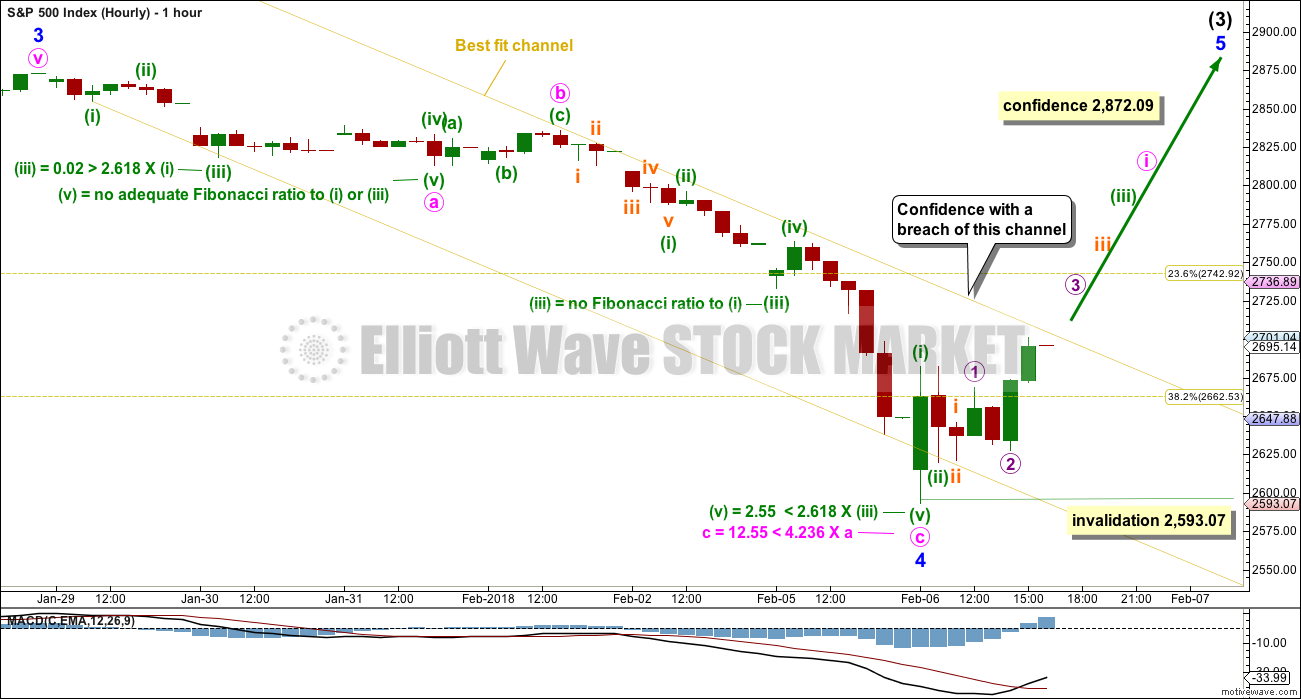
This first hourly chart has support today from classic technical analysis.
If a low is in place, then minor wave 4 may be a complete zigzag.
Some confidence in this wave count may be had if the yellow channel is breached by upwards movement. Strong confidence may be had in this wave count with a new high by any amount at any time frame above 2,872.09.
If a new wave up is beginning, then it may have started today with three small overlapping first and second waves. This indicates some increase in upwards momentum tomorrow.
Minute wave ii may not move beyond the start of minute wave i below 2,593.07.
ALTERNATE HOURLY CHART
Click chart to enlarge.
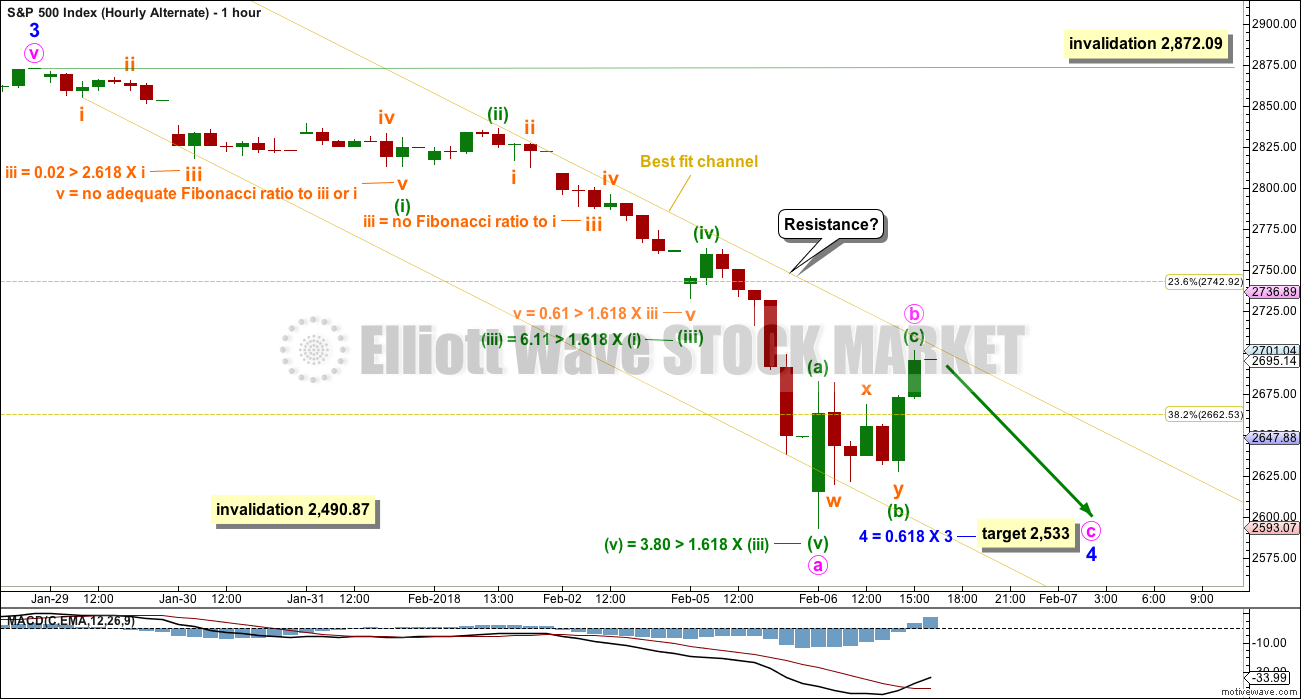
It is also possible that minor wave 4 may be an incomplete zigzag. Minute wave b within it may find resistance about the upper edge of the yellow best fit channel.
This wave count expects minor wave 4 to end within about one to a few days.
ALTERNATE WAVE COUNT
WEEKLY CHART
Click chart to enlarge.
Despite the brevity of this downwards movement, the size of it means the possibility must be considered that intermediate wave (4) has arrived and may be over at today’s low.
Even though intermediate wave (2) lasted 11 weeks, if intermediate wave (4) is over here within just two weeks, it would still have about the right look on the weekly and daily charts due to its size.
The black channel is drawn in exactly the same way on all charts today. Here it is correctly termed an Elliott channel about the impulse of primary wave 3. In the first instance, expect intermediate wave (4) may find support about the lower edge. This would see it over here or very soon indeed.
When the S&P has strong downwards movement to end corrective waves on the daily and weekly time frames, it often ends with an overshoot of a channel. The end of cycle wave IV on the bottom left of this chart is a good example: the S&P overshot the teal channel and it quickly turned up there. The overshoot today of intermediate wave (4) looks similar.
Fourth waves are not always contained within a channel drawn using Elliott’s first technique. This is why Elliot developed a second technique to redraw the channel when the fourth wave breached it. If intermediate wave (4) does continue lower, then the channel may have to be redrawn.
Intermediate wave (4) may not move into intermediate wave (1) price territory below 2,193.81.
DAILY CHART
Click chart to enlarge.
If intermediate wave (4) is over here, then a target for intermediate wave (5) may be calculated. Were intermediate wave (5) to only reach equality in length with intermediate wave (1) it would be truncated. The next Fibonacci ratio in the sequence is used to calculate a target. If intermediate wave (4) moves lower, then this target must also move correspondingly lower.
At the hourly chart level, this alternate idea works in exactly the same way as the main wave count. Both hourly charts work for this alternate, only the degree of labelling would be one degree higher.
TECHNICAL ANALYSIS
WEEKLY CHART
Click chart to enlarge. Chart courtesy of StockCharts.com.
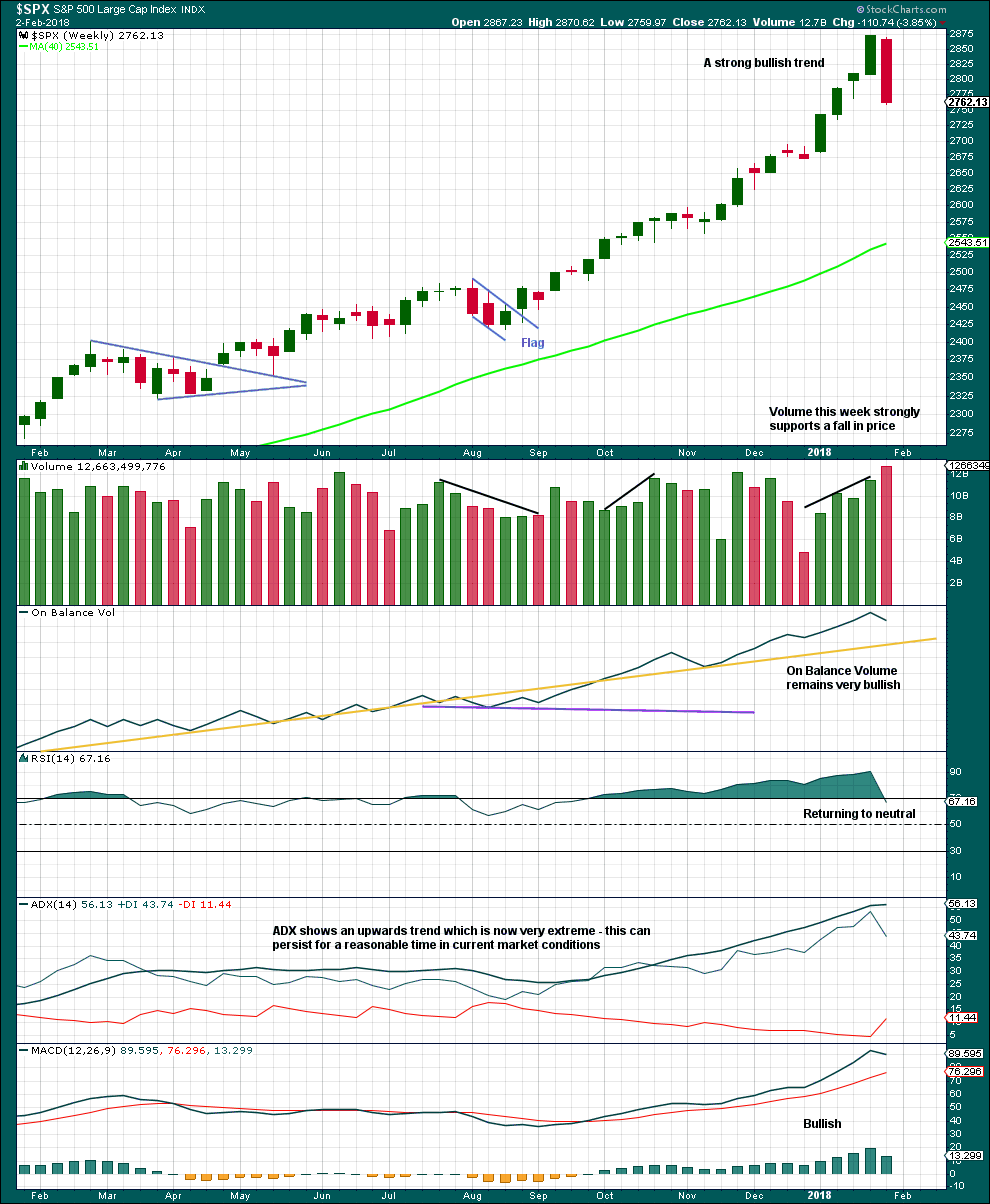
This strong bearish weekly candlestick is not technically a bearish engulfing reversal pattern because the open this week gapped lower. However, the close this week well below last week’s open is very bearish. Support from volume is also very bearish.
DAILY CHART
Click chart to enlarge. Chart courtesy of StockCharts.com.
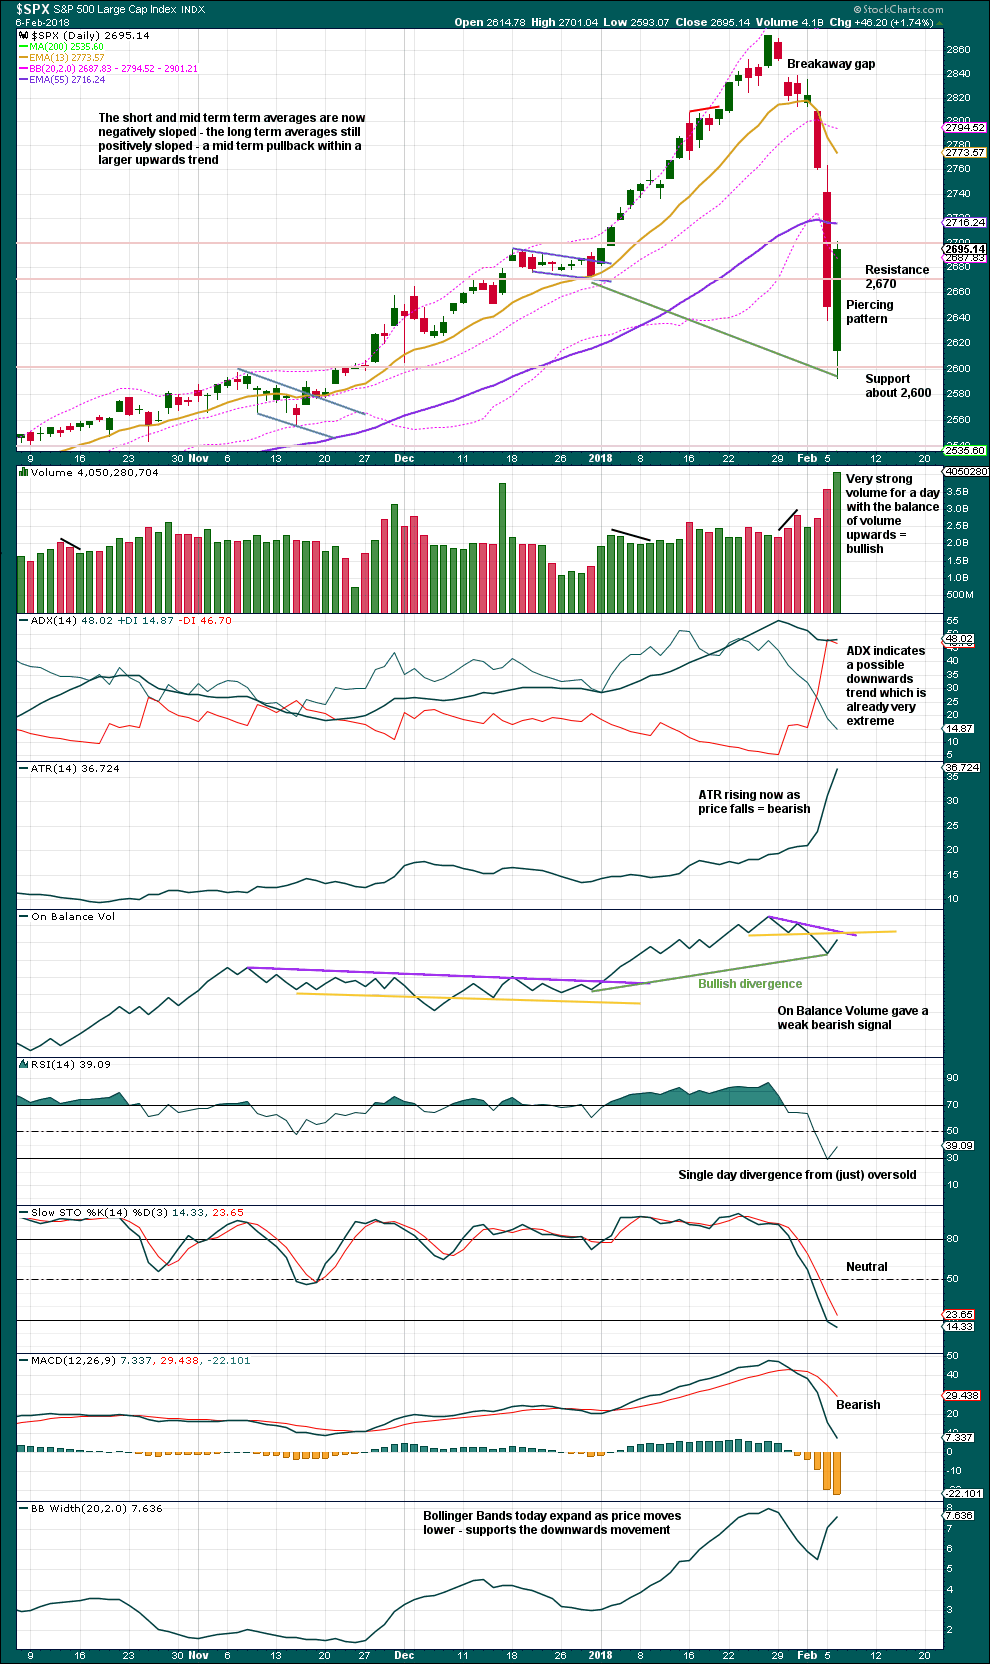
Price has bounced up strongly from support about 2,600.
A piercing pattern requires the close of the second daily candlestick to be at least halfway within the real body of the first daily candlestick. Today’s close is 50.15% of the prior day’s real body, and so meets the requirement for a piercing pattern but only just.
The long lower wick on today’s candlestick is also bullish. Volume is bullish.
Resistance for On Balance Volume is close by, but it is weak.
RSI gives a bullish signal. It is common at lows for the S&P for RSI to reach into oversold and then exhibit divergence with price, even single day. The new low for price today is not matched by a new low for RSI; this divergence is bullish.
ADX is bearish and Stochastics indicates there is room for price to fall further. Next support is about 2,540.
VOLATILITY – INVERTED VIX CHART
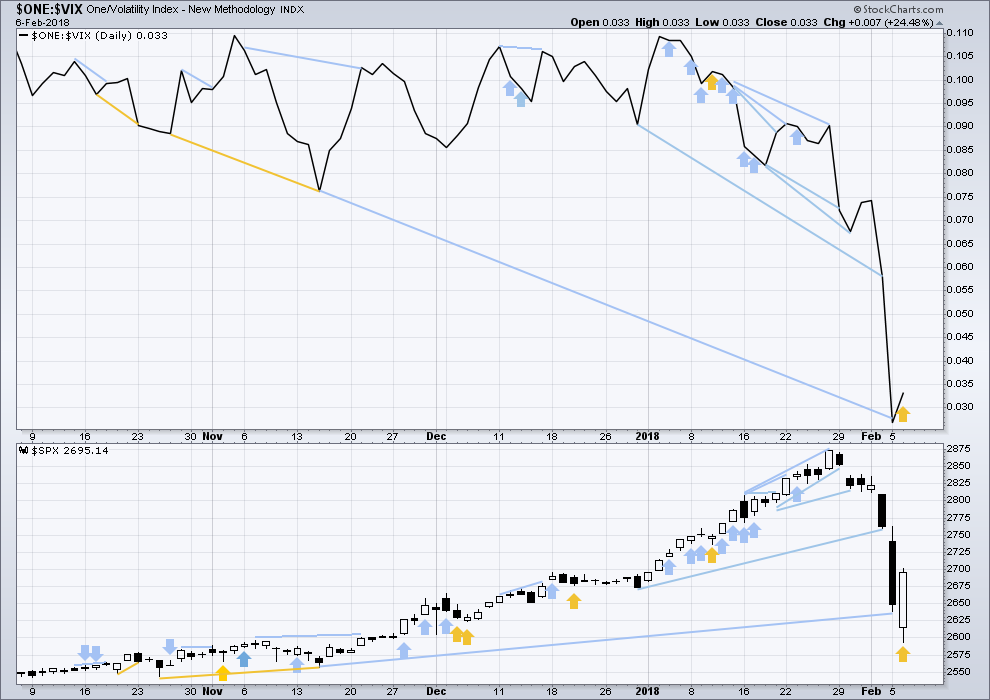
Click chart to enlarge. Chart courtesy of StockCharts.com.
So that colour blind members are included, bearish signals will be noted with blue and bullish signals with yellow.
Normally, volatility should decline as price moves higher and increase as price moves lower. This means that normally inverted VIX should move in the same direction as price.
There is single day divergence between price and inverted VIX: price has made a new low, but inverted VIX has moved higher. This is interpreted as bullish.
BREADTH – AD LINE
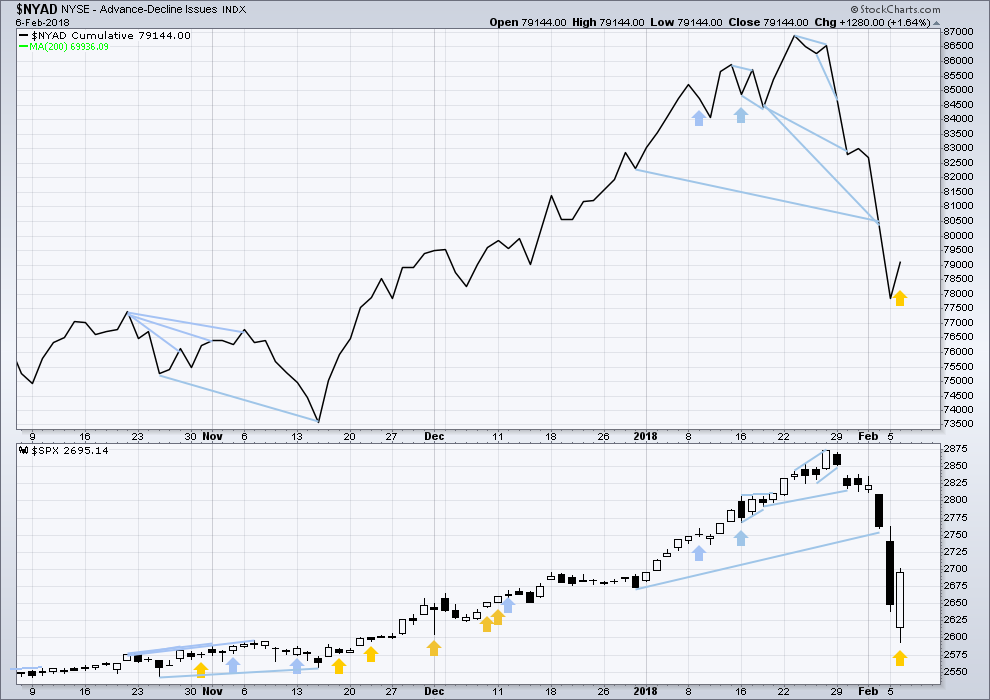
Click chart to enlarge. Chart courtesy of StockCharts.com.
There is normally 4-6 months divergence between price and market breadth prior to a full fledged bear market. This has been so for all major bear markets within the last 90 odd years. With no longer term divergence yet at this point, any decline in price should be expected to be a pullback within an ongoing bull market and not necessarily the start of a bear market.
All of small, mid and large caps last week made new all time highs. This market has good support from rising breadth.
Breadth should be read as a leading indicator.
There is no longer any mid or long term divergence with price and the AD line. There is single day divergence today: the new low for price was not matched by a new low for the AD line. This is bullish.
DOW THEORY
All indices have made new all time highs as recently as three weeks ago, confirming the ongoing bull market.
The following lows need to be exceeded for Dow Theory to confirm the end of the bull market and a change to a bear market:
DJIA: 17,883.56.
DJT: 7,029.41.
S&P500: 2,083.79.
Nasdaq: 5,034.41.
Charts showing each prior major swing low used for Dow Theory are here.
Published @ 10:08 p.m. EST.
Anyone heard about the trader in Singapore who had over one million in XIV? 🙁
Taking a look at price action today and I must say I remain bearish. Long upper wick and futures vol higher were notable. I am also curious about no lower high on VIX on a final impulse down. The ideal outcome would be for a new low ahead of the turn higher and that would suggest a fourth wave of some kind underway. I have no idea if that is possible with a valid EW count but that, or a “B” or second wave of some sort is the way it looks to me from a trading perspective. The move up looks corrective. Have a great evening everyone!
Getting buy triggers in SPX, with a very similar bottoming/turn pattern to yesterday’s much larger such pattern.
thankfully I didn’t take said buy triggers, lol!! At least, nyet. Isn’t the increased price volatility awesome? I like it.
Double edged sword. Option premiums higher. Spreads absolutely awful.
Vol acting somewhat cagey. I am starting to wonder if we are going to see the opposite extreme, with vol steadily trending higher with the market. No one has ever seen or currently expects that kind of price action. Is It possibly the way a slow unwind will unfold with a steady but orderly exit from the big vol short?!
Main hourly chart updated:
Looks like a small fourth wave Kevin. An impulse unfolding upwards?
The channel is clearly breached, now price has curved down to test support at the upper edge which looks so far like typical behaviour.
Thank you for the timely update LARA !
Hmm, so far, so good. Definitely looks like we’re testing the bottom of the channel right now. Far, far weaker volume than yesterday though, so I’d say support is in favor of upward movement. Also VIX and VIX futures are down (but UVXY up?–next months futures adjusting to higher baseline volatility?)
SPX bouncing off a 38% fibo for second time, this another 2 completed here?
Vol futures on the move higher. Somebody thinks we are not out of the woods yet…VIX also moving up off morning’s lows; not the price action one would expect in an impulsive move higher. I see a few warning flags….
FB broke down fron an ED. Target is 145.00
The charts of quite a few Nasdaq stocks are really quite ominous and making me really cautious about the broader markets. Breadth in Nasdaq has been deteriorating for months and when the leaders start flagging, the drop is going to be truly ugly….
A cursory glance at B bands suggesting GLD approaching reversal. DUST flying high above its own upper B band so the miners may also be due for at least a bounce…eyeing GLD March 125 calls for trigger..
I think GLD is going to at least it’s 50% fibo at 124.5. I have several symmetric projections to that zone as well. Otherwise, to the 62% fibo around 122 or even the 76% at 120.2. This move down so far looks rather short for a typical gold swing. I’m keeping my powder dry, but ready.
Exiting bearish call spread on USO, and bullish put spread on UUP.
Key pivots coming up and we either see reversals or acceleration of current trends.
I would have really liked to see the 200 dsma tagged before having full confidence in this reversal. I have a bit of hesitation over whether we are done. VIX did post a long upper wick high characteristic of a completing fifth but not a lower intra-day high so that makes me somewhat cautious…
I think it tagged the 200 dma during the overnight tradings session earlier this week, if that counts.
Yep! ES did but the cash session did not get down to it.
We don’t have a second close below upper B band yet but VIX looks good for a short trade here.
On the thesis that what happened to SVXY remains in UVXY’s future, I am starting to accumulate shares.
If I had held onto those SVXY puts for one more day….I could have taken the rest of the year off! (not that I am complaining!) 🙂
Shares of UVXY?
Yep. I plan on buying in the money calls and exercising the options at expiration. At some point UVXY is going to do on the upside, what SVXY did to the downside imho…strange it did not two days ago. All you have to do to discover what a fraud these things are is look at where UVXY was trading when SVXY last traded at around 12. I know there were lots of reverse splits but that is immaterial.
TMV on the move!
Oooh baby!!! Mid and Long term trades steaming ahead!!
I am back. I have been caring for / counseling a dying family member. I will be traveling across the country at the end of this month to be with her. Over the past two or three weeks I have done the same for two unrelated families who lost their sons in tragic automobile accidents. One was 20 years old the other 28. They were both fine young men with so much potential and life ahead of them. So I have been otherwise preoccupied and busy. This part of my work always helps me to keep things in perspective and appreciate every day of life.
I noticed Kevin asked if I got out of my XIV positions in time. I did not. It essentially is a total loss. However, remember Lara’s guidelines to good trading emphasizes risk management. As far as my trading account, it is significant. As far as all my investments / accounts, it is minimal. So I am okay.
I think I feel a bit like Rob Grankowski of the New England Patriots. Not only did he lose a Super Bowl his team was supposed to win. But when he got home, he discovered his house had been burglarized. A double whammy to the psyche. That is me right now.
I should have mentioned, what I call my long term account is a positional account that never uses leveraged vehicles. Therefore the losses are significantly less and should be recovered relatively quickly.
Condolences on all fronts Rodney. Yes, every day of life is a blessing, and we aren’t guaranteed any tomorrows. Sounds like you do extraordinary work. Hope you get your market groove back on quickly!
That is awesome Rod. I am sure you are being of great comfort in a time of tragedy.
Don’t feel too bad about XIV. I have learned in the last day or two that a lot of savvy traders got really slammed on that trade. One or two of them was a real shock as he also posted it as an official trade for his subscribers. I suspect we all saw the same signals as I also went long the market intra-day and bought DIA calls. It soon became clear though that VIX was not going to put in a reversal signal and I got out of Dodge.
I think what a lot of even smart traders completely overlooked is that those leveraged ETNs rebalance after each trading day (by law) so getting into them after what VIX did that day and holding overnight is something I would never even remotely consider. Sorry you got caught in it.
UVXY did not trade correspondingly so something there is not quite right. I am betting that short vol trade is not fully unwound.
UVXY is an ETF not an ETN… I think there is a bit of a lesson in there. Please correct me if I am wrong, but I don’t think a poison pill is in an ETF… a termination event = poison pill.
Good thing small % of portfolio loss for you Rodney. Good thing I didn’t play in that… loss would have been much larger. All should follow Lara’s advice on that. I am hard headed though!
You are correct Joseph. XIV is, SVXY and UVXY are not. Both XIX and SVXY blew up nonetheless. Trading was not halted in SVXY nor UVXY.
Welcome back Rodney 🙂
It looks a bit more likely today that the low is in, so you should be able to make up the losses on the next wave up?
VIX is down, FUTURES down, UVXY up quite a bit. Another big move on deck?
The long lower wicks are indeed suggesting expenditure of significant buying power to arrest declines. In the past that has been a reliable reversal signal as it was sufficient to keep what few sellers there were at bay. I think it would be significant if we started to see the lows of those wicks taken out the next session or two. It would not be long before traders started to notice. They may pretend otherwise, but the short vol trade is now busted. It will be intetesting to see if the VIX holds its 200 day MA…
Nice one. Wabbit appears to be sleeping in again. We’ll see. I am partial to the idea of a low being in simply due to the velocity of the downward movement we saw and the extremely long lower wick on the futures chart.
OK Doc, Whose the boss bunny around hete?! Yer in my space….again!!