
Price remains mostly within the channel on the hourly chart; it has not been breached. The Elliott wave count is unfolding mostly as expected.
Summary: The trend is up and strong. Corrections are an opportunity to join the trend.
The next target is at 2,874 for a very short term interruption to the trend (it may be over within a day), and the target after that is at 2,951 for another short term interruption to the trend (it may be over within a week).
This looks like a third wave that is still incomplete. It may have just passed the middle strongest portion, so look for volatility to increase as a series of fourth waves unfold.
Always practice good risk management. Always trade with stops and invest only 1-5% of equity on any one trade.
The biggest picture, Grand Super Cycle analysis, is here.
Last historic analysis with monthly charts is here. Video is here.
An historic example of a cycle degree fifth wave is given at the end of the analysis here.
MAIN ELLIOTT WAVE COUNT
WEEKLY CHART
Click chart to enlarge.
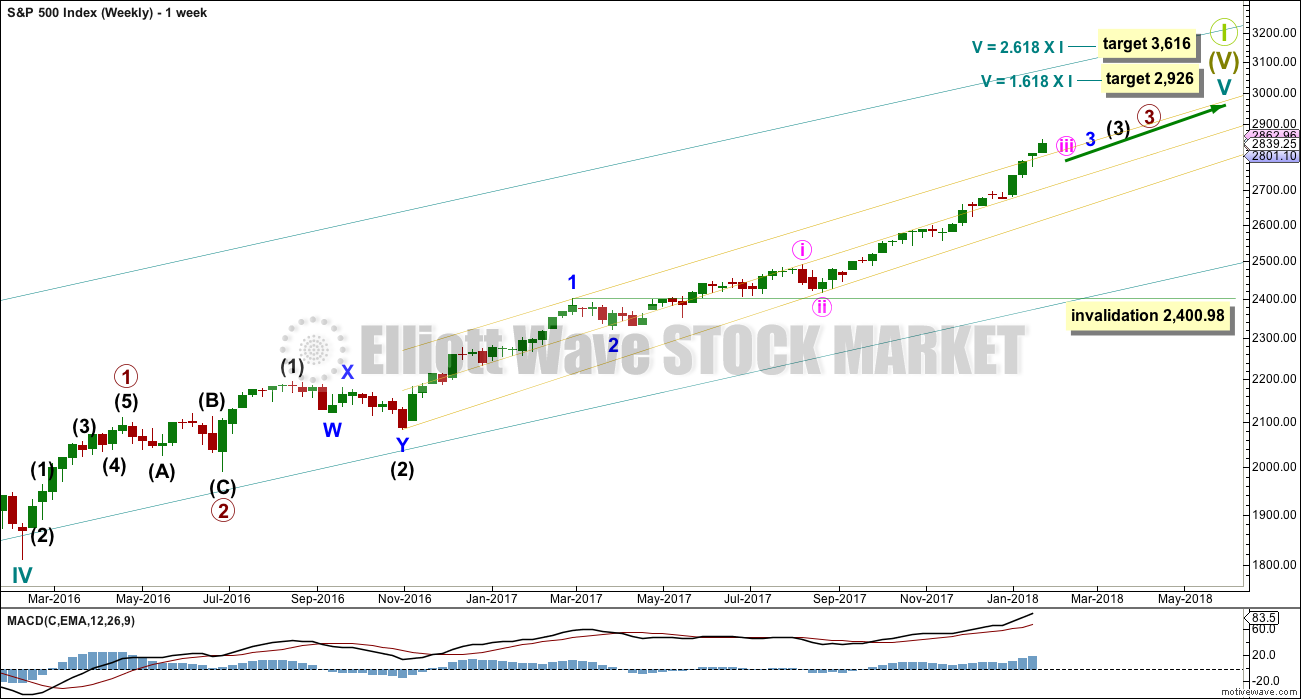
Cycle wave V must complete as a five structure, which should look clear at the weekly chart level. It may only be an impulse or ending diagonal. At this stage, it is clear it is an impulse.
Within cycle wave V, the third waves at all degrees may only subdivide as impulses.
Within cycle wave V, the corrections for primary wave 2 and intermediate wave (2) both show up clearly, both lasting several weeks. The respective corrections for intermediate wave (4) and primary wave 4 should also last several weeks, so that they show up at weekly and monthly time frames. The right proportions between second and fourth wave corrections give a wave count the right look. This wave count expects to see two large multi week corrections coming up.
Cycle wave V has passed equality in length with cycle wave I, which would be the most common Fibonacci ratio for it to have exhibited. The next most common Fibonacci ratio would be 1.618 the length of cycle wave I. This target at 2,926 now looks too low. The next most common Fibonacci ratio would be 2.618 the length of cycle wave I at 3,616. This higher target is looking more likely at this stage.
Intermediate wave (3) has passed all of equality in length with intermediate wave (1), and 1.618 and 2.618 the length of intermediate wave (1). It is possible that intermediate wave (3) may not exhibit a Fibonacci ratio to intermediate wave (1). The target calculation for intermediate wave (3) to end may have to be done at minor degree; when minor waves 3 and 4 are complete, then a target may be calculated for intermediate wave (3) to end. That cannot be done yet.
When minor wave 3 is complete, then the following multi week correction for minor wave 4 may not move into minor wave 1 price territory below 2,400.98. Minor wave 4 should last about four weeks to be in proportion to minor wave 2. It may last about a Fibonacci three, five or even eight weeks if it is a time consuming sideways correction like a triangle or combination. It may now find support about the mid line of the yellow best fit channel. If it does find support there, it may be very shallow. Next support would be about the lower edge of the channel.
A third wave up at four degrees may be completing. This should be expected to show some internal strength and extreme indicators, which is exactly what is happening. Members are advised to review the prior example given of a cycle degree fifth wave here. The purpose of publishing this example is to illustrate how indicators may remain extreme and overbought for long periods of time when this market has a strong bullish trend. If the current wave count is correct, then the equivalent point to this historic example would be towards the end of the section delineated by the dates November 1994 to May 1996. In other words, the upwards trend for this fifth wave may only have recently passed half way and there may be a very long way up to go yet.
DAILY CHART
Click chart to enlarge.
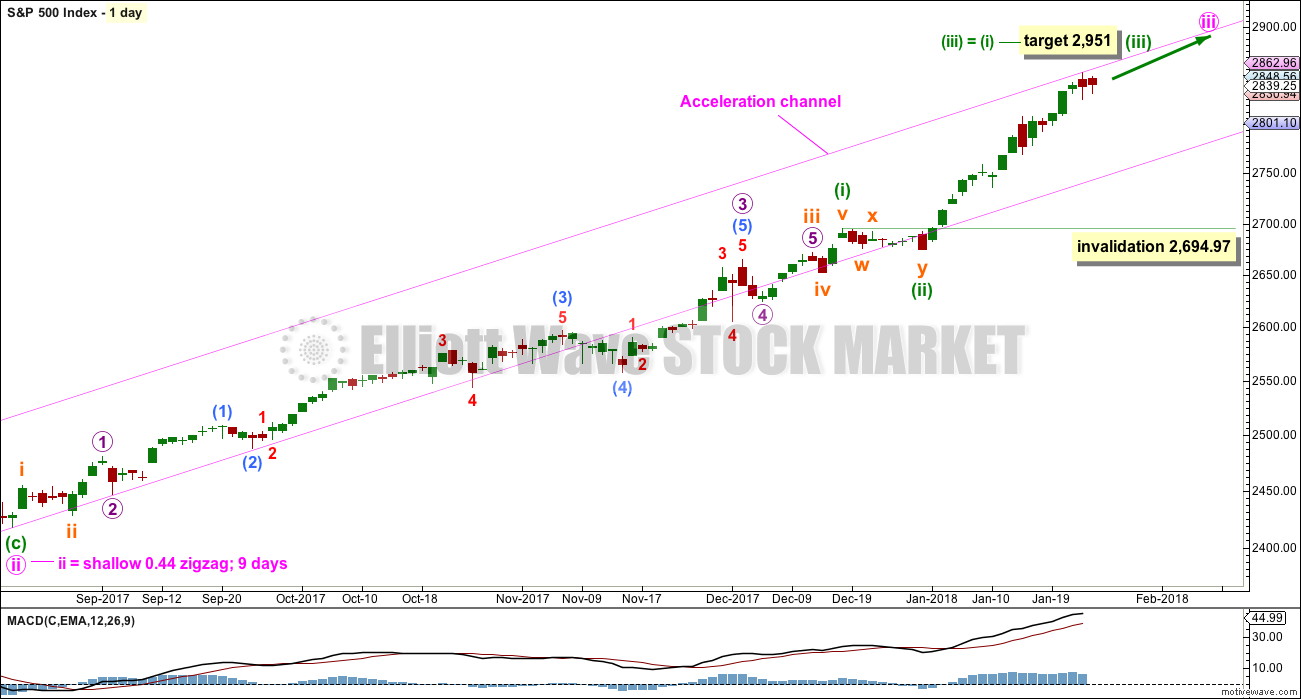
Keep redrawing the acceleration channel as price continues higher: draw the first line from the end of minute wave i to the last high, then place a parallel copy on the end of minute wave ii. When minute wave iii is complete, this would be an Elliott channel and the lower edge may provide support for minute wave iv.
The focus for the short term will be on identifying the next multi week interruption to the upwards trend.
A target for minuette wave (iii) fits only with the second higher target on the weekly chart.
Minuette wave (ii) subdivides as a combination and lasted only eight sessions, about only one and a half weeks. Minuette wave (iv) may be a zigzag, which tend to be quicker structures than combinations; a Fibonacci five days will be the first expectation, but it may be over within less than one week.
Because minuette wave (i) was a long extension, minuette wave (iii) may be shorter or only about equal in length. If minuette wave (iii) is about equal in length with minuette wave (i), then they would both be long extensions. Only two actionary waves within an impulse may be extended. If both minuette waves (i) and (iii) are extended, then minuette wave (v) may not extend.
Minuette wave (iv), when it arrives, may not move into minuette wave (i) price territory below 2,694.97.
HOURLY CHART
Click chart to enlarge.
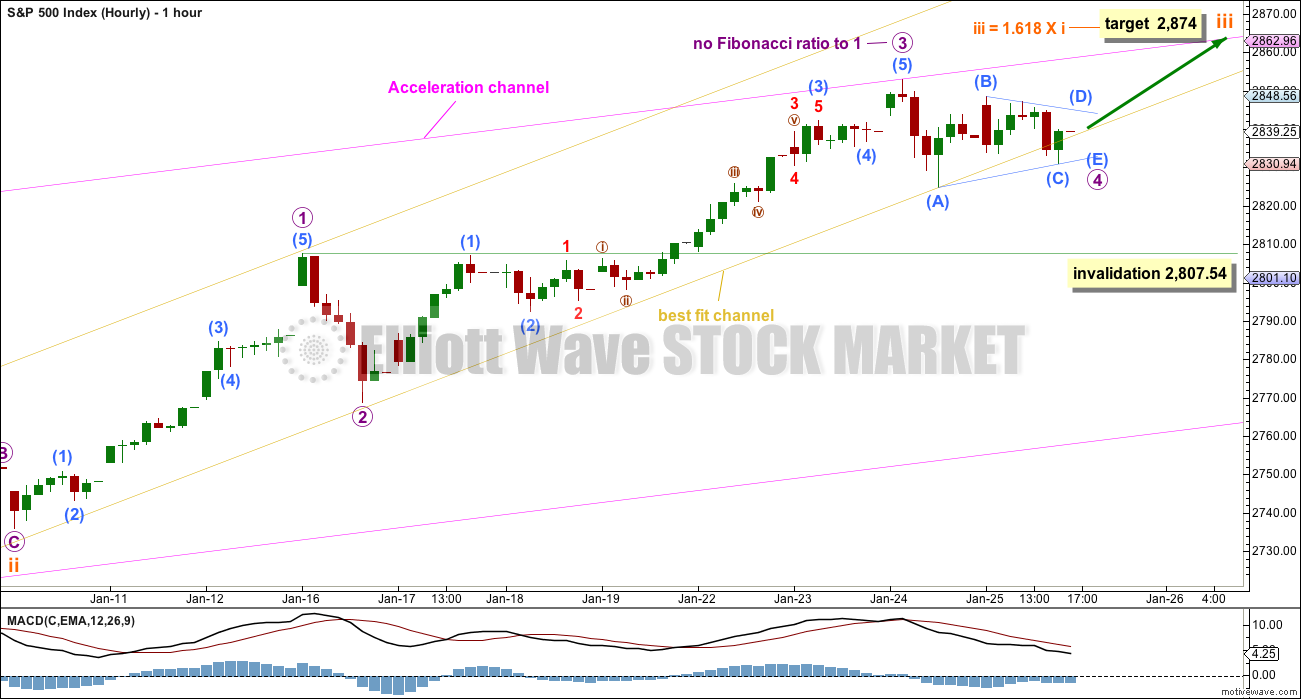
Always assume that the trend remains the same until proven otherwise. At this stage, there is no technical evidence for a trend change; we should assume the trend remains upwards.
Subminuette wave iii is extending, and within it micro waves 1, 2, and 3 may be complete. Sideways movement for today’s session now fits best as a small triangle for micro wave 4.
The target is again a single price point and not a zone. When micro wave 4 may again be seen as complete, then the target may again be widened to a zone calculated at two degrees. That may be able to be done tomorrow.
Micro wave 4 is overshooting the best fit channel. The S&P does have an unfortunate tendency to not respect support lines as it comes to a long slow curving top. A breach of this best fit channel is not necessarily an indication of a trend change for this reason.
Because subminuette wave ii lasted only 4 hours and was over within one session, the upcoming correction expected for subminuette wave iv may also be as brief. It does not have to be, but it would most likely be.
Micro wave 4 may not move into micro wave 1 price territory below 2,807.54.
TECHNICAL ANALYSIS
WEEKLY CHART
Click chart to enlarge. Chart courtesy of StockCharts.com.
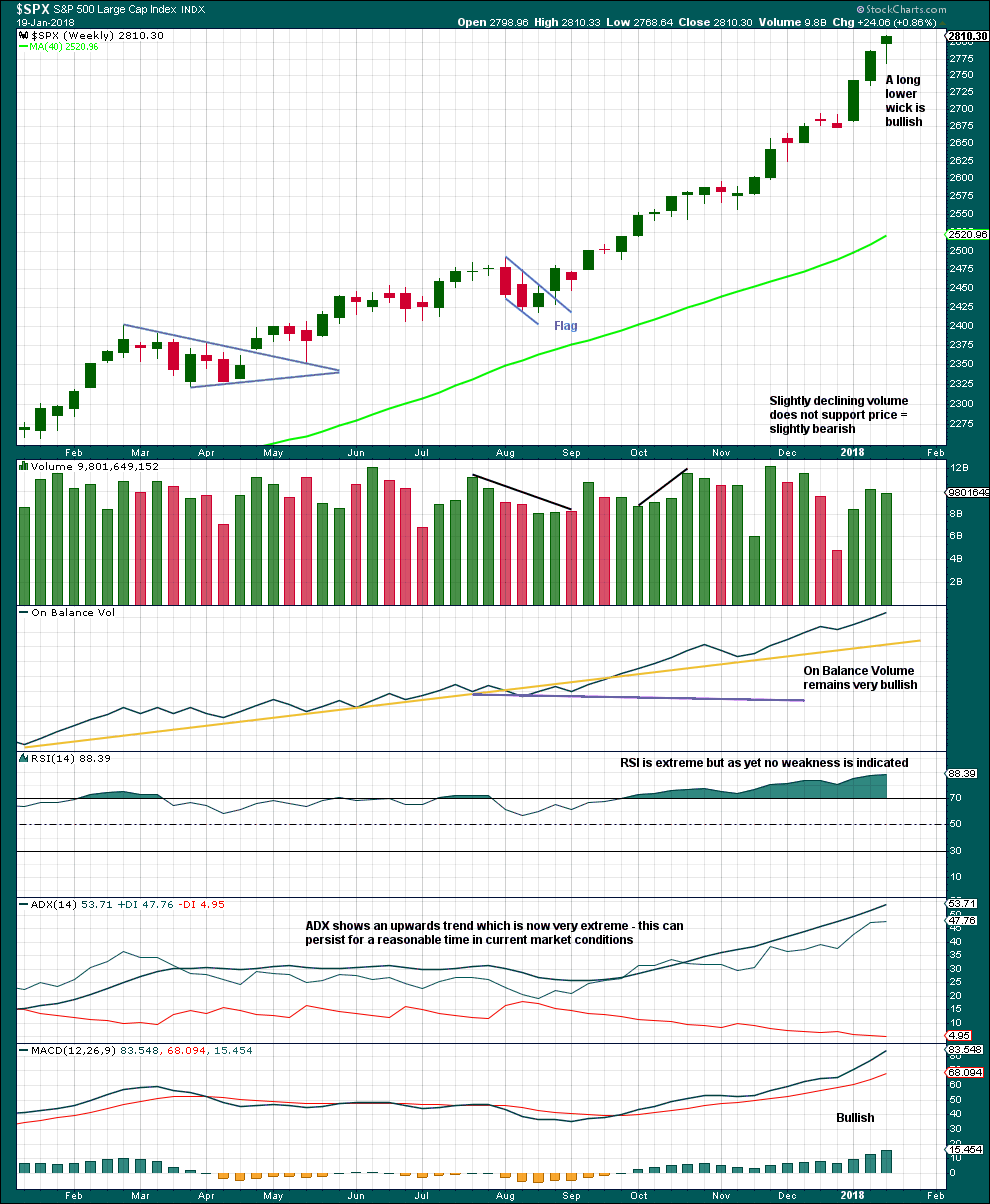
This upwards trend is extreme and stretched, but there is still no evidence of weakness at the weekly time frame.
As a third wave at multiple degrees comes to an end, it would be reasonable to see indicators at extreme levels.
A correction will come, but it looks like it may not be here yet.
DAILY CHART
Click chart to enlarge. Chart courtesy of StockCharts.com.
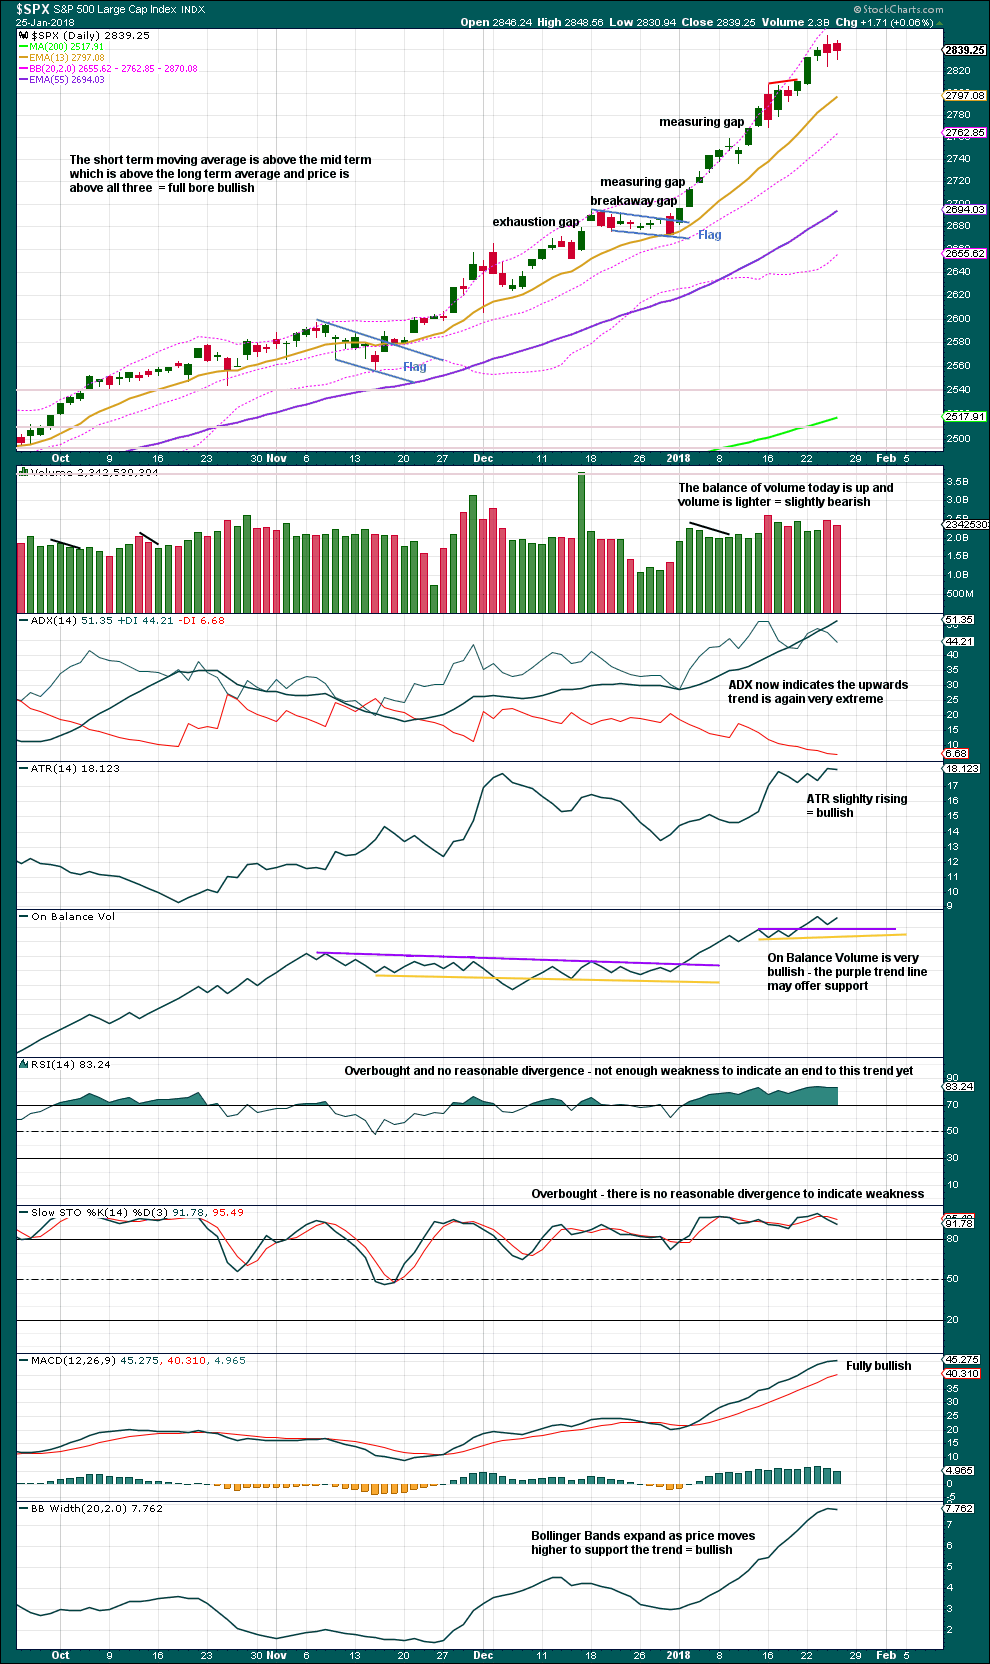
Another small inside day looks like a small pennant may be forming. This looks like a pause within the upwards trend.
There was more support from volume for downwards movement within yesterday’s session than there is for upwards movement within today’s session. The short term volume profile is slightly bearish.
VOLATILITY – INVERTED VIX CHART
Click chart to enlarge. Chart courtesy of StockCharts.com.
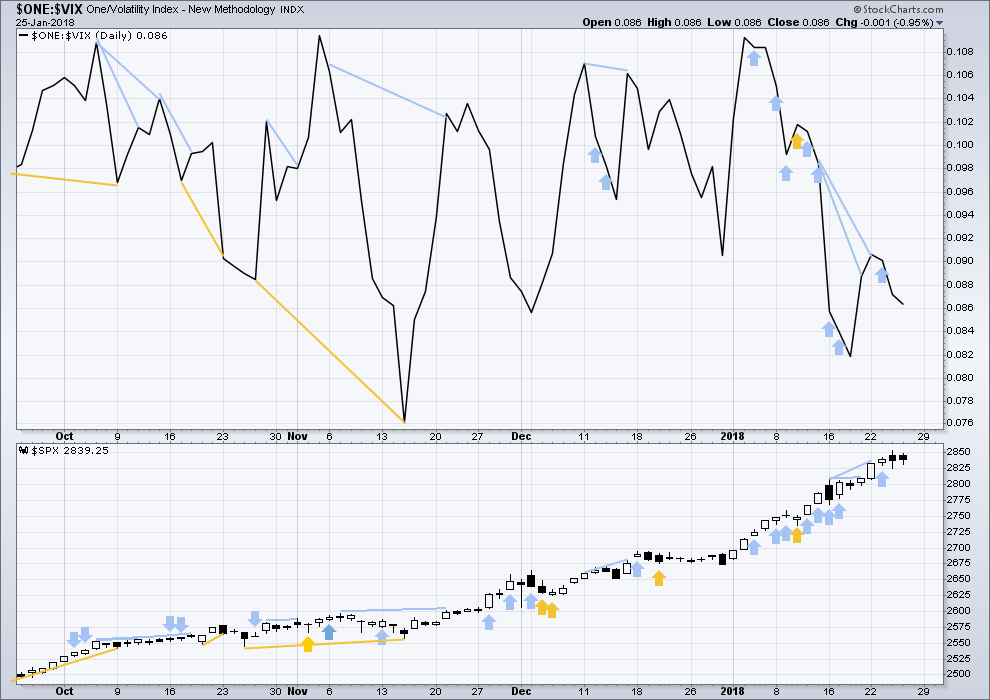
So that colour blind members are included, bearish signals will be noted with blue and bullish signals with yellow.
Normally, volatility should decline as price moves higher and increase as price moves lower. This means that normally inverted VIX should move in the same direction as price.
There is still strong short term divergence between price and inverted VIX. The new high in price has not come with a normal corresponding decline in market volatility. This is bearish.
Today’s session was an inside day with the balance of volume upwards although the candlestick closed red. Volatility shows an increase during this session, which is slightly bearish.
BREADTH – AD LINE
Click chart to enlarge. Chart courtesy of StockCharts.com.
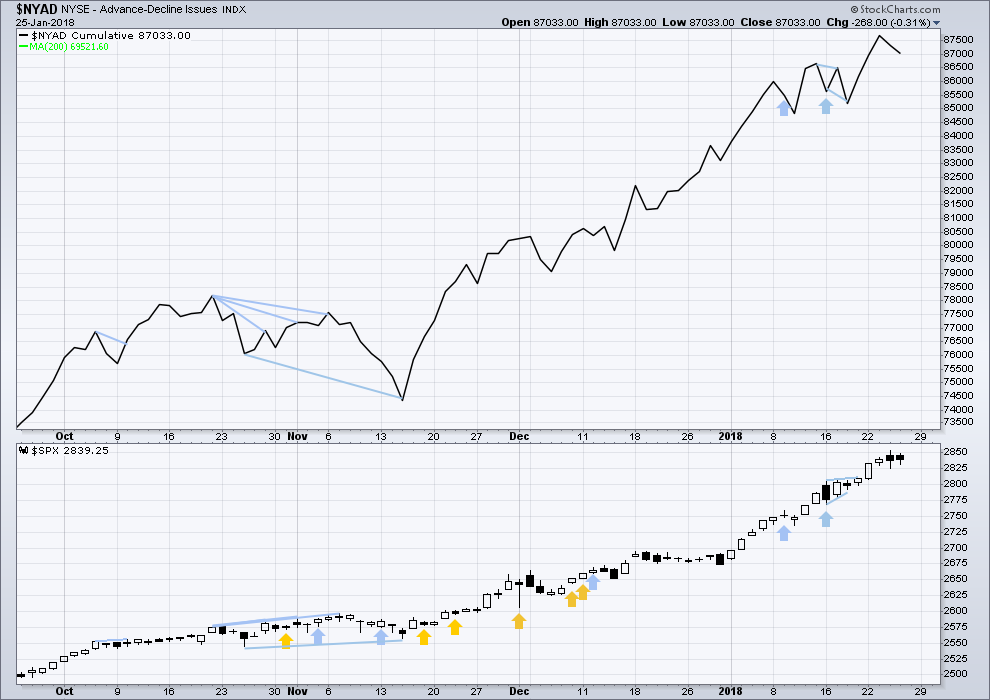
There is normally 4-6 months divergence between price and market breadth prior to a full fledged bear market. This has been so for all major bear markets within the last 90 odd years. With no longer term divergence yet at this point, any decline in price should be expected to be a pullback within an ongoing bull market and not necessarily the start of a bear market.
All of small, mid and large caps last week made new all time highs. This market has good support from rising breadth.
Breadth should be read as a leading indicator.
With breadth declining during this session, this should be read as bearish.
DOW THEORY
The S&P500, DJIA, DJT and Nasdaq last week all made new all time highs. The ongoing bull market is confirmed.
The following lows need to be exceeded for Dow Theory to confirm the end of the bull market and a change to a bear market:
DJIA: 17,883.56.
DJT: 7,029.41.
S&P500: 2,083.79.
Nasdaq: 5,034.41.
Charts showing each prior major swing low used for Dow Theory are here.
Published @ 08:58 p.m. EST.
Max 2967 before a correction
After that happens who know the market can run another 10 – 50% Run after that.
I see the market going to 2875 – 2940
I just spent a lot of time looking over the index since 1987 I found a 55% Run started in 1995 before at least a 6 – 10% pullback. The only other time it had a bigger run was right after the market bottomed on Feb – 2009.
Any thoughts
My opinion I think there’s about a 70% chance.
Please share
Thank you
The SPX is 10 points short of being up 200 for the month of January. Phenomenal!
Interestingly, VIX, UVXY and TVIX were not down anywhere near corresponding to a 200 up point move for the month or 33 points up for the day. XIV was down for the day!
It looks like the traders / market makers in Chicago are showing that they see a correction coming. I think we are getting set up for a significant correction. But the massive bullish persistence is goring anything in its way. Certainly the trend is up and strongly up. Its hard to go against that reality.
Yep! A huge cautionary flag from the stark divergence with futures vol shown by SVXY. It has declined to the level it was trading with the index last December. The stealthy exit is very notable.
Updated hourly chart:
Kevin, I’m now going to take a look at your targets. They’re quite a lot higher than mine.
I’ll play with some Fibonacci ratios and see if I can also see a cluster in that area.
I must say I have to smile at all the banter surrounding the monster red candle WYNN is printing today. Apparently Steve has been accused of some sort of sexual impropriety, ergo the precipitous decline. I have a much simpler view, namely, that ridiculous cavorting for four days above its upper B band. NFLX is next.
I suspect the story is nothing but a cynical cover for some serious insider trading. I hope the SEC looks into who was shorting the stock after that laughable “pump”. Hard to believe what they get away with these days. A lot of (foolish) folk chasing the price got fleeced today. So sad! 🙁
Maybe this.
Yes, that’s what I think it is too.
No triangle, just a zigzag.
If micro-5 now launched equals micro-1 in length (measured from bottom of completed micro-4), then I get a target of rougly 2897. I also have a 1.62% external extension of the prior (3) that’s close by at 2890. At the length of micro-3, target is 2910. So somewhere in the 2890-2910 range very likely. Wow. Enjoy market history unfolding here!! It’s a bat out of hell.
Looks like the SPX is coming along for the ride!!
XIV broke it’s downtrend line and it headed from the 140’s to 147+. 155 in a week or two wouldn’t surprise me.
Anyone have insight into gold? I see it had its first indication of possible topping in the last 24 hours. I’m intending to short it when there’s sufficient indication of possible trend change (but price is still close to the run up high, for a close invalidation/stop). I saw Lara’s public gold analysis last weekend, and it influenced me re: the potential of the short side should gold turn here.
Meanwhile Verne you’ll be happy to know I’ve taken a small UUP position here, striving to catch some of that dead cat bounce in the dollar, lol!!! We’ll see.
I’m expecting a consolidation or pullback for Gold, but the huge triangle in Gold was invalidated with a new high above 1,357
That was my very bearish wave count. So far I cannot see another bearish wave count for Gold, but I’m working on it.
Appears the bull has staggered back to it’s feet and is building up speed again! Yee-haw!! Will SPX push up to new ATH’s today, or roll back down into the consolidation zone? INDU is already up to new highs. RUT appears to be breaking out to the upside out of it’s consolidation, as is NDX. I’m watching carefully to see if SPX turns back down at it’s ATH here or starts accellerating upward.
Is this the breakout?
If SPX breaks to new all time highs, yes, by definition. The micro-5 is underway if that happens.
Thanks Kevin
Why does it feel like watching paint dry??
Okay. As 1st on the list. I declare this to be a rabbit free zone.
That’s all folks!
Where dat wabbit???
Hiya Guys! Am I late?!