
Yesterday’s main Elliott wave count expected more upwards movement.
Summary: A new all time high adds confidence to the main wave count. The next target is at 2,858, and at about that point a correction to last about two weeks is expected. The trend remains upwards.
Last monthly and weekly charts are here. Last historic analysis video is here.
The biggest picture, Grand Super Cycle analysis, is here.
MAIN ELLIOTT WAVE COUNT
WEEKLY CHART
Click chart to enlarge.
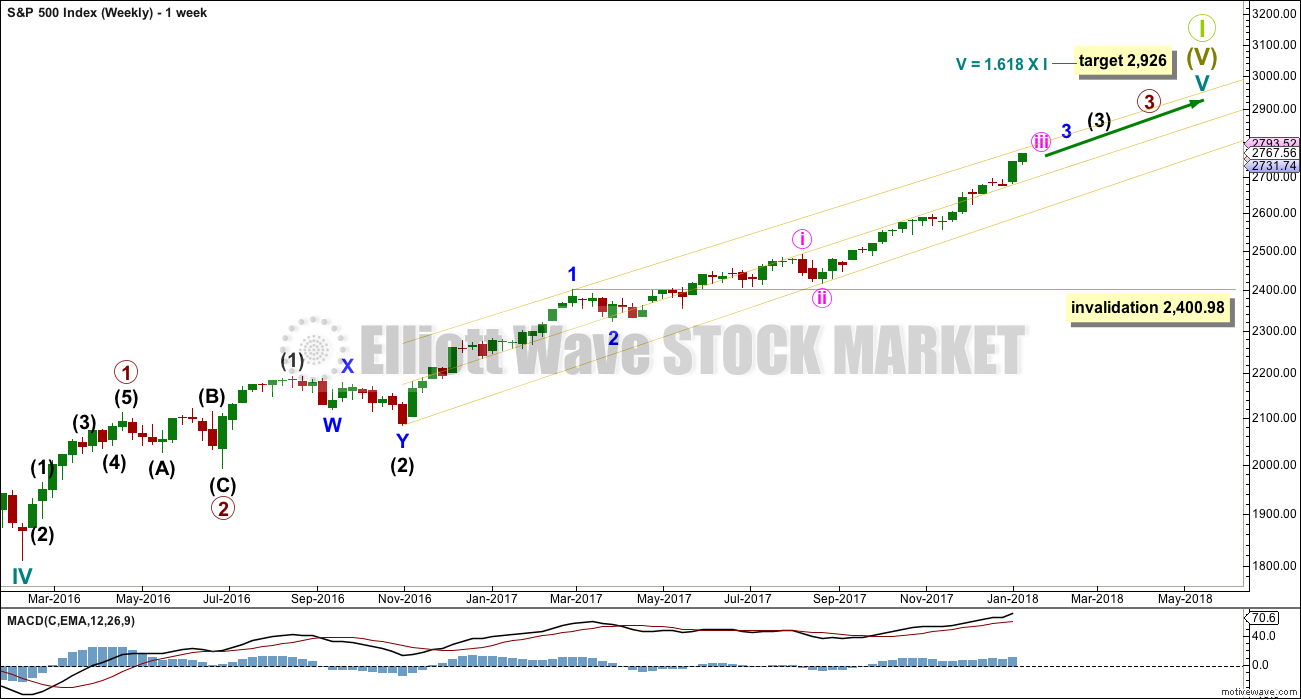
Cycle wave V must complete as a five structure, which should look clear at the weekly chart level. It may only be an impulse or ending diagonal. At this stage, it is clear it is an impulse.
Within cycle wave V, the third waves at all degrees may only subdivide as impulses.
Within cycle wave V, the corrections for primary wave 2 and intermediate wave (2) both show up clearly, both lasting several weeks. The respective corrections for intermediate wave (4) and primary wave 4 should also last several weeks, so that they show up at weekly and monthly time frames. The right proportions between second and fourth wave corrections give a wave count the right look. This wave count expects to see two large multi week corrections coming up.
Cycle wave V has passed equality in length with cycle wave I, which would be the most common Fibonacci ratio for it to have exhibited. The next most common Fibonacci ratio would be 1.618 the length of cycle wave I.
Intermediate wave (3) has passed equality in length with intermediate wave (1). It has also now passed both 1.618 and 2.618 the length of intermediate wave (1), so it may not exhibit a Fibonacci ratio to intermediate wave (1). The target calculation for intermediate wave (3) to end may have to be done at minor degree; when minor waves 3 and 4 are complete, then a target may be calculated for intermediate wave (3) to end. That cannot be done yet.
When minor wave 3 is complete, then the following multi week correction for minor wave 4 may not move into minor wave 1 price territory below 2,400.98. Minor wave 4 should last about four weeks to be in proportion to minor wave 2. It may last about a Fibonacci three, five or even eight weeks if it is a time consuming sideways correction like a triangle or combination. It may now find support about the mid line of the yellow best fit channel. If it does find support there, it may be very shallow. Next support would be about the lower edge of the channel.
A third wave up at four degrees may be completing. This should be expected to show some internal strength and extreme indicators, which is exactly what is happening.
DAILY CHART
Click chart to enlarge.
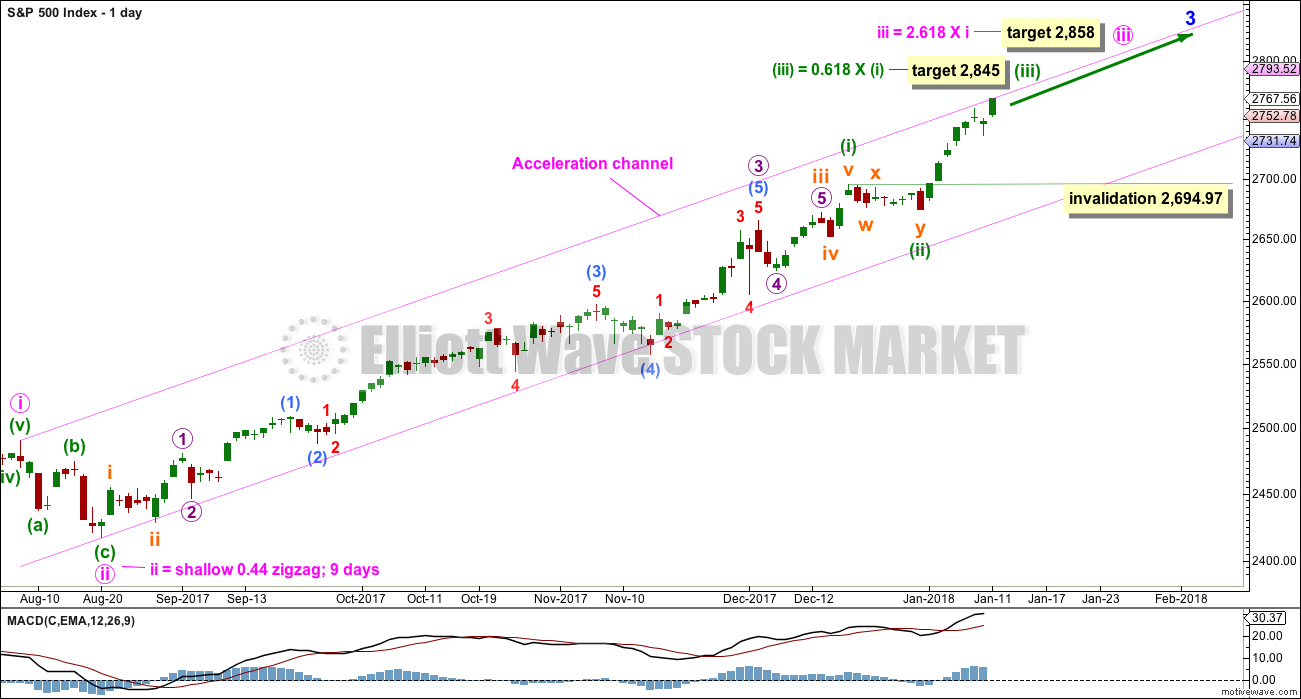
Keep redrawing the acceleration channel as price continues higher: draw the first line from the end of minute wave i to the last high, then place a parallel copy on the end of minute wave ii. When minute wave iii is complete, this would be an Elliott channel and the lower edge may provide support for minute wave iv.
Minute wave iii has passed 1.618 the length of minute wave i. The next Fibonacci ratio in the sequence is used to calculate a target for it to end.
With momentum increasing in the last two days of upwards movement, the wave count is adjusted today for most recent movement. Minute wave iii may only subdivide as an impulse, and within it minuette wave (i) only may have recently ended as a long extension.
Within the impulse of minute wave iii, the upcoming correction for minuette wave (iv) may not move back into minuette wave (i) price territory below 2,694.97.
Because minuette wave (i) with this wave count is a long extension, it is reasonable to expect minuette wave (iii) may only reach equality in length with minuette wave (i). This target fits with the higher target for minute wave iii one degree higher.
HOURLY CHART
Click chart to enlarge.
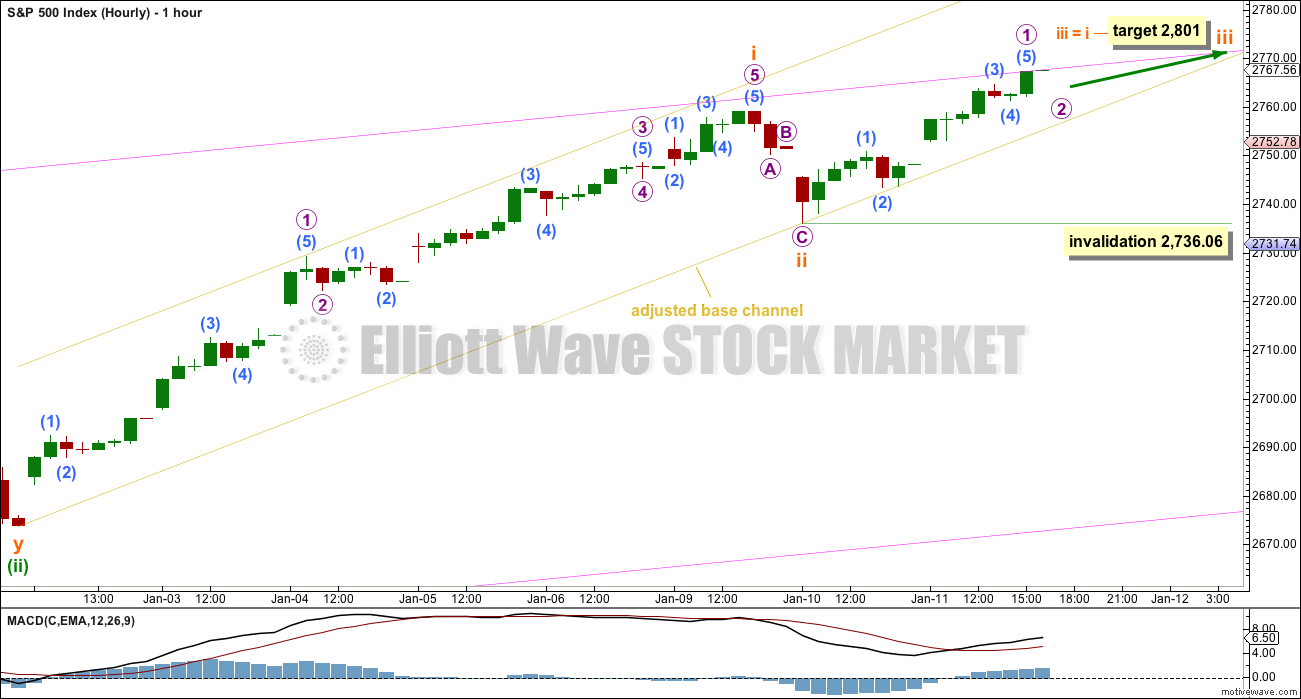
Always assume that the trend remains the same until proven otherwise. At this stage, there is no technical evidence for a trend change; we should assume the trend remains upwards.
The adjusted base channel is drawn in the same way. Look for the lower edge to provide support for corrections along the way up.
Momentum is increasing. This wave count expects that a third wave at six degrees is coming to an end (four degrees at the weekly chart level, and six at the hourly chart level now). Momentum may increase further.
Micro wave 2 may not move beyond the start of micro wave 1 below 2,736.06. However, it should find support at the lower edge of the adjusted base channel. If that channel is breached by downwards movement, then this analysis must consider the possibility that subminuette wave iii may be over.
TECHNICAL ANALYSIS
WEEKLY CHART
Click chart to enlarge. Chart courtesy of StockCharts.com.
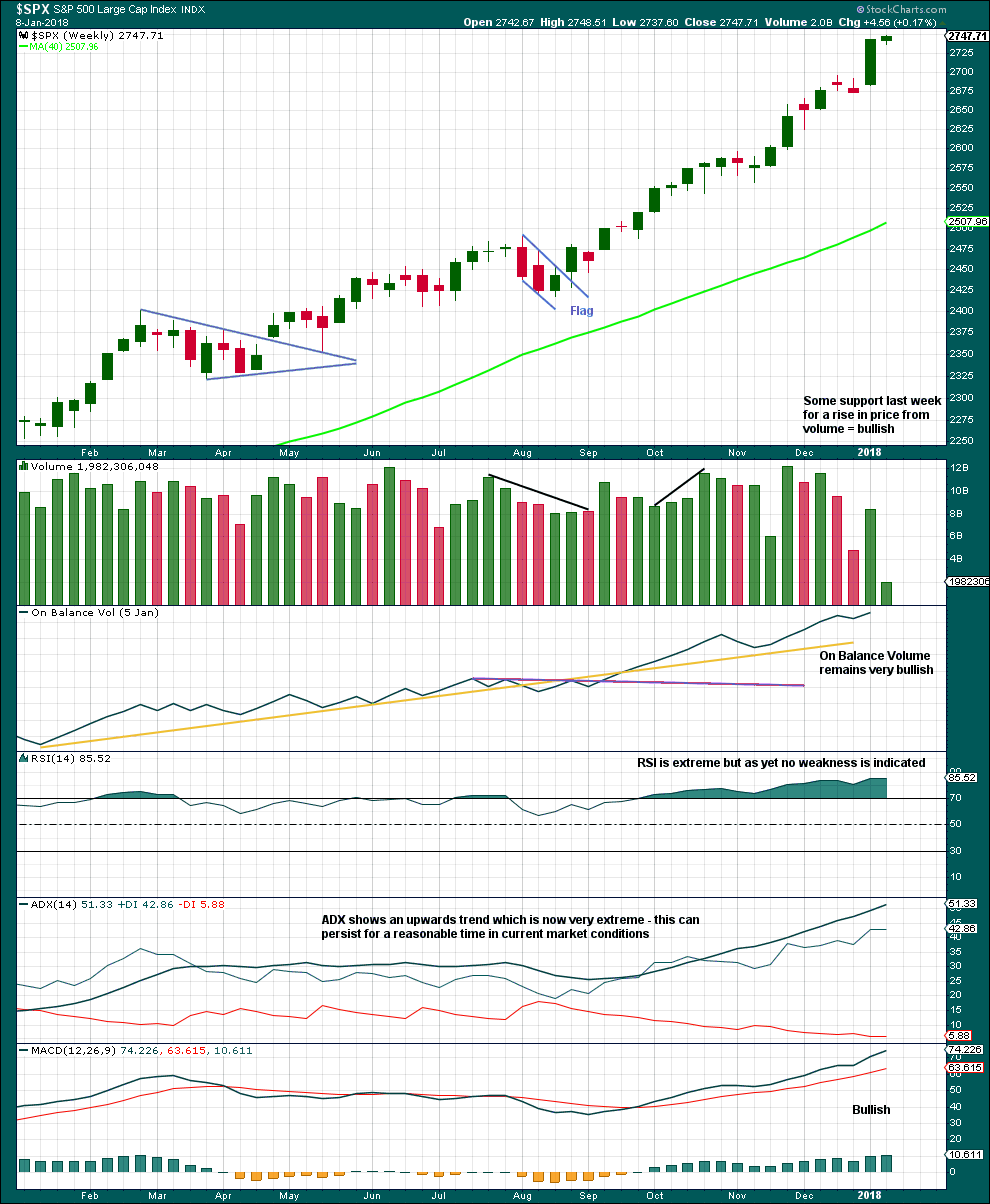
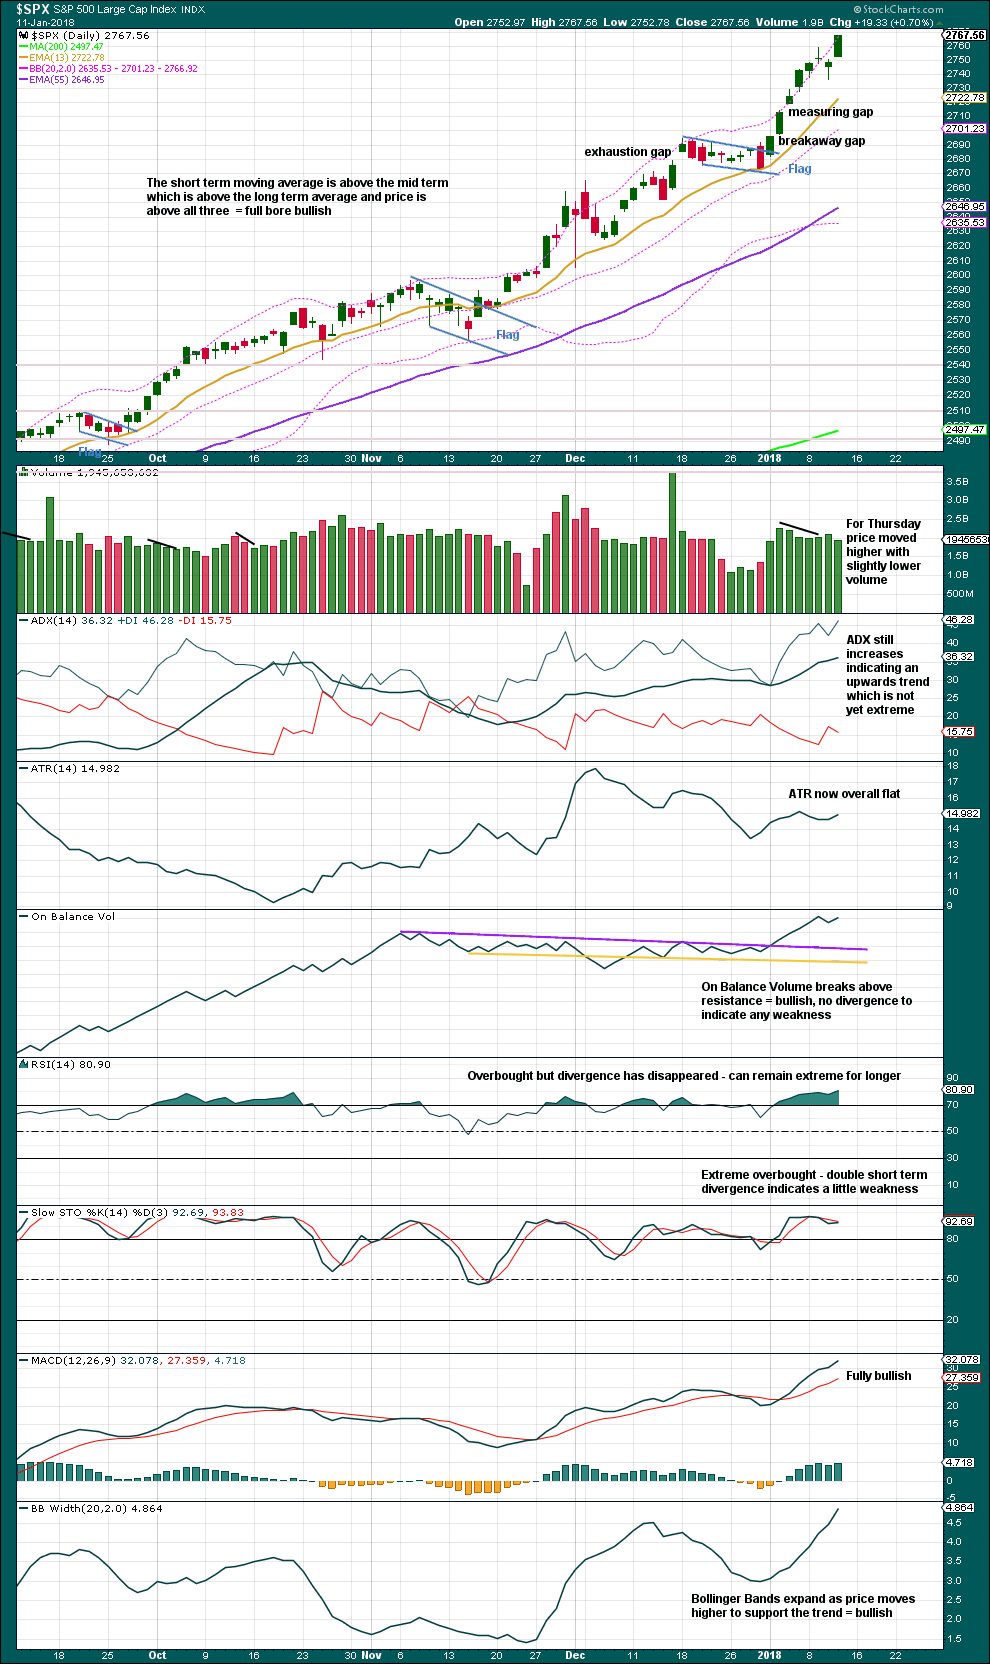
Indicators should be expected to be extreme as a third wave at four degrees comes to an end.
When third waves are ending they fairly often will show weakness at the weekly chart level. There is no evidence of weakness at this time. When intermediate wave (3) is close to or at its end, then we may expect to see some weakness.
DAILY CHART
Click chart to enlarge. Chart courtesy of StockCharts.com.
The target calculated from the measuring gap at 2,760 was met and followed by a downwards day.
There is still no evidence of enough weakness to expect a multi week correction here. Wait for RSI to exhibit some divergence while overbought, and for divergence with price and Stochastics to be stronger.
ADX and On Balance Volume remain very bullish.
VOLATILITY – INVERTED VIX CHART
Click chart to enlarge. Chart courtesy of StockCharts.com.
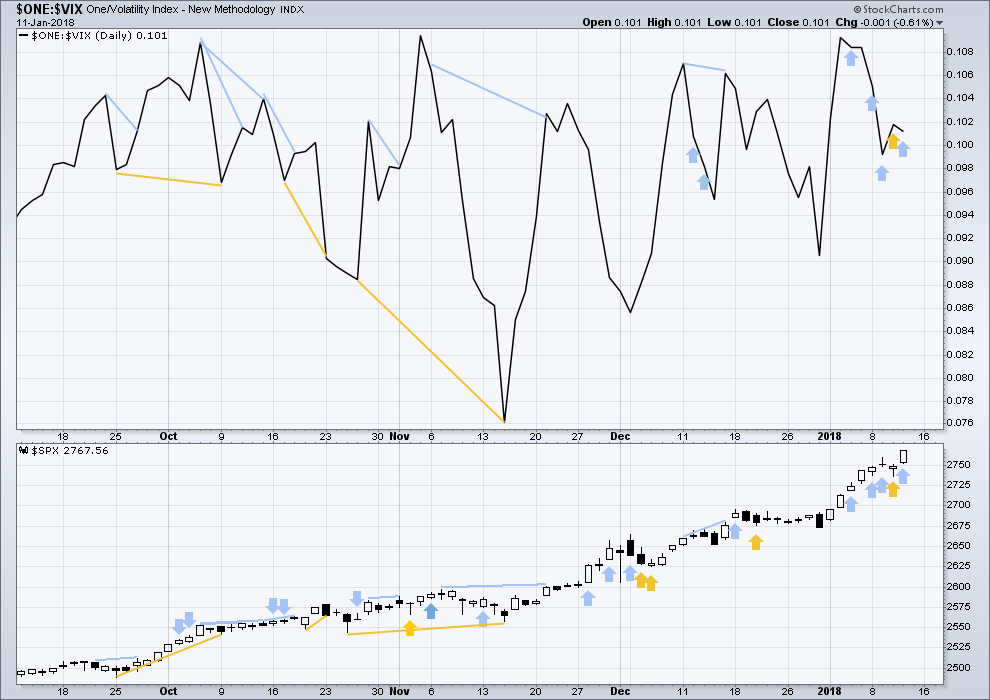
So that colour blind members are included, bearish signals will be noted with blue and bullish signals with yellow.
Normally, volatility should decline as price moves higher and increase as price moves lower. This means that normally inverted VIX should move in the same direction as price.
Bullish divergence noted yesterday has been followed by a strong upwards day. It may be resolved here.
Price moved higher today, but inverted VIX moved lower. The rise in price today did not come with a normal corresponding decline in market volatility; volatility has increased. This divergence is bearish.
However, because there is no equivalent divergence between price and the AD line today, this divergence with VIX will not be given weight in this analysis.
BREADTH – AD LINE
Click chart to enlarge. Chart courtesy of StockCharts.com.
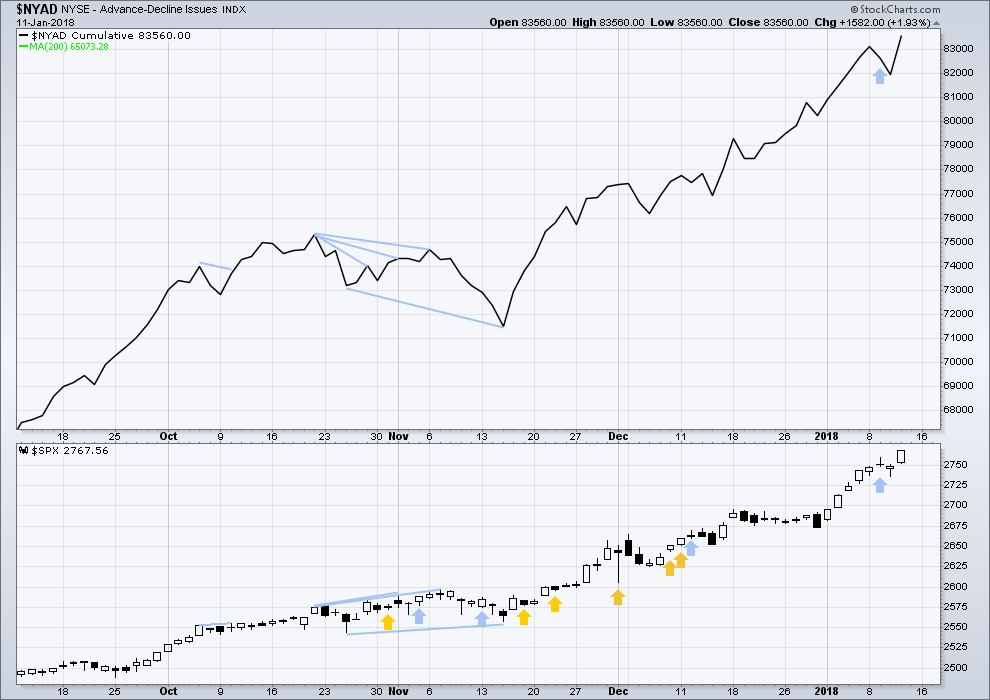
There is normally 4-6 months divergence between price and market breadth prior to a full fledged bear market. This has been so for all major bear markets within the last 90 odd years. With no longer term divergence yet at this point, any decline in price should be expected to be a pullback within an ongoing bull market and not necessarily the start of a bear market.
Only mid and large caps made new all time highs last week. There is some weakness with small caps unable to make new all time highs; this is slightly bearish.
Breadth should be read as a leading indicator.
Both price and the AD line have made new all time highs today. The rise in price has support from rising market breadth. This is bullish.
DOW THEORY
The S&P500, DJIA, DJT and Nasdaq last week all made new all time highs. The ongoing bull market is confirmed.
The following lows need to be exceeded for Dow Theory to confirm the end of the bull market and a change to a bear market:
DJIA: 17,883.56.
DJT: 7,029.41.
S&P500: 2,083.79.
Nasdaq: 5,034.41.
Charts showing each prior major swing low used for Dow Theory are here.
Published @ 07:27 p.m. EST.
More interesting volatility musings for those interested…..
https://www.zerohedge.com/news/2018-01-11/has-only-happened-twice-history-goldman-asks-should-we-worry
it’s going to be a supernova of amazing….actually just sold a number of puts on UVXY for the hell of it. VIX calls up nicely today as well.
A really good read, Verne, thank you for passing it on. Yikes… what a bubble!
Most welcome guys!
One of the best I have read. I just keep shaking my head in amazement. I saw a pretty sharp quant guy awhile back who gave the VIX fifteen pivot as an event horizon and was pretty stunned to see they now think as low as thirteen could precipitate an unravel. We last broke the 13 barrier as recently as Dec 01 so this implies things have become even more insanely skewed since then….
The stealthy rise of VIX continues… 🙂
Can you believe the Jan 24 SPY 279 strike calls I picked up yesterday (thanks to Lara!) for 0.50 actually DOUBLED overnight???!!
The velocity of today’s SPX move up indicates to me that action is still in a “3” on this 5 wave push up that started Jan 10. That’s a little different than what is called out in hourly. Similarly and related, while the target for minuette 3 (on the daily chart) at 2834, where iii = 0.618*i, is reasonable, it’s also quite conservative and given the incredible strength of the action here, I think a more likely target at this point is iii = i, which puts the target up quite a bit higher (sorry no time to calc it at the moment).
The momentum of this market is pretty staggering.
Sorry, typo, that minuette target is at 2845 on the daily where (iii) = .618 * (i). I’m suspicious that this hot market needs more room to execute, and the not quite so conservative target of (iii) = (i) is in play. That target is roughly 2950 (!!!).
I don’t trust any “top” targets on this move. There’s no reliable way to tell when the top is in.
Kevin,
Just a thought that given JPM’s earnings and economic readings, perhaps a massive short squeeze is under way. I suspect it will get more furious as earnings start to come in above expectations for majority of blue chip stocks.
Extraordinary isn’t it. Daily scalps is all I’m doing lately, although XLU is looking bottomy here.
Yes, eyes on XLU, it’s just touched a 50% fibo, but I’d like to see it hit the 62% and turn and flash buy triggers…as for JPM and short squeeze, “I dunno”. I’m not so knowledgeable about short squeezes vs. just getting aggressively bought. I wouldn’t think there’d be a pile of short interest on a JPM, given the combo of dereg of finance and the tax cuts and the strong market, but again I don’t really have any data on it, and some people are just short happy regardless, so there’s probably always at least some element of short covering.
No short interest left in the market; JPM is at .80%. Short squeeze not mathematically possible there.
Looks like a triangle type 4 is in play now. Or I could be wrong and the minuette 1 (circle around that 1) is over here. But I think there’s a subminuette (5) still to go here, myself.
RR_001,
While Lara does not apply fundamental analysis directly to her SPX wave analysis and forecasting, she does apply it to the very long term expectations. The fact that she believes we will be completing Super Cycle 1 has huge implications for fundamentals. She has often mentioned some of these. Lara has also mentioned how debt will play a part in the collapse. And more.
I think your question is similar to mine, “Is the 2926 SPX target too low?” We are currently at 2777 which is only 149 points away from the SC1 target of 2926. Of course I cannot speak for Lara, but I think it may be too low relative to the current count. We shall see.
Thanks for the question.
Rodney,
Correct and as I see DOW projections of 30,000 and NASDAQ perhaps higher as well, I am wondering what will be the next project EW target for S&P.
Closet will be to see how internet mania pushed the S&P to levels that no one thought can be achieved..only this time crypto is many times over the internet bubble so more pronounced ..
Look at futures; big fast role then getting pumped again, and again, and again. The manipulation will be exposed and written about for years to come once this finally breaks. Also, somebody might want to pay attention to the CDS markets; giving the same signs in nearly identical patterns to 2007.
Lara,
I known you have indicated 2,926 as the top of the current cycle run but curious that given the tax reform and indications that a lot of corporations will put the cash reserves to prop their stock i.e. buybacks, do you think that 2,926 might get taken out in favor of higher level given the influx of new money that now supports the market indirectly?
buybacks are a waste of cash and capital. Tax benefits and cash will go into Investments into plant and equipment to actually grow their production revenue and business in the USA. This is the way businesses use to grow. The lack of this investment the last 10 -15 years created the sub 2.00% GDP world.
Once these investments have been made… The 3, 3.5, 4%+ GDP will return to the USA.
What is the “old Man’s” current take? 🙂
No new reports.
I don’t believe Lara uses an iota of fundamental analysis in her work, which I am very happy with. Re: fundamental analysis, all I’ll say is “no one knows”, as well as “everyone has an opinion”, and they all almost always different. The wave counts…it’s right there, and largely unarguable.
Sorry I raised the question, I will now go and sit quitely outside the room 🙁
I didn’t mean to be offensive, apologies if I was. It’s a fine question! And there are higher wave count targets that are computable; Lara usually starts with the more conservative, with the logic that “if the structure is incomplete” when that target is achieved, then the next is in play.
14 straight days of gains for the Hang Seng. Up 12% in 4 weeks. What a show!
Can it be real? I am first without even trying? Sure enough is!
Rodney,
If it helps, I was trying to be the first but you beat me to the finishing line. I guess we are missing the regular wabbit here..