
Upwards movement continued for another day towards targets as expected. Today, the AD line and VIX are giving signals.
Summary: The target for a short term interruption to the trend calculated using classic technical analysis methods, at 2,755 to 2,760, has now been met today.
The AD line today gives a bearish signal, and there are now three bearish signals from VIX. This supports the third hourly Elliott wave count, which expects a correction here to last about one to two weeks. However, the channel on the hourly chart needs to be breached by downwards movement before reasonable confidence may be had in this view.
The target is still at 2,858 while price remains within the channel. Assume the trend remains the same until proven otherwise.
Last monthly and weekly charts are here. Last historic analysis video is here.
The biggest picture, Grand Super Cycle analysis, is here.
MAIN ELLIOTT WAVE COUNT
WEEKLY CHART
Click chart to enlarge.
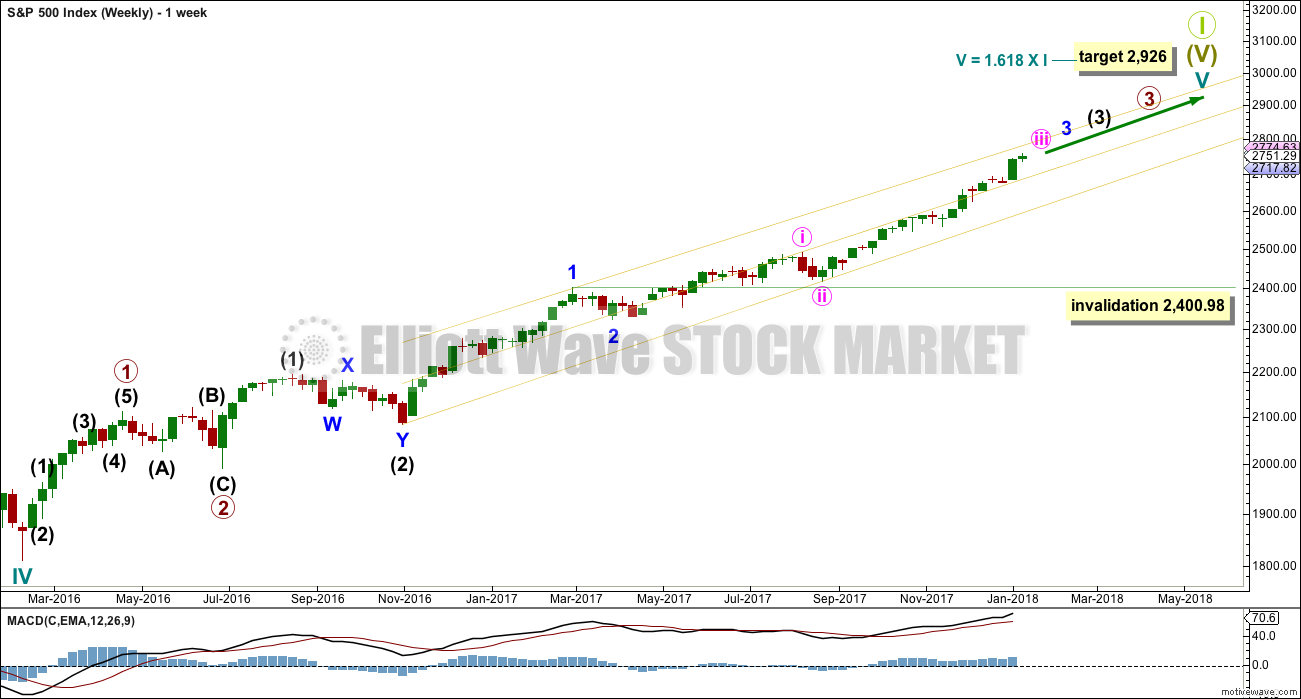
Cycle wave V must complete as a five structure, which should look clear at the weekly chart level. It may only be an impulse or ending diagonal. At this stage, it is clear it is an impulse.
Within cycle wave V, the third waves at all degrees may only subdivide as impulses.
Within cycle wave V, the corrections for primary wave 2 and intermediate wave (2) both show up clearly, both lasting several weeks. The respective corrections for intermediate wave (4) and primary wave 4 should also last several weeks, so that they show up at weekly and monthly time frames. The right proportions between second and fourth wave corrections give a wave count the right look. This wave count expects to see two large multi week corrections coming up.
Cycle wave V has passed equality in length with cycle wave I, which would be the most common Fibonacci ratio for it to have exhibited. The next most common Fibonacci ratio would be 1.618 the length of cycle wave I.
Intermediate wave (3) has passed equality in length with intermediate wave (1). It has also now passed both 1.618 and 2.618 the length of intermediate wave (1), so it may not exhibit a Fibonacci ratio to intermediate wave (1). The target calculation for intermediate wave (3) to end may have to be done at minor degree; when minor waves 3 and 4 are complete, then a target may be calculated for intermediate wave (3) to end. That cannot be done yet.
When minor wave 3 is complete, then the following multi week correction for minor wave 4 may not move into minor wave 1 price territory below 2,400.98. Minor wave 4 should last about four weeks to be in proportion to minor wave 2. It may last about a Fibonacci three, five or even eight weeks if it is a time consuming sideways correction like a triangle or combination. It may now find support about the mid line of the yellow best fit channel. If it does find support there, it may be very shallow. Next support would be about the lower edge of the channel.
A third wave up at four degrees may be completing. This should be expected to show some internal strength and extreme indicators, which is exactly what is happening.
DAILY CHART
Click chart to enlarge.
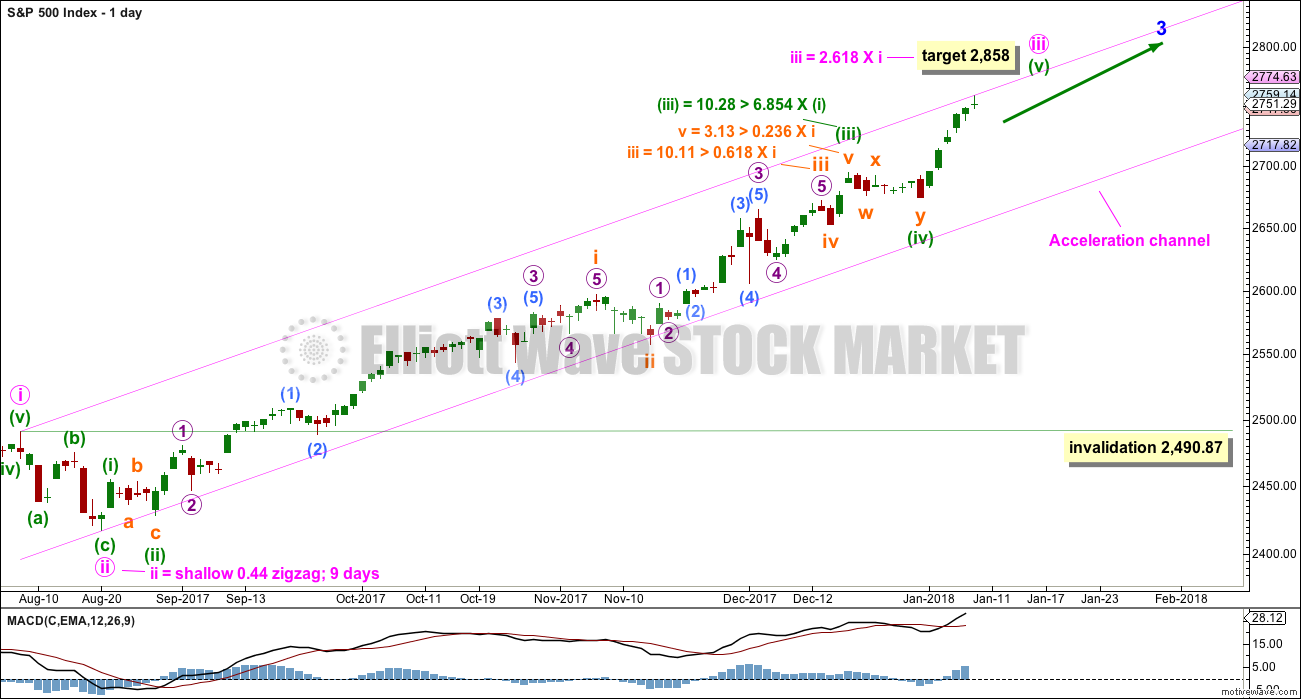
Keep redrawing the acceleration channel as price continues higher: draw the first line from the end of minute wave i to the last high, then place a parallel copy on the end of minute wave ii. When minute wave iii is complete, this would be an Elliott channel and the lower edge may provide support for minute wave iv.
Minute wave iii has passed 1.618 the length of minute wave i. The next Fibonacci ratio in the sequence is used to calculate a target for it to end.
Minute wave iv may not move into minute wave i price territory below 2,490.87. However, minute wave iv should most likely remain within the channel and not get close to the invalidation point. It may end within the price territory of the fourth wave of one lesser degree, that of minuette wave (iv) from 2,694.97 to 2,673.61.
HOURLY CHARTS
Three hourly charts are presented below. The first two charts look at the possibility that minute wave iii is not yet over, and the third will consider the possibility that it could be over at today’s high.
FIRST HOURLY CHART
Click chart to enlarge.
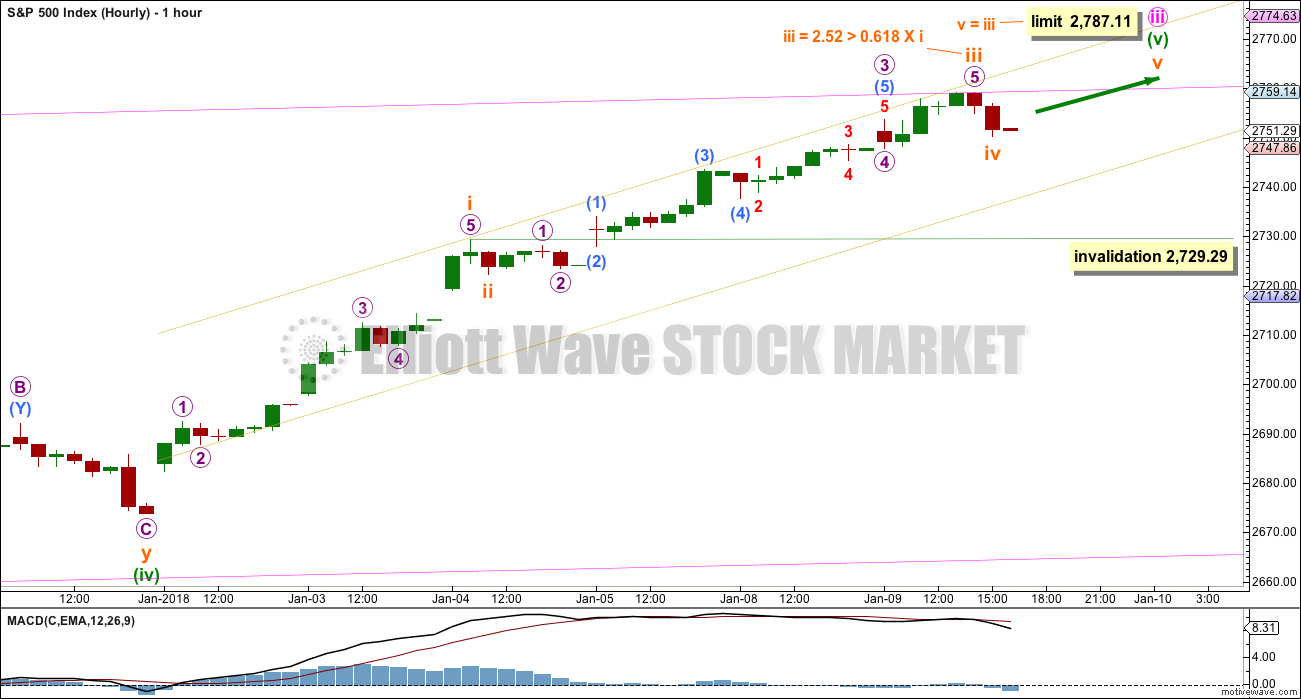
This first hourly chart follows on from yesterday’s analysis.
Minuette wave (v) to end minute wave iii may be incomplete. It may be subdividing as an impulse.
Within the impulse, subminuette waves i, ii and now iii may be complete. Subminuette wave iv may not move into subminuette wave i price territory below 2,729.29.
Subminuette wave iii, if it is over at today’s high, would be shorter than subminuette wave i. This would limit subminuette wave v to no longer than equality in length with subminuette wave iii, so that subminuette wave iii is not the shortest actionary wave within the impulse.
SECOND HOURLY CHART
Click chart to enlarge.
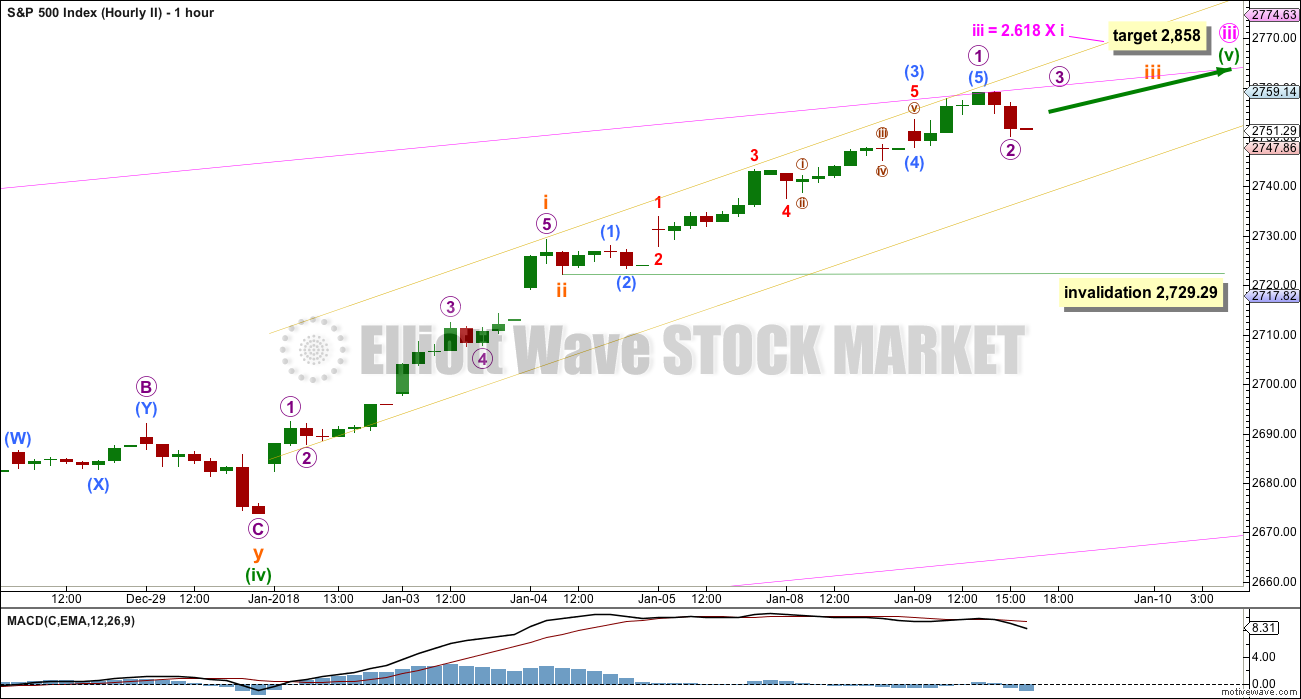
This second hourly chart moves the degree of labelling from the low of subminuette wave ii all down one degree.
It is possible that subminuette wave iii is not over yet. The target at 2,858 may then be met.
Subminuette wave iii may only subdivide as an impulse. Within subminuette wave iii, only micro wave 1 may be over at today’s high. Micro wave 2 may not move beyond the start of micro wave 1 below 2,729.29.
However, this wave count would be discarded if price breaks below the lower edge of the yellow channel, because it would no longer have the right look. Micro wave 2 should be relatively brief and shallow.
THIRD HOURLY CHART
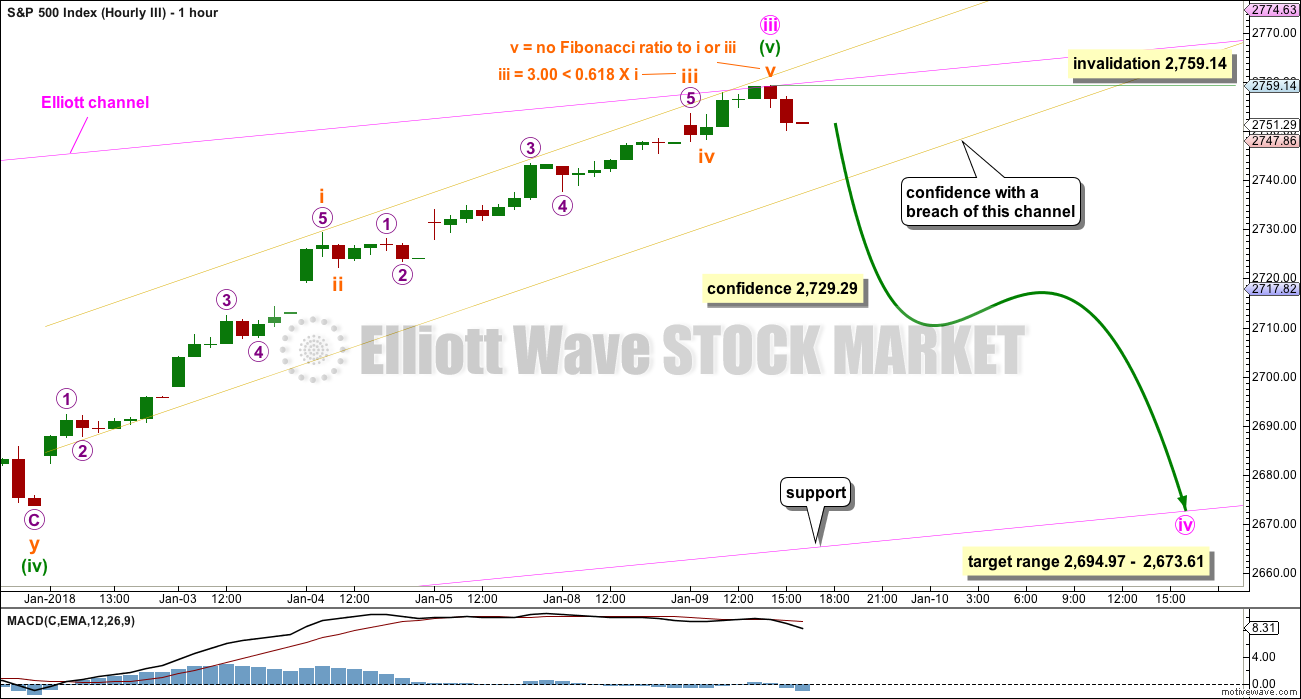
Click chart to enlarge.
Always assume the trend remains the same until proven otherwise. In this case, proven otherwise would be a breach of the yellow channel. While price remains within that channel, this is a third wave count in which we should not put too much confidence.
However, the bearish signal today from the AD line along with three bearish signals now from VIX do offer some support for this wave count.
If the channel is breached by downwards (not sideways) movement, then expect that minute wave iii is over and minute wave iv has arrived. At that stage, expect a multi week consolidation or pullback.
Minute wave ii lasted 9 days and was a shallow zigzag. Given the guideline of alternation, expect minute wave iv to be more shallow and to be a sideways flat, combination or triangle. It may find support about the lower edge of the Elliott channel (which is exactly the same as the acceleration channel on the daily chart).
TECHNICAL ANALYSIS
WEEKLY CHART
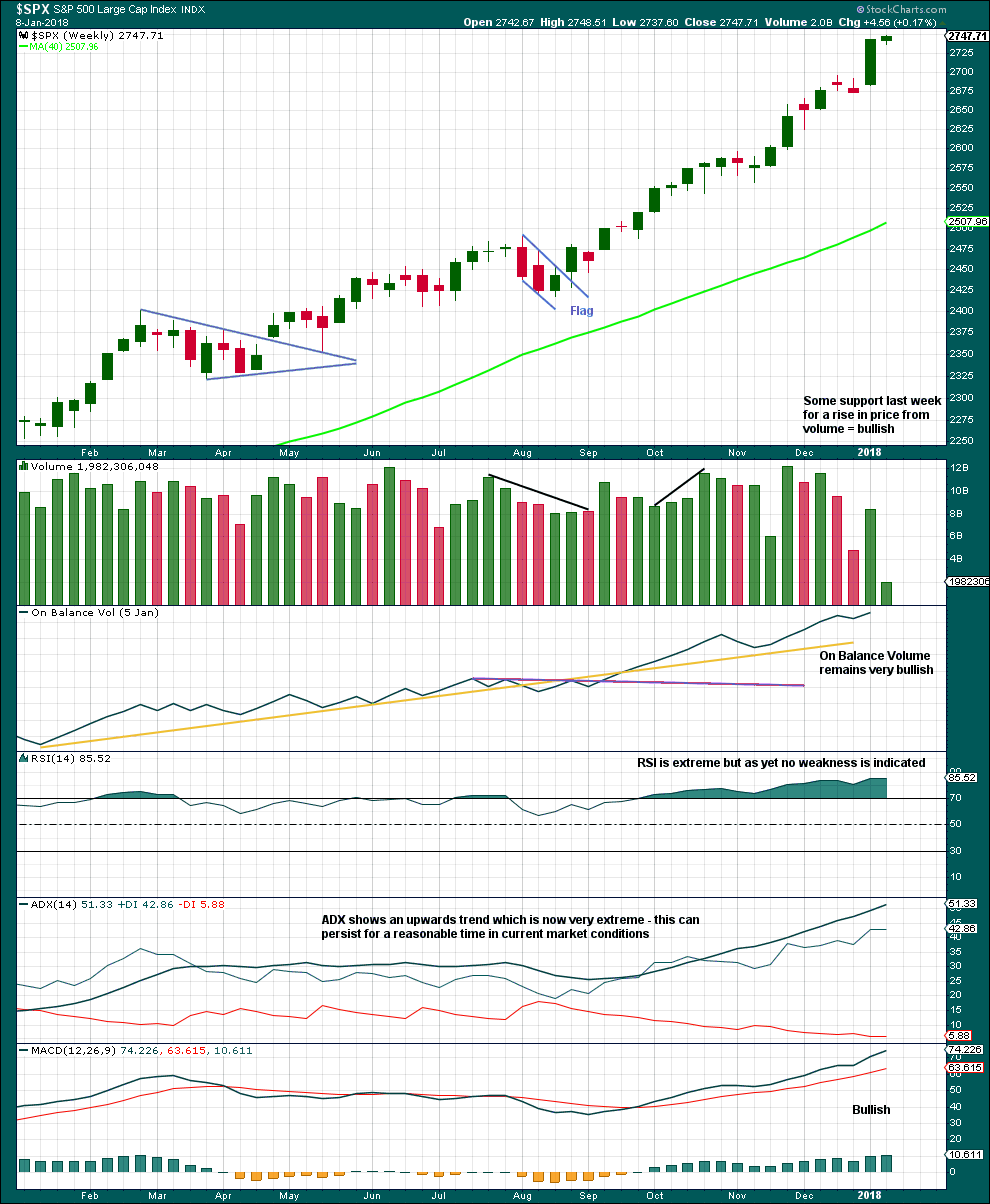
Click chart to enlarge. Chart courtesy of StockCharts.com.
Indicators should be expected to be extreme as a third wave at four degrees comes to an end.
When third waves are ending they fairly often will show weakness at the weekly chart level. There is no evidence of weakness at this time. When intermediate wave (3) is close to or at its end, then we may expect to see some weakness.
DAILY CHART
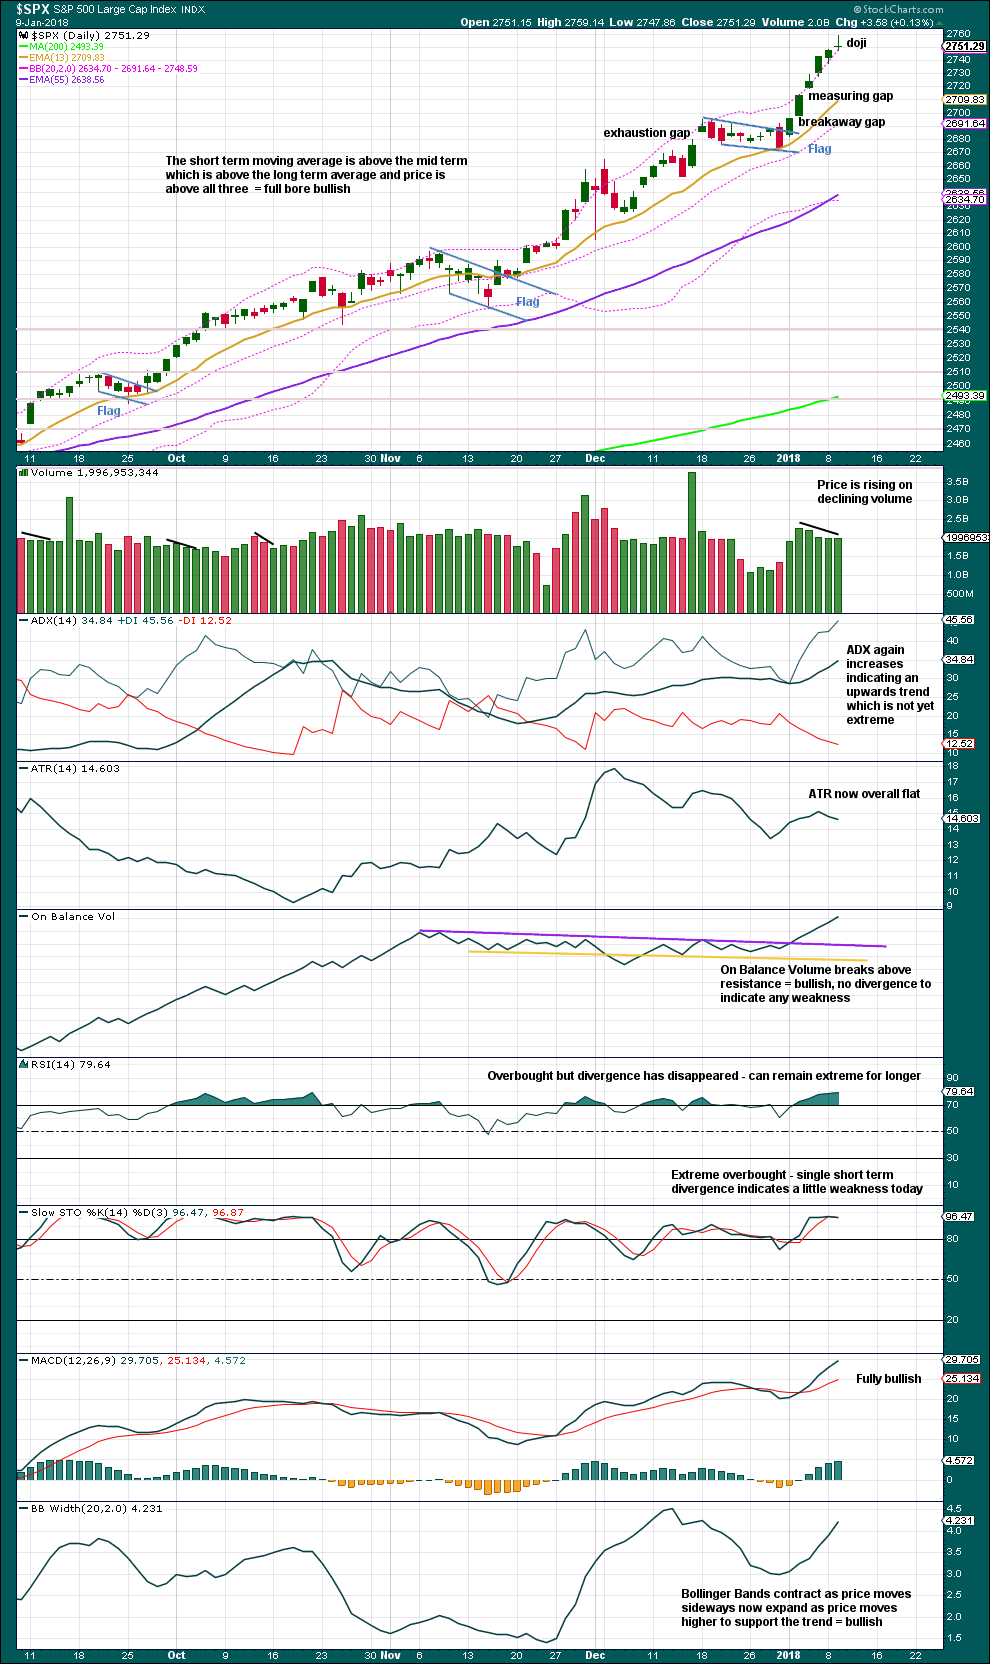
Click chart to enlarge. Chart courtesy of StockCharts.com.
The flag gives a target at 2,755. The measuring gap gives a target at 2,760. The high today at 2,759.14 perfectly meets this small 5 point target zone.
The doji on its own is not a reversal signal. It represents only a pause, a balance of bulls and bears. However, an Evening Doji Star would be a reasonable reversal signal if tomorrow completes a red candlestick which moves price lower.
Only Stochastics today shows weakness and it is only single day divergence. This is not enough to call for an end yet to the trend.
It seems reasonable to conclude from this chart that a multi day to multi week (only a very few) consolidation or pullback may have arrived if price moves down tomorrow. At its end, it should be used as an opportunity to join the longer term upwards trend.
VOLATILITY – INVERTED VIX CHART
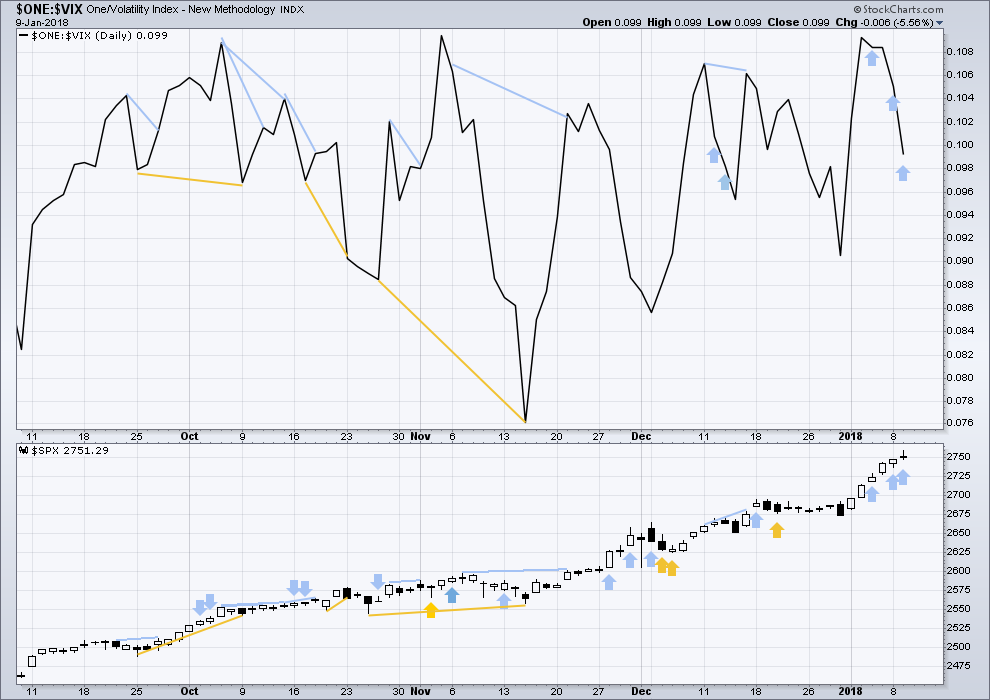
Click chart to enlarge. Chart courtesy of StockCharts.com.
So that colour blind members are included, bearish signals will be noted with blue and bullish signals with yellow.
Normally, volatility should decline as price moves higher and increase as price moves lower. This means that normally inverted VIX should move in the same direction as price.
There are now three very recent instances of bearish divergence between price and VIX: on both the 4th and 8th of January and now also today price moved higher but inverted VIX moved lower. The rise in price on these days did not come with a normal corresponding decline in market volatility. Volatility has increased.
It indicates traders should be cautious, that a small correction may be coming sooner rather than later.
BREADTH – AD LINE
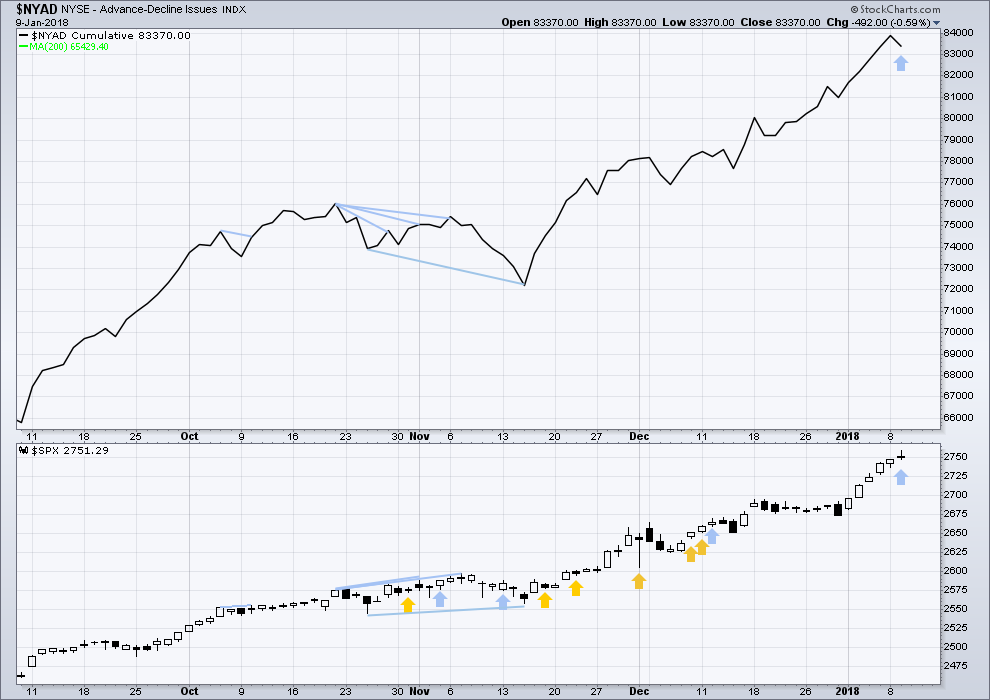
Click chart to enlarge. Chart courtesy of StockCharts.com.
There is normally 4-6 months divergence between price and market breadth prior to a full fledged bear market. This has been so for all major bear markets within the last 90 odd years. With no longer term divergence yet at this point, any decline in price should be expected to be a pullback within an ongoing bull market and not necessarily the start of a bear market.
Only mid and large caps made new all time highs last week. There is some weakness with small caps unable to make new all time highs; this is slightly bearish.
Breadth should be read as a leading indicator. Price moved higher today, but the AD line moved lower. The rise in price today did not have support from rising market breadth. This divergence is bearish.
DOW THEORY
The S&P500, DJIA, DJT and Nasdaq last week all made new all time highs. The ongoing bull market is confirmed.
The following lows need to be exceeded for Dow Theory to confirm the end of the bull market and a change to a bear market:
DJIA: 17,883.56.
DJT: 7,029.41.
S&P500: 2,083.79.
Nasdaq: 5,034.41.
Charts showing each prior major swing low used for Dow Theory are here.
Published @ 08:54 p.m. EST.
Updated hourly III chart:
If this is the start of a one to two week pullback or consolidation, then only minuette (a) may be completing.
I’ve been thinking about how to approach trading advice during these pullbacks. And I notice that my expectations of their duration have been too long recently. And so for the short term a zigzag down may be completing. When the next wave down which may be subminuette c is complete, then if a long position is entered there it may be a good entry point. Moving stops to breakeven fairly quickly may eliminate risk. Then wait to see if the position sticks.
If my degree of labelling is one too low then a zigzag down may be about to complete.
If my degree of labelling is correct then a bounce should follow the three down and so long positions may become profitable fairly quickly, allowing for stops to eliminate risk quickly.
The risk will remain though that my analysis for the short term is wrong and this is not a three down but a five down, in which case traders would have a loss fairly quickly. Accept this risk and manage it by not investing any more than 5% of equity.
Thanks Lara; waves pumping here in FL the past few weeks! Hope you had a nice break.
Awesome Chris! I had the best break ever. Not too much surf, but we do have some little waves this week.
Great to hear you’re getting some good waves 🙂 🙂 🙂 Makes you feel so much better doesn’t it!
At the hourly level, I see just an “a” down and “b” up so far. The “a” at the 5 minute level seems to have a 5 wave structure, and the “b” up is extremely overlapped, i.e., properly corrective. I would hazard a guess that a “c” down should arrive soon, probably before the morning’s gap gets completely filled (it’s over 1/2 filled now).
A different view is seeing, at the 5 minute level, an “a-b-c” down from yesterday’s high to this morning’s low, and everything so far up from there as the “1” of a new impulse. However…the 1 up is a mess of overlapped action at the 5 minute level. One way or another, I’d expect another leg down before this market gets back to new highs, as either a C of an overall ABC down, or as the 2 of a new impulse up. The former probably undercuts this morning’s low, while the latter by definition would not. Right now, I’m struck by the growing momentum of this move up. “Fascinating” said Mr. Spock…(with cocked eyebrow of course!). And yet, relative to what’s been happening over and over in the last year, not in any way surprising.
Agree. This upward chop the last couple hours looks corrective at the moment.
I think today’s low is wave (a) of some larger degree A wave. Then we will have a B up and C down to the targets under 2700 to complete a 4th wave. This is essentially what the Hourly Alternate III is showing. Lara is right on.
Perhaps. I’m doubtful however, unless there is “news”. I don’t see this current move down busting below this morning’s low, but I’m pretty much on the sidelines now waiting for a low risk/high reward set up to push my money in on, but long side only. Trading short in a massive bull market may work for some super-traders; I ain’t one of ’em! I like the easy path to profits.
I have no more patience for this market.
I am thinking of cashing out completely (today or tomorrow) and going to the sidelines… until I have more clarity.
Take my lumps and regroup!
Apparently Only 2 hour pull backs allowed as Chris said earlier.
It is so messed up I no longer know what to do. The Dumbifacation of almost 40 years of what I understand… that is what these people/markets have done to me.
That’s it… OUT! Taking a break from all this.
One thing I do get… I have a stink bid on AG. I get it great, if not oh well!
Sven over at Northman Trader recently penned an article in which he listed the number of hedge fund managers who have walked away from this market in complete disgust. None of them what I would consider lightweights. What the banksters have done to the markets is truly mind boggling.
I hope you don’t leave the forum. But if that is required for you to take a full break, I wish you best of luck Joe and await your future return.
My 18 year old son last night announced he had to get up early to do his dog walking job, because he had an “interview” at 11am. “Interview for what?” asks I. “The Marine Corp” he replies.
Whoa.
His grandfather on my side was part of the 182nd airborne, invasion of the Phillipines 1944, partcipated in the weeklong battle for Nichols field, parachuted into the raid to free the Los Banos civilian prison camp (a raid now taught at the war college), and was on the first truck to hit land at Yokohama in the occupation. Crazy stuff. His aunt’s husband’s father was 1st Marines through all of WWII, rather serious business.
I’m proud of him for even considering it (one could say he “has it made” and has no external reasons for going military), and feeling more than a little trepidation too. But he’s gotta follow his own path! It just might be an “interesting” day.
Good for him. May his interview and decision making go well.
Getting a second chance here.
The big fibo’s on the Jan 2 low to recent highs start at 2739.2 (23.6%), then 2726.8 (38%), then lower from there.
Looking at fibo’s of the Jan 5 low to recent highs, there a 38% at 2744.9, 50% at 2740.6, and 62% at 2726.8.
That puts a little “cluster” of two in the 2740-42 zone and it’s not hard to find symmetric projections into the same area. For example, the Dec 18 high to Jan 2 low projects to about 2738.
Best of luck in this 4 ladies and gentlemen. “Start your engines!!!”…..
Bounce exactly off the 2736.4 fibo (which I typo’d above as 2726.4, sorry!!!). Perhaps that’s going to be it and price triangles or flats out from here.
Yeah, apparently only 2hr pull backs allowed
I think all the gaps were just closed.
Knowing that makes it easy. I doubled down my XIV position and my UPRO position. The bull just went over to get a quick drink before returning to the street to run over some more bears!!!
2737 so far this morning, hopefully take out 2729 before the US opening and we should have a nice gap down
Don’t forget the new money that is coming into the retirement and 401k accounts . This money will be put to use sooner than you think or expect.
First!! Happy Trading 🙂