
A small correction was expected to continue. With price moving slightly lower and closing as a small doji candlestick for Friday’s session, this is what is happening.
Summary: A small fourth wave correction may continue for a few more days overall, and may complete as a small triangle, or as a sideways choppy combination. At this stage, it looks like it may be very shallow.
When it is done, then the upwards trend should resume. The next target for the next interruption is about 2,835.
Last monthly and weekly charts are here. Last historic analysis video is here.
The biggest picture, Grand Super Cycle analysis, is here.
MAIN ELLIOTT WAVE COUNT
WEEKLY CHART
Click chart to enlarge.
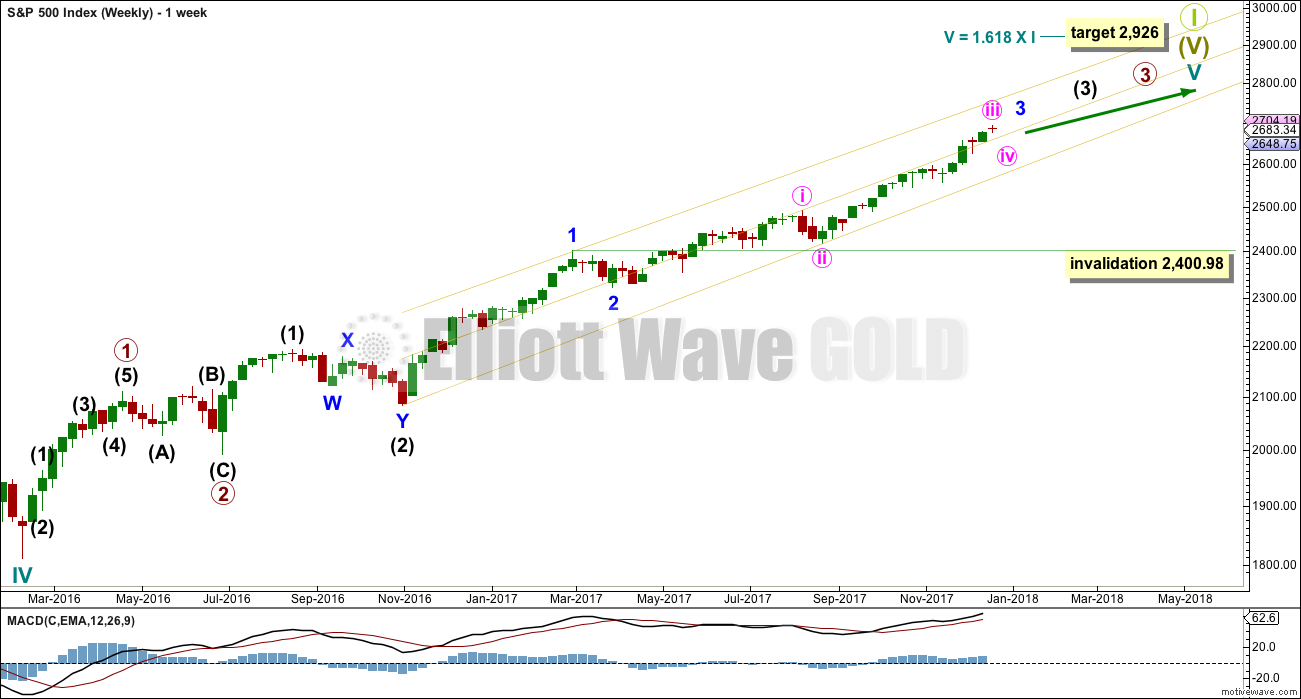
Cycle wave V must complete as a five structure, which should look clear at the weekly chart level. It may only be an impulse or ending diagonal. At this stage, it is clear it is an impulse.
Within cycle wave V, the third waves at all degrees may only subdivide as impulses.
Within cycle wave V, the corrections for primary wave 2 and intermediate wave (2) both show up clearly, both lasting several weeks. The respective corrections for intermediate wave (4) and primary wave 4 should also last several weeks, so that they show up at weekly and monthly time frames. The right proportions between second and fourth wave corrections give a wave count the right look. This wave count expects to see two large multi week corrections coming up.
Cycle wave V has passed equality in length with cycle wave I, which would be the most common Fibonacci ratio for it to have exhibited. The next most common Fibonacci ratio would be 1.618 the length of cycle wave I.
Intermediate wave (3) has passed equality in length with intermediate wave (1). It has also now passed both 1.618 and 2.618 the length of intermediate wave (1), so it may not exhibit a Fibonacci ratio to intermediate wave (1). The target calculation for intermediate wave (3) to end may have to be done at minor degree; when minor waves 3 and 4 are complete, then a target may be calculated for intermediate wave (3) to end. That cannot be done yet.
When minor wave 3 is complete, then the following multi week correction for minor wave 4 may not move into minor wave 1 price territory below 2,400.98. Minor wave 4 should last about four weeks to be in proportion to minor wave 2. It may last about a Fibonacci three, five or even eight weeks if it is a time consuming sideways correction like a triangle or combination.
DAILY CHART
Click chart to enlarge.
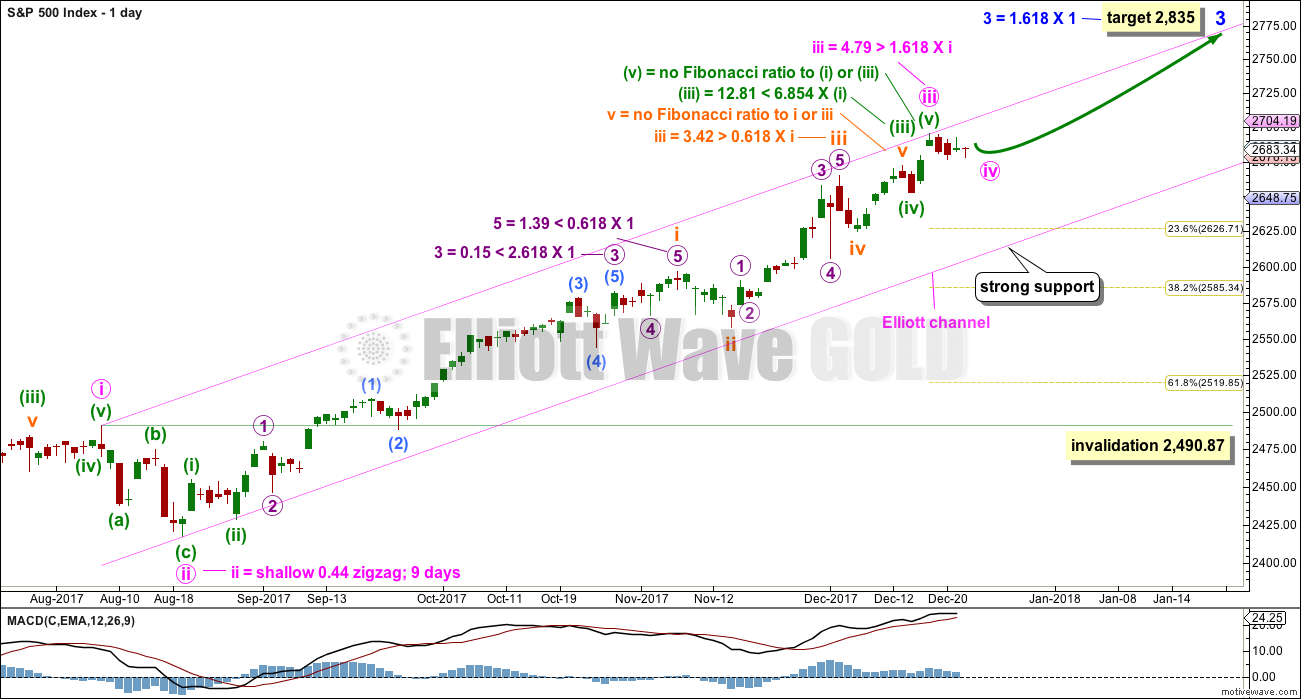
This wave count looks at the possibility that minute wave iii may have ended at the last high and minute wave iv may have just arrived.
There are better Fibonacci ratios in this wave count when compared to the last published alternate. At this stage, the last published alternate now looks less likely and will not be published again.
Draw an Elliott channel about this impulse. Minute wave iv may find strong support and remain within the channel, if it gets down that low. Minute wave iv may end within the price territory of the fourth wave of one lesser degree; minuette wave (iv) has its territory from 2,671.88 to 2,652.01. This target range would be possible for the alternate hourly wave count below.
Minute wave ii lasted nine days. For the wave count to have the right look (reasonable proportion), minute wave iv may be expected to most likely last either a Fibonacci five, eight, or possibly even thirteen days. So far it has lasted five days and the structure looks incomplete at the hourly chart time frame.
Minute wave ii was a zigzag. To exhibit alternation minute wave iv may most likely be a flat, combination or triangle. But it may also be a zigzag though because the S&P does not always exhibit perfect alternation and a zigzags is the most common corrective structure.
Minute wave iv may not move into minute wave i price territory below 2,490.87.
HOURLY CHART
Click chart to enlarge.
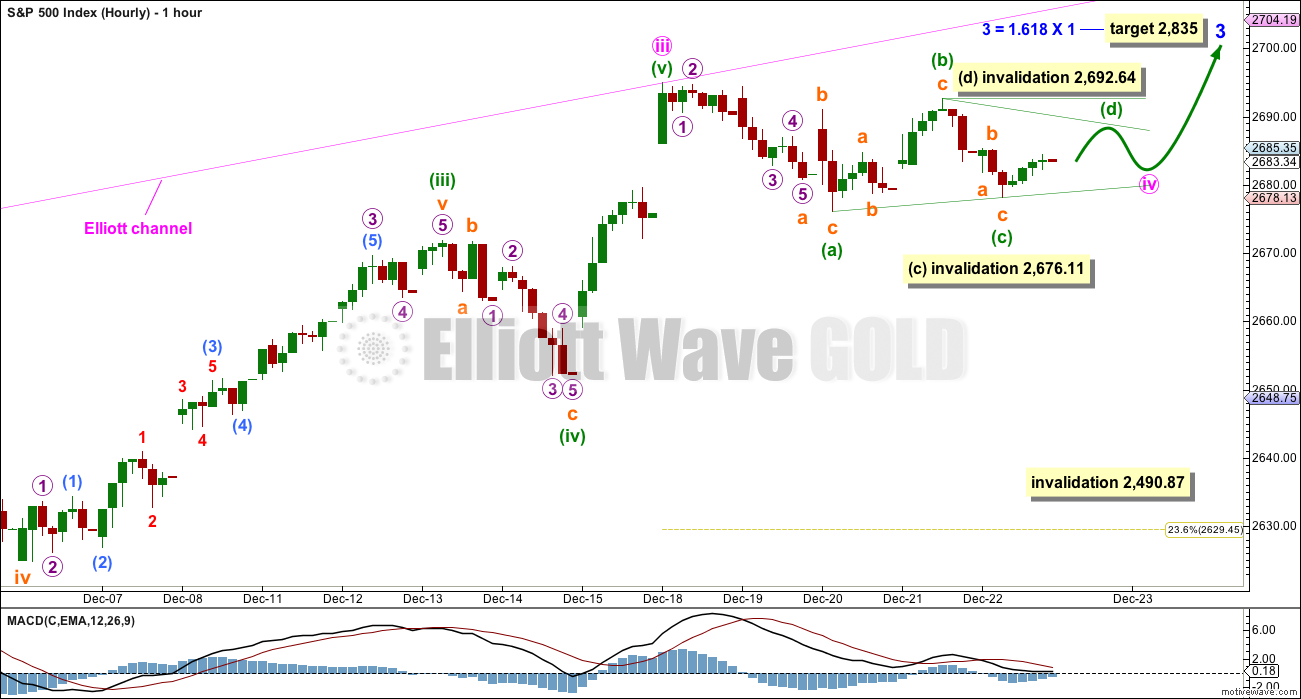
There are more than 23 possible corrective structures that minute wave iv may take. At this stage, it looks unlikely now to be a zigzag. It may be a triangle or a combination, the most likely structures for this fourth wave to take. This first hourly chart looks at a possible triangle.
Minute wave iv may be either a regular contracting or regular barrier triangle. Within a contracting triangle, minuette wave (d) may not move beyond the end of minuette wave (b) above 2,692.64. Within a barrier triangle, minuette wave (d) may end about the same level as minuette wave (b) at 2,692.64, so that the (b)-(d) trend line is essentially flat. Unfortunately, this is the only Elliott wave rule that is not black and white, so the invalidation point at 2,692.64 would need to be breached by a reasonable amount for the triangle to be invalidated.
For both a barrier or contracting triangle, any continuation of minuette wave (c) downwards may not move beyond the end of minuette wave (a) below 2,676.11.
For both a barrier or contracting triangle, minuette wave (e) may not move beyond the end of minuette wave (c). Minuette wave (e) would most likely fall short of the (a)-(c) trend line.
The breakout from an Elliott wave triangle should always be in the same direction of entry; they are always continuation patterns. The classic pattern equivalent is a pennant.
ALTERNATE HOURLY CHART
Click chart to enlarge.
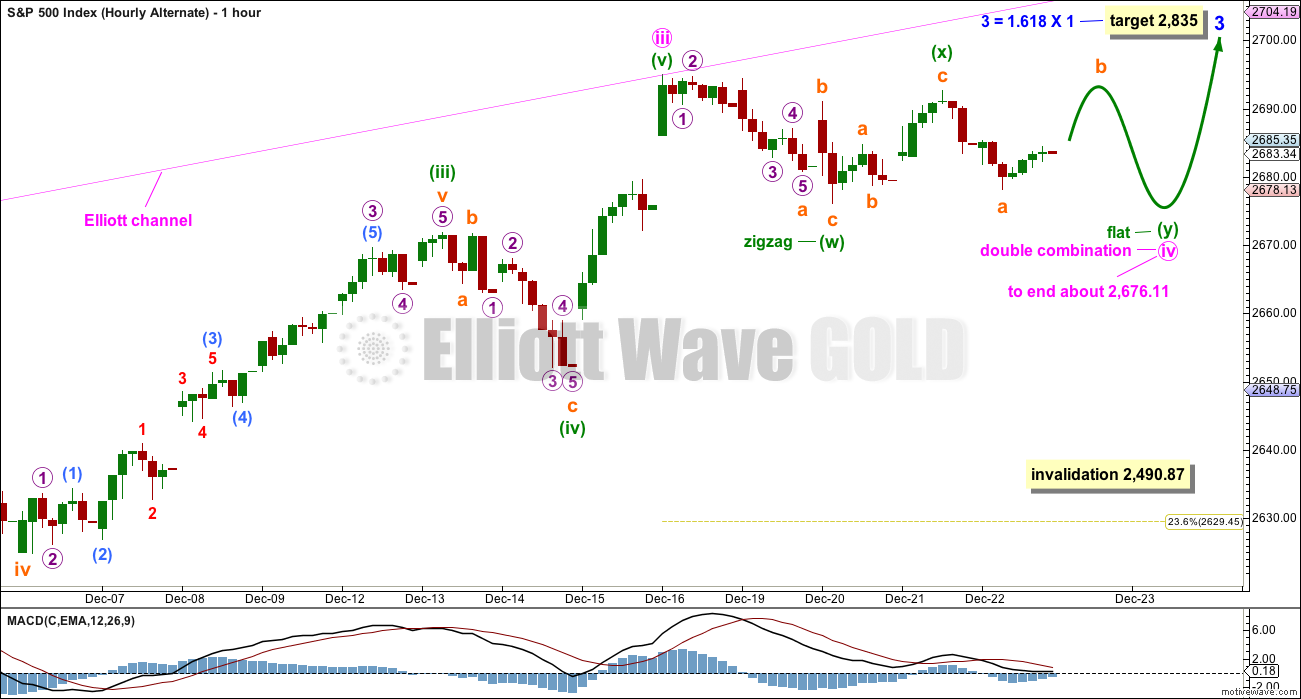
This alternate hourly chart looks at a different possible structure for minute wave iv.
It is important when an Elliott wave triangle is considered to also consider alternates. Triangles are tricky structures. What looks like a triangle can often turn out to be something else, most commonly a combination.
Combinations are very common structures, particularly for fourth waves.
Here, the first structure in the double combination would be a completed zigzag labelled minuette wave w. The double is joined by a three in the opposite direction, a zigzag labelled minuette wave x. Minuette wave x is relatively deep, which is normal for X waves within combinations.
The second structure in the double may be an unfolding flat correction labelled minuette wave y.
Within the possible flat correction of minuette wave y, subminuette wave (b) must retrace a minimum 0.9 length of subminuette wave (a) at 2,291.19. The most common length for subminuette wave (b) would be from 1 to 1.38 times the length of subminuette wave (a) giving a range from 2,692.64 to 2,698.15.
Combinations have a purpose, to take up time and move price sideways. To achieve this purpose the second structure in the double normally ends about the same level as the first. Minuette wave y may be expected to end about the same level as minuette wave w at 2,676.11.
If price breaks upwards to a new all time high on a strong upwards day with an increase in volume, then it should be considered a classic upwards breakout. If that happens before the Elliott wave structures on the hourly chart are complete, then my hourly analysis is wrong and the fourth wave was over already.
TECHNICAL ANALYSIS
WEEKLY CHART
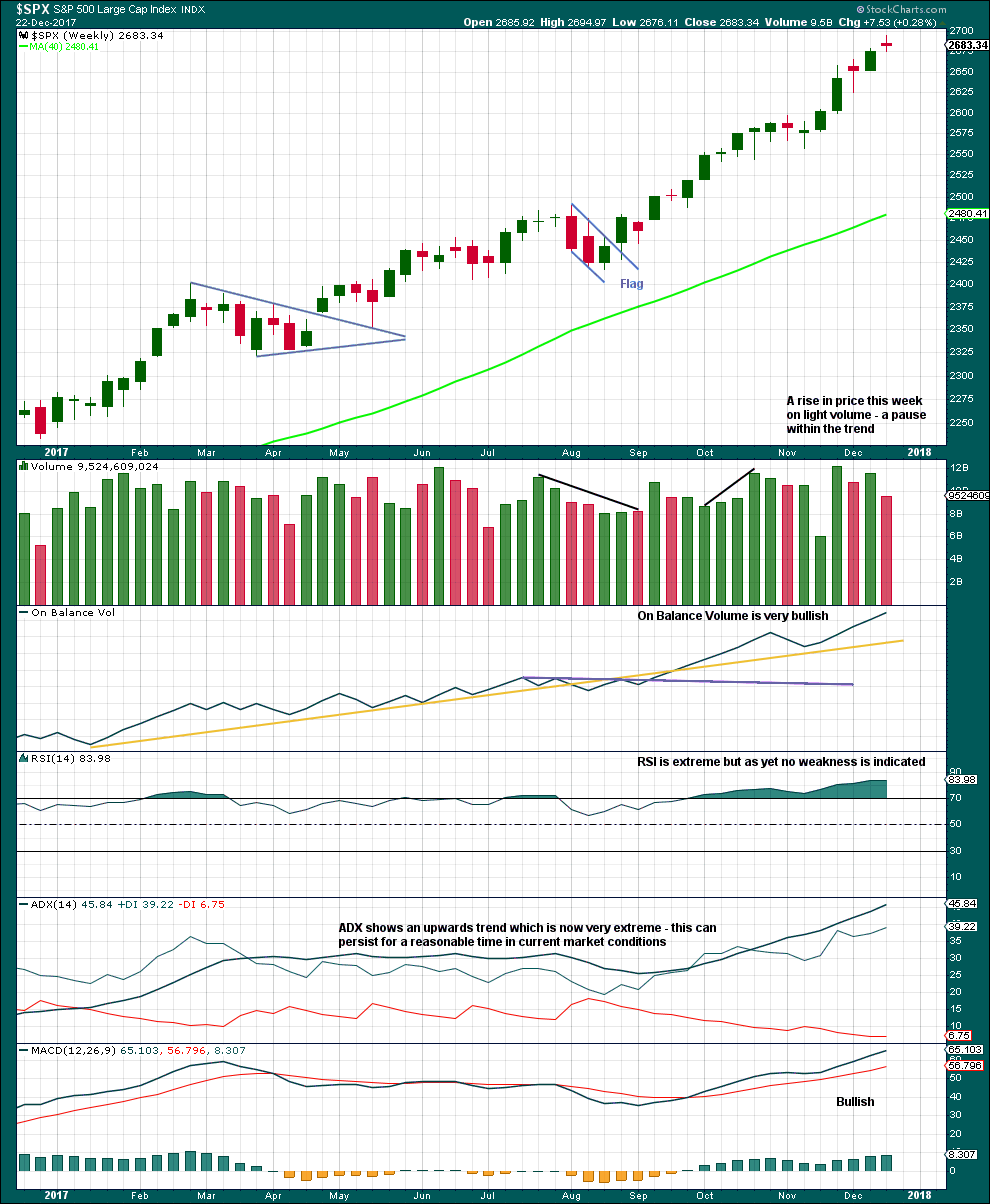
Click chart to enlarge. Chart courtesy of StockCharts.com.
There is still no candlestick reversal signal at highs. The trend is now very extreme and overstretched, but this can continue for longer before price is ready to turn.
Overall, at this time frame, this market remains very bullish. That picture does not change this week.
DAILY CHART
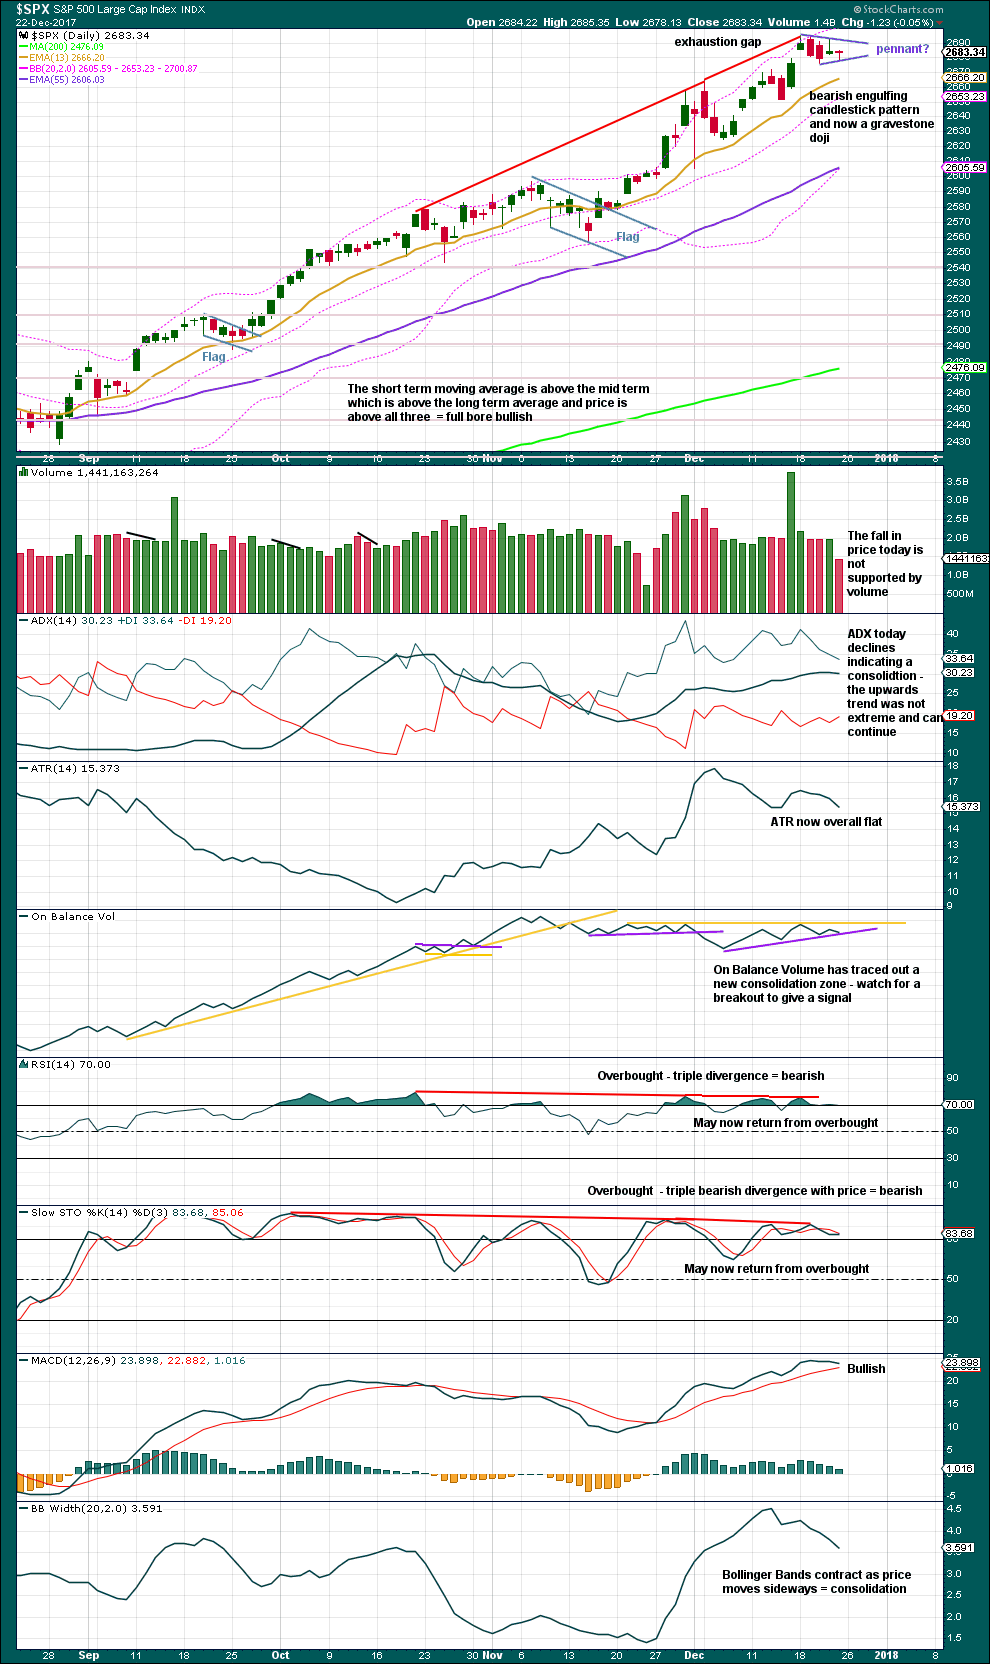
Click chart to enlarge. Chart courtesy of StockCharts.com.
The last gap is now closed. It is now indicated as an exhaustion gap and not a breakaway gap. This is a bearish signal, at least for the short term.
The last few signals from On Balance Volume were bearish. RSI and Stochastics are bearish. But ADX indicates the trend is not yet extreme at this time frame.
There are now two bearish candlestick patterns: a bearish engulfing pattern and now a gravestone doji. Along with the closed gap, this offers some support to the main wave count. Reversal patterns indicate an end to one trend and the start of a new trend, which may be either sideways or a 180 degree reversal. They make no comment on how long the next trend may last nor how far it may travel.
A small pennant pattern may be forming. If price breaks out upwards, it should have support from volume. If that happens, then use the measured rule to calculate a target. Take the flag pole from the low of 6th of December at 2,624.75 to the last all time high, so a length of 70.22 points, and add this to the breakout point.
My decision for the start of the flag pole is subjective; members may disagree and have their own interpretations.
Pennants are one of the most reliable continuation patterns. If this completes and price does break out upwards, then have confidence that it should continue.
VOLATILITY – INVERTED VIX CHART
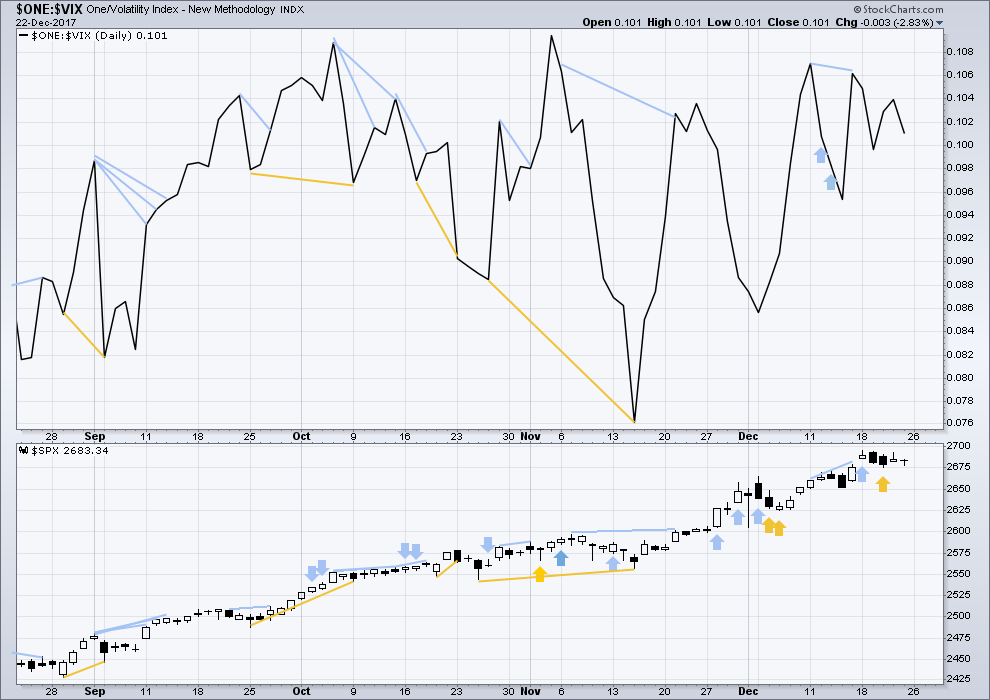
Click chart to enlarge. Chart courtesy of StockCharts.com.
So that colour blind members are included, bearish signals will be noted with blue and bullish signals with yellow.
Normally, volatility should decline as price moves higher and increase as price moves lower. This means that normally inverted VIX should move in the same direction as price.
There is no new divergence noted today between price and inverted VIX.
BREADTH – AD LINE
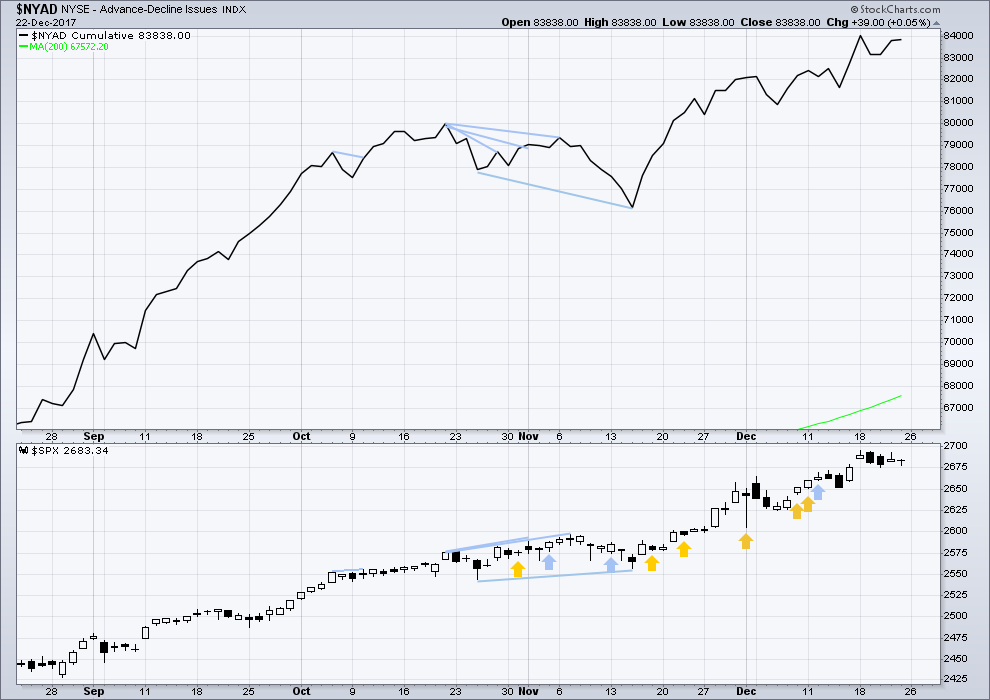
Click chart to enlarge. Chart courtesy of StockCharts.com.
There is normally 4-6 months divergence between price and market breadth prior to a full fledged bear market. This has been so for all major bear markets within the last 90 odd years. With no longer term divergence yet at this point, any decline in price should be expected to be a pullback within an ongoing bull market and not necessarily the start of a bear market.
Only large caps made new all time highs again this week. There is some weakness with mid and small caps unable to make new all time highs; this is bearish.
Breadth should be read as a leading indicator. At this stage, there is no divergence between price and the AD line to indicate weakness.
DOW THEORY
The S&P500, DJIA, DJT and Nasdaq this week all made new all time highs. The ongoing bull market is confirmed.
The following lows need to be exceeded for Dow Theory to confirm the end of the bull market and a change to a bear market:
DJIA: 17,883.56.
DJT: 7,029.41.
S&P500: 2,083.79.
Nasdaq: 5,034.41.
Charts showing each prior major swing low used for Dow Theory are here.
Published @ 12:09 a.m. EST on 23rd December, 2017.
Welcome back Lara. We are, of course, glad you are back and hope you had a wonderful and renewing time off.
Regarding my comment below from earlier today. I hear and share Joseph’s frustration in using EW Theory as a trading tool. That is what makes Lara’s analysis and commentary so very important. She uses a host of other tools, indicators, oscillators etc. to help understand the waves. That adds an invaluable perspective to her analysis and commentary. For instance, in her comments today, she is indicating the current action is looking like a 3rd not a 5th. We know from past commentary that 3rd waves are generally expected to have the highest MACD reading of the degree being analyzed. Invaluable stuff.
So, yes Lara, we are glad you are back.
And I might add, Lara has an incredible discipline and logic I cannot come close to mimicking.
Very kind words, thank you Rodney 🙂
Your normal daily analysis resumes today.
Next post is after the close of today’s session, and after StockCharts have finalised their data which normally happens about 6:30pm EST.
That’s when I begin figuring out the wave count.
I’m back folks.
Updated daily chart:
I’m concerned that price is now above the upper edge of the Elliott channel. That looks very bullish, it looks like a third wave not a fifth. I would rather expect this market to behave with stronger third waves than fifths, it’s not a commodity. That doesn’t mean it can’t behave like a commodity, only that it rarely does.
I’ll be reassessing how I’m labelling minor 3. It may change.
Updated hourly chart:
Minute iv fits perfectly as a combination.
I may change labelling to see instead if minute iv, another second wave there. Which would put this current move as the middle of a third wave.
Is it possible that this is just a throw over?
This Friday will tie the 391 days long without a 5% + correction.
At some point in the next 4 – 40 trading days there will be a correction?
95% Bulls at the moment with extremes like that the market can easily turn anytime.
Yes, that is entirely possible.
It would mean that the S&P is behaving like a commodity, this wave is stronger than what I have labelled the third so it would have a strong fifth.
Entirely possible, but not as common for this market.
Welcome back! 🙂
It’s actually good to be back!
I had some good travels and a little bit of surf, now back at home into a normal routine is good.
Since 1950, a market rise in excess of 2% during the first 5 trading days of January has resulted in a positive year 100% of the time. Despite the current remarkable sentiment extremes, a positive close today puts history squarely in the bulls’ corner. We are up well over 2% already this new year.
I am expecting that does look highly likely. Intermediate (4) should turn up within this year, and possibly primary 4 too. But they will both be over within about 2-4 months.
Which could see the year beginning with an upwards trend, and ending with an upwards trend.
There is zero divergence with price and breadth, and so the bull is not yet ready to exit. Not for months yet, possibly 1-3 years.
In this blog, we often mention the Grand Super Cycle V top looming ahead. That is Lara’s longest term Elliott Wave Chart pattern. However, it is possible that alternates exist which could put that top at the 2000 high. That would have been followed by an A-B-C correction to the 2008/2009 low. If that alternate were correct, we would be in the midst of a Super Cycle 1 up. Other alternates on the Cycle and Super Cycle degree exist as well.
I know Lara has excellent reasons for her current longest term main count to have a very high probability. But it is only a probability. Other possibilities exist. I just want to point out that it is important to remain open to other longest term possibilities. For instance, in 2016 we were all convinced (especially me) that the top of this bull market had been completed.
The Dec 2015 through Jan 2016 drop of 300 SPX points was only the beginning of the bear market. We were convinced. I put the house on that conviction, so to speak. In late July 2016, the Elliott Wave count was dramatically changed to bullish because price told us it had to change. We have been looking for 2900+ on the SPX since. It took weeks for many members on this board, including me, to adjust mentally. I give Lara great credit for making that difficult switch in counts. It was not easy but she stuck to her guns and has been right on since.
My point of all this is we must remain flexible on the long term count as well as the shorter term counts. For right now, all the information points to a continuing bull market; up, up and away with corrections along the way. When we get to the 2900 area, Lara will re-assess the situation and counts. But don’t be surprised if we find alternate counts calling for SPX 3250+.
Just my thoughts on the US equity markets as we move into 2018. Have a great day.
That’s useful historical perspective Rodney. In a smaller way, I remember the point in late spring of ’17 when it was believe a minor 4 had kicked off, and I got caught the wrong way once or twice watching my position go quite against me as the market launched new bull market moves. Price action speaks, particularly when it’s contrary to a biased outlook.
That’s the issue with EW… there are many counts. Which to bet on at this time and when is my problem with all this.
I respect Lara’s counts. But I have followed Prechter since late 1970’s and he has made some excellent calls and some very bad calls as to timing which have cost me money. He nailed the turn in May/June 2015…. claims he made the call in Feb 2016 for this V up {Very unclear at the time to me that he made it… I thought well after the fact}.
He is currently calling the end of 5’s at multiple degrees. On a Throw-over right now… but all his current calculations are being blown by.
24,808 – 24,899 was the 2nd and then 25,114 was the 3rd and the only one still close is 25,549.24. The others much higher and he is calling “Crazy”!
Also, he had a well thought out theory with calculations calling for the Top in 2017… next one is January 2018. Other is late in 2018 that would match up with the “Crazy” ones. Since all these are so close as it turns out… I am concerned that the Throw-over can end at any point between here & there.
This is another EW perspective out there that can’t just be discarded.
So I am waiting to see how January unfolds to eliminate his stuff.
Looking forward to Lara’s updates.
Lara has be spot on while my subscription has been active. She does a great job with the daily stuff for very active traders.
I was not active during the May August 2015 period so I am not sure what the calls were then. I activated again early January 2016. I think… but have to check.
Just looking at all the possibilities… so I don’t get hit by a surprise. It is hard to put a trade on to take advantage of any of this… unless you are super short term in thinking.
‘Tis challenging, and I don’t have any easy solutions. One approach is to use the “2” and “4” calls as opportunities for long entries, with well defined risk because there’s a well defined price at which the entire EW structural call becomes wrong (i.e., in a 2 and price drops below the start of the 1). When used this way, EW becomes a means of establishing (1) a bias to trade and (2) a rationally based risk structure. Additionally you can look for your fundamental biases to be lined up with the EW bias, and then again look for low 2 wave and 4 wave entries. One of the reasons I subscribe is to learn the mechanics and challenges of counting, so I can do this in other markets, for example bonds via TLT/TBT, where right now I believe the count is well lined up with the general fundamental view that interest rates are rising. I’m in a positive TBT position right now as a result. Hope this helps.
There are so many existential risks to human kind presenting themselves now that it’s hard to believe the end of the GSC is anything but ahead of us. The ending of the GSC will be impactful at a far greater level than the great depression, and neither 2000 nor 2008 was really close to that. The GSC looms ahead of us, and it will be at the level where thinking about just our finances will be quite insufficient. Where we live, how we live/what we survive on, etcetera, are the more critical issues. Civilization as we know it will change dramatically. As a side note, the world is now in the 6th mass extinction event in geologic history, a “biological annihilation” (the planet has lost 1/2 its wildlife in the last 40 years). The ice caps are melting and the oceans will rise by about 8 meters. That’s A LOT. The devastation of coastal areas and loss of “wealth” will be extraordinary. Then we have the risk of nuclear war, and only a few bombs blown off in the atmosphere will cause a massive plant die off that will last decades. And the risks of the nuclear materials in scores of nuclear power plants getting into the ecosystem is a major threat to life (biologic mutations driven by radiation end up terminal for the species after about 8 generations). No, the “other side” of the GSC is not here yet. We intelligent humans are, at a species level, quite un-intelligent. We are unable to adapt through evolutionary processes at the rate needed to deal with the massive change we have introduced through our technologies. The result will be grim.
Don’t forget the “Nuclear Winter” that will probably result. We also have super volcanoes starting to rumble that, if they erupt, will accomplish the same thing, even without a nuclear exchange.
I live quite close relatively speaking to the super volcanoes. Yellowstone is to my east so I might live out that one for a bit. But I am almost on top of and just west of the Pacific Rim in the Pacific North West. If it goes, I want to go quickly into the night! In the meantime, I enjoy the type of natural wonders these areas have to offer. I immerse myself in it for my sanity.
Dow Futures were 95 up and now we are negative.
Maybe a little breather before we rocket up
Shock and awe, indeed! RUT, NDX, INDU and SPX all down. Mark the calender! Lol!! Somehow I doubt it’s going to last long, but you never know. I like the long set up in RUT right now, bouncing off a 50% fibo.
That didn’t last long, NDX to new highs. RUT buy off that 50% fibo…perfect!
How will the tax cut $’s be used? From CNN: “Bank of America forecasts that companies will devote $450 billion — or roughly half the remainder after paying taxes — to stock buybacks. That’s a huge windfall that doesn’t even include buybacks inspired by the lowering of the corporate tax rate to 21%. It nearly totals the entire amount that S&P 500 companies bought back in 2016.
If that prediction sounds aggressive considering the tax law is supposed to be about jobs, consider history. During the last repatriation holiday in 2004, roughly 80% of the money was spent on buybacks, BofA said. The firm assumes a smaller percentage now because stocks aren’t as cheap this time around. ”
Follow the wave count, Luke. Many 4-5 wave cycles to go before a grand super cycle collapse. Many. This market be going much, much higher first.
That may be the only industry as they have nothing real to invest in.
All the other industries will make investments in the USA to grow revenue and in effect real higher paying jobs… in the USA.
But my view has always been that buying back stock is WASTE of Capital and Cash! Those funds should be for a more producdive use.
Interesting Zero Hedge article… about what Powell said during a 2012 Fed meeting where the transcripts were just released…
“And then the punchline:
[W]hen it is time for us to sell, or even to stop buying, the response could be quite strong; there is every reason to expect a strong response. So there are a couple of ways to look at it. It is about $1.2 trillion in sales; you take 60 months, you get about $20 billion a month. That is a very doable thing, it sounds like, in a market where the norm by the middle of next year is $80 billion a month. Another way to look at it, though, is that it’s not so much the sale, the duration; it’s also unloading our short volatility position.”
So the Fed Shorts and Holds a Short Volatility position… that it says it has to unload!
AT least that is what was said in 2012.
Also:
{Fed’s VIX trading aside, here is perhaps the most fascinating part of Powell’s speech, one which contains some truly unprecedented – for a future Fed chairman – admissions:
I think we are actually at a point of encouraging risk-taking, and that should give us pause. Investors really do understand now that we will be there to prevent serious losses. It is not that it is easy for them to make money but that they have every incentive to take more risk, and they are doing so. Meanwhile, we look like we are blowing a fixed-income duration bubble right across the credit spectrum that will result in big losses when rates come up down the road. You can almost say that that is our strategy.}
I KNEW IT!!!!!!!
( I am still stunned!!)
It should FINALLY put to rest the entitre question of CB intervention in markets.
Any trader would have had to be BLIND not to see it….very bad…very bad indeed..what else are they doing???!!! How large is this short vol trade???!!! 🙁
Read the article on zero hedge… still there… right at top of home page.
I can’t remember the last time the bullish % was this high in the last 3 weeks in the AAII… I think you have to go back before 2008.
AAII Index
Bullish
59.8%
52.7%
50.5%
Bearish
15.6
20.6
25.6
Neutral
24.7
26.7
23.9
His comment about protecting investors from ” serious losses” is breathtaking in its hubris. This was going on in 2012, what are they doing in 2018?
They just released transcripts from 2012 so I guess we won’t know until 2022ish.
I bet they still hold that short vol position… it’s probably 3 times what they had in 2012.
Far bigger than that. The nature of futures is that the relationship to maintaining that kind of short position is not arithmetic but geometric.
These people are common criminals. What we are seeing so far as price levels in these markets is nothing but an fantastic illusion. I decided to start liquidating a few trading accounts a bit early after reading that article. Nobody is so naive as to think the timing of this disclosure is coincidental. Why now? I suspect it is entirely for public consumption to bolster the notion of FED invincibility and that cannot be a good sign. What difference would it make whether or not the public knew what they were doing behind the scenes? Unless of course they were becoming a bit concerned about the efficacy continued efficacy of what they have been doing all these years…?
The new era of rising rates may be forcing their hand to now jaw-boning their prowess no doubt….
Just got home and what a day!!
Hope you all had a successful week and have a nice weekend 🙂
Looking forward to having Lara back next week!
Does anyone remember the last time all three indices actually closed ABOVE their upper B bands?
FOMO on steroids!!!
Really scratching my head on VIX. Can anyone explain to me why on a day like today, I am completely unable to buy vol on the cheap? Something does not add up, unless of course, despite today’s action, there are serious buyers of protection…??
This is amazing to watch! The seeds of a major collapse are being sown in front of our very eyes.
The elusive collapse!
Waiting for Godot!
26,000 in 5 days is next. Unbelievable!
A blow-off topping process perhaps?! 🙂
That’s been true for 13-14 months now.
Looks like this (v) of the minute v is just getting into its 3 phase, to me. Past the (v) = (i) point.
And there are many, many iv-v combos to go, leading the market higher and higher through 2018. “Use the wave count Luke!”.
The mongoose of the Schenectady = the traverse of the 281 = 25,549.24 DOW
The mongoose of the Schenectady = the traverse of the 281 = 25,549.24 DOW
Are you referring to Robert Pretcher next target in the Dow?
Just making fun of it all… but yes that is the next ending calculation of a throw-over in DOW. Should be there at this rate on Mon or Tuesday.
All prior “Likely” have all be wrong.
2:40PM
Bomb Cyclone??? Are they making up new names for snow storms????
I would like to use that name for something else.
Moon Shot… To the Moon Alice, to the moon. Bang Zoom…
O.K. I’ll admit it. It really STINKS that we cannot get a good entry on VIX with markets up triple digits!! Does anyone think this is normal??!!
I give up. Removing stink bids from market as that is apparently no longer going to fly.
You just watch…price will now head South…! 🙂
Is another end of day Friday sharp sell off on its way, again? Or, a buying rush? Or, a quiet sideways ride into the weekend? I’m betting #1 or #3. My own EW count (“danger Will Robinson!!”) says it shouldn’t do a sell off quite yet…
No bites on my stink bids. Everytime I do one of these trades they ignore me for awhile. Did I just ruin the predictable Friday smackdown??!! 😀
Sure looks like you are going to get your SPX close well above 2730 though. Well, it’s not over until it’s over, but…
If VIX takes out this morning’s high we are probably not going to get that cheap friday entry…nuts!!!!!
An earlier post from Lara.
“Just wanted to say over here too that I want to give a big THANK YOU to all members here for your support over the years. To those who are subscribed, your support means a lot to me. Looking forward to coming back to work after the Monday session closes next week.”
I just want to say, you are most welcome. I am glad you are looking forward to coming back sometime on Monday. However, had I been your boss during this holiday / vacation, I would have scolded you for checking in during the week. Be that as it may, we appreciate your dedication and devotion to your clientele.
You know… these stock markets are NEVER… EVER going to correct 10% or more… ever again!
That is the ONLY conclusion you can come to at this point!
Well, my view is that it won’t happen while you-know-who is in charge. Patiently waiting for that to change….then it won’t be just a 10% correction….
Getting positioned for the Friday VIX smackdown…it could be short-lived…
How I see this impulse at this point. 2742 would have the minuette v = minuette i. Seems like a minimum for the high of this minute v.
Looks good to me!
It is now fourteen trading days since VIX printed that extremely rare “three white soldiers” pattern. My view on those kinds of rare patterns is that if they fail to confirm by the conclusion of the second week the pattern is a failure. I would consider a close above Wenesday’s high and a rejection of the ususal Friday VIX
smackdown a sign that the pattern might still be viable.
Looks like the “Old Man’s” “likely” range’s are toast.
The next up ranges, he calls “Crazy”. So it looks like the DJIA will trade like a commodity and have a commodity like spike when this is all said and done. “Old Man” didn’t believe that was possible.
He has been silent since 24,899 and 25,113.96 are out the window. Maybe later today he will put something out.
So onward and upward to CRAZY!
I feel really badly for Prechter. If the man who wrote the book cannot get it right it does make you wonder if is time for him to just hang it up. His calls have been an absolute disaster for those of his readers trading based on what he predicted. So sad! I left that camp many years ago after I found Lara’s website and never looked back. 🙂
I recently went back to only his report because a friend of my said I had to read all the reports he put out in the last 6 months. He was accelerating reports for sept into august and in October posted the November and December reports. It was all a good read.
But all “Likely” ranges have come & gone with the latest 2.
So onward and upward to CRAZY for the DOW!
Which I think {have to analyze} will now co-inside with Lara’s conclusions to wave 5 IN S&P.
I have to admit Bob is a superb writer, and I thoroughly enjoyed reading his generally well-written missives. The problem is his predictions were always almost laughably exactly wrong! At the time I left his new Socionomics book wss getting ready for printing and he started substituting excerpts from it for his “Theorist” publication. Its quality had seen a considerable decline several months running prior, probably due to his focus on the new book. It was the last straw for me personally.
Another sub 9 visit by VIX and I pull the trigger on that trade once again.
The spread will again be lousy to discourage traders but there are ways around that subterfuge! (Yep, the old “stink bid” to catch em on the spike) 🙂
Taking the money and running on my atypical leveraged VIX trade from yesterday. That’s the way I like ’em…short and sweet!
Qapla!!!! 🙂
What were you buy and sell points Verne?
Trade was a March VIX 8/10 bull put spread sold for .35 bought back for .20.
It does not look like much but if you can do it confidently with larger lots it really works well, and especially if you get in and out before the market makers gang up on your position. 😉
Thanks Verne.
Do not trade Vix normally but took a small position yesterday at 8.89
Just interesting too see what happens as is discussed so much on here
Right now VIX is range bound and near dated options are likely to suffer terrible time erosion unlesss profits are booked quickly. I have found a profit target of ten to fifteen percent on options is a good place to pull the trigger and I will generally open a sell order with that target as soon as I get filled. Lots of small winning trades can really add up…
Lol!!! Nice work Verne.
🙂
There’s a symmetric project decision point for SPX at 2735 or so. Next up is way up: a 1.62% extension up at 2765. The tax cut jet packs seem to be firmly in place and very much on “throttle up” for the moment!!
Tax stuff Priced in.
Only 357 companies in the RUT are Profitable and have any benefit of tax reform for 2018.
That is only 357 out of 2000 Companies in the index.
If I could easily figure out how many profitable companies are in the other indexes. I.e. S&P and DJIA I would.
For any benefit of tax reform the Company must have Profits in 2018.
No Profit, No Benefit. That is Profits calculated according to GAAP and Tax Law.
That is NOT Pro-forma! Meaning all those 1 Time Charge Off’s that are never counted in the Pro-Form EPS are counted in GAAP and Per Tax Law.
It appears at least this week that the market disagrees with you. Next week, no one knows. My outlook is in line with Lara’s longer term EW count (after all, it’s why I’m here): the bull is going to roar through most of 2018, though the volatility and size of the pullbacks will go up lots as the elliott wave structure moves into the intermediate, minor and primary 4’s.
Yea they are up… but nothing to do with Tax Reform.
People are actually starting to talk about a VIX print of FIVE!!!!!
In another time, at another place, I would dismiss that as the biggest pile of cow manure imaginable. Today? Not quite so sure…! 🙂
You have any links to this unbelievable story.
SPX hit that symmetric projection and turned, and all markets pausing. A flood of buying pressure could come in any moment and I’m staying very alert, but it appears to me it’s time for a market breather, “profit taking”, and either a 4 or a 2 or whatever is up next to start here.
Any thoughts on todays love so far?
Move* 🙂
All you need is love… 🙂
Haha! That is all we all need!!
Happy trading Verne
January 18, 2018 will tie the longest time duration ever to not have a 5% pullback in the market. 394 days!
I would be very surprised if the market holds up a lot longer then that before at least a 5% pullback.
When this is complete we will have a very big correction.
Loot at the Wilshire 5000 index in relation to our GDP currently at 142.9% very close to the March of 2000 when it reached 148.5%
Anything over 100% is considered overvalued.
Also April 18, 2018 will make this the 2nd longest bull market since 1850’s.
If the market can hold up past June 2019 it will make this the longest bull market in Us History!
Please share
I’d guess all those records and extremes in valuations get blown away. $1.5 trillion in gasoline is getting poured into this market, and corporate earnings are going to go ballistic. That all said, eventually we’ll get into the cycle of larger 4’s and 5’s, and things will get wildly erratic for a while (a year or two or three?). It could start any day; it could take another 3-6 or more months, or, an “event”. I don’t think it will be war with NK; I think it will be political fireworks in the US, and the markets will spook and finally start the first of the sequence of larger 4’s and 5’s. “Follow the wave count, Luke…”
The next market regression will almost certainly be through the mean. The fact that people are now staunchly denying that it will happen is prima facie proof that it will. Times and markets may change, but human nature does not. As the great W.D. Gann said quoting King Solomon- “That which has been will be, and there is nothing new under the Sun”.
Taking advantage of the long side of the market “now” and in the immediate future is not denying that there will be market pullbacks, nor that there will be an end to the grand super cycle and a massive market collapse. I agree the “average investor” is going to get crushed, but that’s why we are here, among other reasons, right? To have the info that tells us collapse is immanent. It’s not close to immanent at this point in time. Yes, “it could happen at any time”, but…historically, it doesn’t work that way. If we submit to the thesis that a market collapse could happen any moment, I guess we’d just be in the mode of constantly shorting against a raging bull market. That’s a very tough business, which you seem to have the chops and mentality for, but it’s a rare bird who flies that route successfully and consistently. I’m a “go with the flow” person because I like the odds stacked in my favor, and I without any question operate on the theory that macro level flow changes will be noticeable in plenty of time to get oriented the right way as the Big Collapse sets up and initiates.
Today was the first time in history that VIX notched an 8 handle TWICE in a 24 hour period. Some folk are predicting a print of 5 before the bull is done! 🙂
Interesting development here at the close. Today’s candlestick looking a bit less bullish than the last two. However, VIX is still flat, and breadth is looking good. RUT hit a new ATH today and will have an ATH close, confirming the bull trend. There is definitely some divergence, but not nearly enough to begin talking about a significant downturn.
I am not totally sure what to make of it all. I closed my longs from last week yesterday for a hefty gain, missing the last leg of upwards movement this morning. I opened up a small short call spread earlier today which is still at breakeven. Planning on closing tomorrow regardless of whether it is up or down. I have learned my lesson trying to short the trend. I will most likely be long going to the weekend. I highly suspect we are in the 2 of a terminal 5, so the 3 should begin soon.
Mr. Market is VERY funny. I had a target of 2730 for SPX and what does ES do?
2929.00
And SPX?
2729.29….You’ve gotta be kidding me! 🙂
Of course we are not done yet and price could well blow past that pivot.
I am long with any CLOSE above it. It meets a decades long trend-line from beneath and that would IMHO be very bullish…
Just wanted to say over here too that I want to give a big THANK YOU to all members here for your support over the years. To those who are subscribed, your support means a lot to me.
Looking forward to coming back to work after the Monday session closes next week.
As one wise guy comedian quipped, “Don’t thank us…THANK YOU!” 🙂 🙂 🙂
Interesting dog-fight in VIX. The bulls continue to buy the smack downs and despite all the new highs we could close green….
Did all the North East Coast market players go home including NY/NJ?
Seems like volume completely died.
I rarely use margin in my account. Occasionally, I make an exception… 🙂
Qapla!!!!
I am probably going to get smacked! Thanks anyway, Worf… son of Mogh! 🙂
Never!!! Ever!!!!! What’s wrong with you, dude???
I was REALLY conservative. VIX would have to close BELOW 10.00 March 21 for me to be at risk but I expect to be out LONG before that! 🙂
Celebrations occurring from Business Media all over about 25,000+
Dancing in the streets.
All Cover pages to print 25,000 in big bold letters!
Between 24,899 and 25,115
Spike to 25,113.96 may be touched soon… then we see what unfolds.
Is being below that print by 8.00 even… close enough to meet it?
Eight is an interesting number to be away from 25,113.96.
I have two symmetric projections and a 1.62% extension in the zone of 2718-2723, definitely a decision and likely turn area. Next stop up after than: 2735, another symmetric projection. Then all the way up to 2775, yet another symmetric projection.
As I suspected, the tax bill is pouring gas on what was already a flaming inferno of a market. Finance finally joining in the party in a BIG way today. I got some, should have had more (isn’t that always the case, lol!!). FSLR got sold off HARD this morning, and I’ve bought a chunk at the current bottom. Go buy some for me and and drive that price back up please!!! I also like TBT here, always risky but all levels of trend there are/should be “up”. I watching for a possible turn in SPX around 2734-35 now, my next up symmetric projection of a prior similar move.
Anyone know what driving the 2 day sell off in INTC? Oh, minor chip issues. I’m thinking about getting me some of that soon….
Yep. I expect 2730.
Nice break from bull flag…
Bought some VXX. Let’s see if my timing is right or not here…just a little sell off in SPX please, may I?
INTC bounced off previous support exactly as I suspected, ka-ching.
FSLR has me underwater a bit but has finally shown signs of stopping/turning.
TA updated:
it’s all on the chart folks. looking again here very bullish. the breakaway gap may be used for support / stops.
Quick update EW count:
Minute iv looks complete. Minute v now underway. At 2,842 (just above the target for minor 3) minute v would = minute i, and so maybe the target should widen to a zone 2,835 – 2,842. Although that seems rather wide TBH.
I notice price is at the upper edge of the channel. It may break through… again. OR it may find resistance there. If it does break above then look for support at the EW trend line.
My current model for this new minute V is that price has just completed (1/4 at 9am PST) a “1” up, and a 2 is due. Which should take price down at least 38% of the move up, and probably 62%, hence to at least 2707.7, and perhaps to 2695. However…the bull force is strong and my model could be quite wrong. I’ll let price action inform me here as the day proceeds.
Alternative model: what I thought was the top of the 1 of the 5 is in fact just the top of the 3 of the 1 of the 5, leaving a 5 of the 1 (of the 5) to go, which could reach to and turn at 2734, a symmetric projection of a prior up move. One way or another, I don’t expect loads more “up” before a 2 wave of this 5 up kicks in.
At this rate your 2835 – 2845 wave 3 top might be reached in the next 2 – 9 weeks. Any thoughts of time when this will be achieved.
Thanks everyone
As Joe noticed, the moves below 9.00 don’t come very often. Even in an uptrend there tends to be a nice upside spike within the next ten or so trading sessions when it does…have a great evening everyone!
Pretty triangle in INDU with A, B, C and D in place. Meanwhile, SPX knows only one direction for the last 2 days, but I suspect this initial impulse is a “1” of the new 5 and the “2” should be coming along soon enough.
Today looks like C of a big ZZ for wave one up. A ZZ down for wave two should be good for a sweet scalp of a ZZ up for wave three…it will be interesting to see if VIX chases the move up or prints a higher low…
What they are hoping for is that whale to exit his long call trade…I suspect he is going to buy more…he! he! 🙂
24,899 Close
24,808 to 24,899 range… maybe a close very near 24,899 will seal the deal?
Are we looking at history in the making??!!! 🙂
Maybe the market universe wanted to suck in the very last of the 401k money.
Those that adjusted end Dec 2017 to have THE most allocated to equities in years. That would be very typical of the market. The very last in get killed the most.
24,899 Close would time up perfectly with the 8 handle VIX today.
The turn of throwover is not supposed to be gentile. When it occurs, you are suppose to recognize it immediately.
Or… ” Old Man” is just wrong, again for 24,808 – 24,899
So on to the next possible zone.
Or maybe just one close just above the range to seal the deal.
WTFKs
I await new report.
I will be interesting to hear his current take! 🙂
To be fair though… he also has 25,115 as the next end point of throw-over based on a different start point for the calculation.
So Between 24,899 and 25,115??? Why not???
The next levels are “crazy” meaning DOW would have to trade like a commodity.
+ he did have one time analysis that says top in January 2018… close enough to 2017.
That now links up with the 8 handle on VIX…. could the Bear wake up at the same time volatility wakes up??? The very extreme and extended sentiment readings maybe suggest that it finally does.
He also makes this statement near the very end… “No know guidelines can help determine in advance the extent of throw-overs.
Thanks Joe. While I know we cannot be sure how high this animal is going to run, the thing that still stuns me is how little anyone is talking about the remarkable market extremes we are seeing. I don’t want to in anyway be dogmatic about what is going to happen to price but I sure want to be prepared when it does. I think a strong case can be made that the duration of the extremes we have been seeing means we are probably going to see very swift regression through the mean. It is possible that today we saw the cheapest level in volatility we will see this year….especially if the current VIX divergence with new all time highs persist.
https://www.zerohedge.com/news/2018-01-03/price-always-reconnects-yearly-charts-show-high-risk-accident
BTW, I think it is possible to count a wave one Zig Zag up for SPX with three four and five to come for a contracting ED. If this happens we know wave three will have to be smaller than wave one and wave five than wave three and wave four smaller than wave two so this thing can accelerate to a quick end if that is what is happening. A very huge clue would be VIX continuing to trend higher as zig zags of the remaining waves unfold. I will be looking very closely at how VIX behaves tomorrow. If we see a strong bounce from a smash down tomorrow with a green close regardless of what the market does that would be quite revealing.
Thanks Joe. While I know we cannot be sure how high this animal is going to run, the thing that still stuns me is how little anyone is talking about the remarkable market extremes we are seeing. I don’t want to in anyway be dogmatic about what is going to happen to price but I sure want to be prepared when it does. I think a strong case can be made that the duration of the extremes we have been seeing means we are probably going to see very swift regression through the mean. It is possible that today we saw the cheapest level in volatility we will see this year….especially if the current VIX divergence with new all time highs persist.
There is the break below 9.00…. 🙂 🙂 🙂
Filled on “stink bid” for Jan 10 9.00 strike calls for 0.90. This is a SPECULATIVE trade with only a week to expiration…
As expected, some selling pressure on VIX to spook the 9.09 buy. I wish ’em lotsa luck…
9.01
8.98
Tilting at windmills…it really is kinda funny! They are probably not quite done…
At some point, more traders are going to notice these pivots and it is going to be really interesting to see what happens when lots of buyers start trading around them.
🙂
Is this only the 2nd time that VIX had an 8 handle… ever?
8.96
According to my charts… 8.56 is the low on a 1 min spike down. Only in the last 30 days have there been 8 handles… my data goes back to Feb of 1998
Yep! Since the new VIX started trading.(1993)
Good observation. Probably a double bottom in the making so this could be quite significant.
Only 4 times ever! … all in the last 60 days since Feb of 1998
Not on a CLOSING basis I don’t think Joe….
Zero 8 handle closes. All were short in time spike downs.
9.14 is the lowest close to date or today maybe.
A bit of a long wick on 15 minute at 11:45 but not technically a hammer. It would be nice to see a real sharp spike down….Oh well, we’ll see….
Big VIX call buy at 9.09. I think they are going to try and shake out that whale…yikes!
Interesting gap up….!
Looks like a VIX low at 9.05.
I have a small “stink bid” contingent on any move below 9.00 but I suspect is ain’t happening….not today…! 🙂
O.K. I folded and settled for 2.85 on my last batch. “You can’t always get, what you want”.
Market makers hanging tough. They refuse to lower the ask on those March 10.00 strike calls. spread still at 2.90/3.00. I am keeping 2.75 bid open as we could see VIX spike below 9.00 briefly. If it does, get yourself an 18-wheeler! 🙂
Put a Tomb Stone on a VIX trade… volatility is dead and buried forever!
I took another quarter tranche of March 10.00 strike calls at 2.90.
I was hoping for 2.75 but bid not moving lower with VIX price so I will take what they are offering. Holding last quarter with open bid still at 2.75 in case we get a capitulation spike down from weak hands. We always see this shake the trees move on Wednesday expiration so nothing new here.
“You can lead a horse to water…”, as the saying goes…nothing is more deadly to successful trading than letting your emotions unseat your reason…
Funny, I went long the VIX 30 minutes ago, so I hope you’re a good leading indicator!
And don’t forget about shorting volatility. XIV up a cool 4.5% in 3 days. Peaked today at 142.
Volatility is quite lively, I’d say.
Sometime in the next seven to fourteen days VIX will do what it has been doing consistently for months now, and that is travel from well below 10.00 back to well above it- enough to return a reliable 25-50% gain on option contracts timely bought. There is not one in one hundred traders that will pay attention and take advantage of that no-brainer trade. I really just don’t get it folk, but what can I do??!! 🙁
I’m in. I’m even thinking of buying more…but not until there’s some clear indication this bull run is taking a breather. SPX could run for quite a while here. “The force is strong with it.” Looks very similar right now to the Nov 21 period, where SPX proceeded to run up about 70 points real quick.
My short term target for SPX is 2730 which is a tick or two under a decades long trend line that it is moving up to kiss from the underside. I took profits on long positions once the tick hit 2700 just to be safe. Nice run!
Looking at the daily, it bothers me (doesn’t look right) that this just ended 4 was so out of proportion (1/2 the time, 1/2 the price roughly) of the corresponding 2. Certainly everything since the August low is brutal to count. Looking at the minute 2 that ended with that low…I just don’t see an “equivalent” minute 4 yet! This one just completed just doesn’t seem to match it. Maybe the nature of the hyper-bull is causing a “shrinking 4’s” phenomena. Or not, and price is just in an ongoing set of extensions, and the “real” minute 4 is still looming. Looking forward to Lara’s next analysis.
Magnus Carlson (Sweden) vs. Hikaru Nakamura (USA) TODAY, chess.com speed chess championship round (they started with a field of 16 top players). Carlson is the reigning world champion in standard chess, and arguably #1 or #2 in speed chess. Nakamura has beat him in the past, and is also #1/#2 in speed chess. So it’s gloves off time, gonna be exciting!! Starts 10am PST, broadcast live on chess dot com. I expect it to be down to the wire, myself.
Magnus in control, 5-2, in final minutes of 90 minute first round (5 minute/game, as many as fit in). Nakamura not playing quite up to snuf, Carlson…well, there’s no better player on the planet, end of story!
Adding to VIX 10.00 strike calls lowering cost basis to 0.65. If VIX remains below 10.00 by tmorrow’s close will roll calls out to third week of January. Calls should trade for 0.90 above VIX 10.50
Appears to me the 4 is over and the 1 of the 5 is well under way. 2 coming; could go ALL the way back to 2675 area! Don’t be confused if/when it does. When that happens, its time to reaaaaally load up on the long side as I see it.
There is 1.62% extension at 2703.3 that is a likely stop and turn point for SPX here.
Wow, no respect for the 1.62% extension at all! The bull isn’t just alive, it’s running wild in the streets! Giddy-up!!
The 2.62% extension is up at 2721 area. Wow. This thing is getting airborne! What a trillion $$’s back to the corporates will do, eh? So, so, so much pricing in to do.
The next important signan from the market will be a push higher in VIX in concert with market price. Until then, more sideways to upwards price action probably continues. Still anticipating one final spike down in VIX with hammer or lomg lower wick. Have a great day everyone!
Bought March 10.00 strike VIX calls for 3.00 even. A bit pricey but they are probably not going to get any cheaper….1/2 full bore…
So what are you thinking with that position?
Back to “old man’s” range 24,808 to 24,899 on DOW. I think the 6th time.
I have an open order to buy remaining half at limit of 2.75 or less in case price goes a bit lower. I don’t think it is going to happen. I did not post another VIX trade I made as it goes against what I generally recommend in terms of expiration window but I also picked up a few speculative VIX 10.00 strike calls expiring next week for 0.70 apiece on the thesis that VIX under 10.00 is cheap.
Even if we are starting an impulse up I think it is going to be terminal and I expect volatility to diverge on the final move up. Even if we make a new 52 week low I don’t expect VIX to remain below 9.00 for an extended period.
Bullish sentiment now at at all time historical extreme.
I do realize the caveat I give with regard to bullish expectations based on an absence of certain technical signals (such A/D monthly divergence) should apply as well to bearish signals when we consider we are at a historic top none of us has ever before witnessed. We have no idea what to expect from indicators at this unprecedented juncture.
While I know some folk disagree with my viewpoint on price mean regression, I am going to up the ante on that thesis with a corollary.
The kind of extremes we are seeing time-wise, are now starting to strongly suggest that we are going to see MORE than regression TO the mean, but regression THROUGH the mean. This is not a matter of opinion but of mathematical certainty. Of course this could happen both via price distance as well as time, so we do not know exactly how the regression will unfold. It could happen swiftly with massive distance over a short period, or a longer period with shorter distance. Technically, it COULD take place with price remaining at current levels for an extended period. Interesting times indeed!
I am also thinking DJI 25,000.00….
The super low VIX (again) is just too attractive, thought I’d join this party too: bought a few Feb 10 vix calls strike 10. The 2 is going to happen well before Feb 10, and when it hits, I’d expect at least a little profit there.
Looking at a nice return on SPX short put spreads from last Thurday/Friday. Thanks to Kevin solidifying my confidence that the move down on Friday was just a smokescreen! I ended up adding to my position at the close.
I am firmly behind Lara’s hypothesis that this sideways move is a 4. Volatility, breadth, and international markets all strongly support this view. That being said, the channel still hasn’t been breached, so another move down is not out of the question. However, my money is on the brea to ATHs happening sooner rather than later.
You’re welcome Bo. I chuckled a bit over all the discussion of Friday’s little push down indicating “market top”. I encourage everyone to study Lara’s material on the historical indicators of market tops. They aren’t anywhere around at this point in time. And of course the economy/market just got some rocket engines strapped to the little VW bus, and you know how those stories go. For awhile, the bus goes fast and far, and yup, it’s just starting to build up speed. Could go a ways, could get airborne! In the end, the wall of the canyon is waiting, but it could be several years until that impact.
Looks like we will get an inside day so probably a bit more downside ahead before the uptrend resumes. I’m outta here. Have a great rest of the day everbody!
Raising bid on VIX 10.00 strike calls to 0.90…
The sideways triangular movement of the market recently is designed to whipsaw both bullish and bearish trades. Mid and longer term trades positioned with the trend is one thing. I guarantee the market makers will eat you alive if you don’t take quick profits on short term trades in this environment. This is what triangles and diagonals are designed to do and you simply have to scalp the moves. But what do I know?! 🙂
I certainly could be mistaken, but why anyone would be entering long positions with the size of those down side candles is quite a mystery to yours truly…as I said, I COULD be all wet! 🙂
Here’s four reasons: the long term trend is UP. The intermediate term trend is UP. The short term trend is UP. The wave count calls for a 5 here, which may have already kicked off. “The preponderance of the evidence” is a pretty good reason.
Yep. It does look like a 4 triangle. Short term trades will continue to be whipsawed nonetheless is the point I was making.
If we have some kind of triangle still unfolding, we are going to get at least one more manic spike up with a corresponding VIX spike down…get ready….!
Yowza! They continue to short vol futures with yet another SVXY 52 week high today. Will add to 130 puts on move back below 130 to lower cost basis.
Selling DIA Jan 5 248/249 bear credit spread for 0.55. Will buy back 249 strike calls if we take out today’s high…
VIX… I still don’t get it, Markets well off highs… yet VIX near low of day.
???
Nothing new. Sentiment remains at historic bullish extremes. No complaints from me as I am hoping it gets even more extreme….
Raising bid to 0.75. I am confident the spike down is coming. They keep trying to hammer it down around this 10.00 pivot… lol!
Thankfully, I was able to move stops just now to break-even in UPRO, XIV, JNUG trades.
Gotta take profits quickly in this crazy market dude. NEVER leave profits sitting in the market as they are likely to disappear like a morning mist on a hot Summer day…been there done that…trading is war!!! 🙂
No, you don’t. Trade your plan.
That IS my plan! 🙂
Wait…you did not ring the register this morning??!!
My comment was for Curtis, and yes, I did, per MY plan. Curtis should trade his plan, just as you trade yours. Your advised exit strategy might be very incompatible with his overall plan. Your outlook of the market that drives your exit strategy might be different than his. Etcetera. Hence, my comment: “trade your plan”. It’s hard enough to do (in my experience) without being told to do things (somewhat arbitrarily) differently. Just my $0.02.
Chill dude…just saying no one goes broke taking a profit, and I don’t care how good a trader you consider yourself to be…in the current market that is good advice…
Opening “stink bid” on Jan 17 10.00 strike calls for 0.50.
I am expecting another manic spike down that will once again be scooped up by deep pockets going long vol mid and long term. Easy peasy….when these bids get fillled they go in the money in a matter of literal minutes. I think it is the algos that are biting… 🙂
I’m taking the money an running. Unloading remaining stake. Better opportunity with another possible VIX move below 10.00
Selling half DIA 248 strike puts for a quick double. Holding remaining with house money…
Key decision points for the Y wave in progress. I strongly suspect the low will be in the 2671-2675 cluster. If it pushes below the 62% at 2668.5, then I’ll watch for a turn at the 2662-2665 cluster. Then 100%, then 127%, then 1.62%…
While it appears at the moment the Y wave is complete with this big gap up opening, I’m not convinced. Isn’t a WXY a combo where W and Y are corrective waves? In which case, W was probably a flat, and Y is incomplete, and is perhaps setting up as a 5-3-5 zigzag? So, be aware there could be another sharp leg down to complete the Y.
Thanks for pointing that out
Sold short term longs earlier and will start adding back once this correction is over
Happy New Year to all!
Nimble trading! Good call by Kevin and Curtis. I added short trades at this morning’s high. Those down candles suggest the banksters are in a real dogfight to keep prices aloft….lol!
So much for that theory! Fireworks to the upside to start the New Year (is anyone really surprised??). Apparently the Y down on Friday was an ABC correction not an impulse, and it’s off to the wave 5 race upward now. That said…the 2 should be coming “soon”, a chance to climb aboard gracefully.
A lot of resistance up here the ATH. And a turn at the Dec 21 high. And a 2 back down “due”. Okay, I bought some SPXU…back to new highs for the day and I’m wrong and out.
Outlook change. Took a $ or two profit in SPXU and shifted over to the long side in INDU via DDM, at 24750. Working so far…
Thanks for your input Bo and Curtis – best to watch out for the relevant invalidation points
Good article Verne.
Does anyone else view Friday’s change in direction as the start of a trend change as opposed to the end of wave 4 as posited by Lara?
Good question, Nick. I’m with Verne on the long-term view that CBs will eventually fail to keep equity markets aloft. When that moment finally arrives markets won’t merely correct, they will implode. Until then, however, I’m willing to trade with the trend. So I took a cautious long position last week, expecting a 4 to be nearly over and an upward 5 to commence soon.
But oh my goodness… Friday’s swing down was mighty fierce, with a huge volume spike! Four reasons I suspect it might be a c-wave to end a 4:
1) The rapid plunge occurred during the final half hour of the final trading day of the year. That tells me it could have been driven by last-minute profit taking and/or automated portfolio rebalancing. 2) It seems to fit the character of a c-wave. 3) On a one-minute chart, it looks like it might be a complete, or nearly complete, 5-wave impulse. 4) Lara labeled it that way.
I might be wrong, of course. If so, I’ll exit my long position with a tolerable loss and wait for better clarity.
I agree. I will surely rue my words but I also think this is a 4. Just my 2 cents worth! Last December saw a 40 point weekly drop. The Santa rally seems to have been replaced by the Santa selloff.
Well, that didn’t go quite according to plan, did it.
Still this looks like a fourth wave. Which may be done here, or soon.
When the green Elliott channel is breached to the upside then it would look very much like the fourth wave is done.
Is it possible that the market corrects 10% of its peak just like the end of December 1999 going into the new year before the rally continued to its peak.
It took the first 2 months January , Feb in 2000 of correction, before the market finished off its final leg to the upside.
5 – 10% correction?
Besides people will be selling in January to take advantage of the tax cuts.
A most interesting analogy Eric, which on its face seems entirely plausible.
There is a very big difference between 1999 and 2017 that I think is important.
The distorted interest rate environment artificially maintained by central banks for the past ten years has permitted the inflation of an asset bubble unlike anything ever seen in the history of markets. These low interest rates have permitted unprecedented leverage and access to easy credit which have in turn fueled this debt-based asset inflation. The banks have then tried to hide their malfeasance by artificially suppressing volatility, which under normal circumstances would warn market participants of the true levels of risk now present in the market because of these central bank policies. The recent claim of the “Perfect Year” is not entirely accurate as markets did see a slight decline from the February to March closing tick, but it was pretty close. That is no accident. This market CANNOT correct. If it does, it will very quickly expose the underlying fragility of the current situation as we see an erosion of the value of the assets underlying this monstrous debt fueled bubble. The banks are hopelessly trapped. It is even more mind-blowing that there is so little discussion of this situation anywhere! I am not even going to address how little of a market decline it would take to force the unwind of the gargantuan short vol trade, another different scary ball of wax all-together.
The bottom line is that any market decline of more than 3-5% at ANYTIME in the future will be taking place despite the efforts of central banks hell-bent on preventing it as their very survival depends on doing so. I know some folk are going to dismiss the view as alarmist and perma-bearish. Perhaps. I could be wrong. I have said it before and I will say it again. This market is not going to correct. Bubbles do not correct, they burst. While I don’t know how long they can keep the party going, I know with absolute certitude how it is going to end. Caveat Emptor!
All conceivable scenarios are possible, but the situation isn’t even remotely similar to 1999. The returns from 1995-1999 dwarf those of the last 5 years (impressive as they were). The NASDAQ was up 86% percent in 1999 alone! Volatility was also much higher.
IMHO there are simply not enough divergences for this to be a significant top. Breadth and volatility need to spend a little more time lagging behind before we can say there is an opportunity for a 10% drop.
I must say I have to smile everytime I hear someone comment about what one indicator or the other has to do before we see a market top. While I understand the reference to prior market history, those assertions only serve to reinforce in my own mind, how incredibly inattentive folk have become to the current unprecedented extremes we are witnessing in the market. I have cited many of them ad nauseam and will not repeat myself. The one thing I have not mentioned much and which absolutely no one considers is outright financial fraud. I will give a simple example. The fracking industry has not had a single positive cash flow year since its inception. They could not do it when oil was over 100 per barrel. Does anyone think they are doing it now? Conservatively 300 billion in bonds have been issued to finance this sector. As hard as I have tried, I cannot find loss reports anywhere! Same for PR bonds, same for Venezuelan bonds etc. etc. What am I saying? Have people ever cosidered that those numbers we read every day in global indices, possibly, just possibly, could have little to do with the financial reality of the assets they are supposed to represent? Oh, I forgot, they did adjust “mark to market” guidelines to permit LYING about the true worth of assets did they not? What is going to be truly laughable is when all the talking heads start whining about how no one saw it coming….be careful out there….
I wish both of you the best of luck, but you may want to take another look at that bottom trend line of the triangle fellas…. 🙂
(futures also was a big hint of what was on deck)
Looks like an overshoot to me, Verne. But something else might be afoot. Futures are looking mighty ugly at the moment (less than an hour after Friday’s close).
Silly me, I trade actual price action during regular market hours, but I always trade with prudent stops in place. We’ll know more Tuesday.
Happy New Year to you and everyone else here!
Figures…
VIX goes crazy after 4:00PM and closed at $11.04 just 2 cents off the high of 11.06. 11.04 close is now above both the 100DMA of 10.72 and the 200DMA of 10.96
If you buy under ten and give yourself at least thirty days out Joe, it has been a 100% profitable trade for the last two months. I feel like a broken record…. 🙂
I did but sold early today because it wasn’t going anywhere and I didn’t want to get hit with the late Friday smash.
Instead today you get ~ 55+ from 4 to 4:15PM
4:30PM+ session futures getting smacked!
Don’t be too discouraged. It took me a long time to learn to patiently ignore the static when it comes to trading volatility. They play a lot of games with short term price action but once you identify the current “cheap” and “expensive” levels, you can trade with confidence. I was really smiling as they ripped the faces of weak long positions last week at Wednesday expiration with that spike down to 8.95.
I have watched these cretins pull this kind of crap for years, so you can imagine how irritated I get when people keep telling me: “Dude, there’s NO MANIPULATION!”
With that move down below 9.00 the most counter-intuitive thing to do was step in any buy 500 10.00 strike contracts. You see that long lower spike?
That was me and a few friends!! O.K. now I know I have already said too much and the SEC goons are going to come knocking….again!!! 🙂
I agree with Kevin (below). Today’s price action looks to be: top of (d) this morning, (e) currently underway. Upward breakout looks likely next week. I am positioned accordingly, with prudent stops in place.
Getting a bit long myself here Curtis.
Sometimes these “triangles” turn into rectangles before they are done. I’m looking for bounce/turn signals at 2676, but being careful, as “the 4 could grow”!
Might consider adding a wee bit Tuesday AM if we don’t see a giant gap up.
Yikes! Nasty swing down at end of the session nearly took be out! Hopefully that was just an overshoot for (e). We shall see…
Adding SVXY Jan 12 130 strike puts for 4.85…
Target 115 for SVXY…
We are going to probably get a decisive move before the close. Executing a SPY strangle expiring today. Bought 266 puts for 0.06 and 267 calls for 0.12…just for -you -know what and giggles…
Correction, SPY 268 calls…
Totally unrelated topic to current postings.
The small rural town I live in has been growing in the past 14 years I have lived here. When I arrived the population was about 13,000. Today we are about 17,500. The next closest town is about 30 miles away. Beyond that, one must travel 90 miles to a town of larger population. So, business investment in our neck of the woods is relatively small compared to the rest of the world. We are an agricultural and forest products area.
In any event, in support of the theme that the USA economy is growing, a nationally based food processing company announced they are investing $250 million to the local plant they operate. That is huge for us. The next largest development we have enjoyed was a $75 million school district expansion about 8 years ago. This theme is going to be repeated countless times throughout the USA over the next few years/ As I said several days ago and hope it will be true, “Happy days are here again.”
Happy New Year to you all. May 2018 be a blessed year for you and your families.
I am totally spooked by this. I was long on anticipation of the triangle exit and had a contingent order to sell at SPX 2700.00. When ES got to around 2698.00 and violently reversed I immediately smelled a rat…these kinds of quick reversals out of triangles suggest a terminal wave…I exited SPY 267 calls with a much smaller than expected profit.
Looks like banksters are running amuck…
Yep. There are some neat fib relationships with a 2017 top.
I plan on exiting all longs except credit spreads by today’s close. Looking for good vol re-entry via VIX.
So is the VIX very dead again? Totally sleeping at the moment.
I am out of it again… I thought it would pop into the last 2 days or so. This trade is very hard to figure out. I am done with it for good.
VIX is a tough trade. The key is to catch the extremes and take profits immediately as they materialize. The claim that it accurately reflects SPX put call ratio is the biggest pile of cow manure in the trading barn. It probably is THE most artificially manipulated trading metric, and trading it is literally like going to war against a whole host of market scounderels. Long volatility at least 90 days out is a set-it-and-forget-it no-brainer trade. Trading short term vol successfully requires both skill and methodology- definitely not every one’s cup of tea…
VIX reflects the SPX put to call ratio???? No it doesn’t. Here’s the language right from the CBOE website:
“The Cboe Volatility Index® (VIX)® is based on the S&P 500® Index (SPX), the core index for U.S. equities, and estimates expected volatility by averaging the weighted prices of SPX puts and calls over a wide range of strike prices. By supplying a script for replicating volatility exposure with a portfolio of SPX options, this new methodology transformed VIX from an abstract concept into a practical standard for trading and hedging volatility. In 2014 Cboe enhanced the VIX Index to include series of SPX Weekly options. The inclusion of SPX Weeklys allows the VIX Index to be calculated with S&P 500 Index option series that most precisely match the 30-day target timeframe for expected volatility that the VIX Index is intended to represent. Using SPX options with more than 23 days and less than 37 days to expiration ensures that the VIX Index will always reflect an interpolation of two points along the S&P 500 volatility term structure. ”
So it’s the PRICES of puts and calls on SPX, not the RATIO of puts to calls on SPX.
Manipulating it would require somehow manipulating the sellers of SPX puts and calls to adjust their prices. I guess if you floated A LOT of options yourself with odd pricing…maybe??? Seems doubtful, to me.
*SIGH* Market makers collude by agreeing on bid/ask option spreads. Black-Scholes models do not account for bids BELOW intrinsic value. Why do I bother??!! If you don’t trade options, you simply don’t know what you are talking about.
Perhaps they do. Micro level “collusion” re: bid/ask spreads isn’t going to drive the VIX value (the price of SPX options) in macro ways, however. Price action does that. Though I do agree that conspiracy theories can explain everything, are often convenient, and always entertaining.
Meanwhile, here’s the E wave of that triangle. Manipulated or not, I’m going to like XIV if/as the bounce develops.
Last Trading day of the Year and the LAST day for the “Old Man” to stay within the “likely Top” DOW range and “Likely Time analysis Year” of “2017”.
So today should be interesting in that respect.
“Likely end of throw-over per “Old Man” is in a 91 point range 24,808 to 24,899?
2017 is time analysis top call.
So right now as it has been in and out of that 5 trading days… Today will be the 6th and closest or around 24,899. Right now both met and tested well!
So we shall see if it turns here and confirms by going below LINE, the low of Thanksgiving week… 23,360. Or will the next in the range targets will be tested? 25,114 …. 24,899 to 25,114 anything in that range will be acceptable. Top Today still within “Historical Norms” other than today “surpasses historical norms”.
The other “crazy” ranges are not “Likely” but do have a calculation to get there. But that would mean “DOW trading exactly like a commodity”. “Outrageous” .
Anything over 24,899 is considered “surpassing historical norms” just to be clear.
Happy New Year to all!
Interesting NOTE: Keven Oleary who is on CNBC this morning said… there are only 357 Companies on the Russel 2000 that will have enough earnings in 2018 to get an advatage from tax reform in 2018. “Don’t forget you have to be Profitable to have an advantage with Tax reform”. He knows and I quote “I did the work on this”.
“People who just buy the Index of 2000 stocks (RUT) to tax advatage of a tax reform trade aren’t going to have the advantage they think they are going to have.” I would assume that goes for every index out there.
Because it is very true, for a 2018 advantage you must alredy be a profitable company! I don’t believe that many understand this!
This Tax Reform on the bussness side will be great for building a strong foundation for future economic growth!
Also: Many Companies with large overseas operations are going to have onetime hits to earnings with the Business tax reform but I am sure they will hide it in their Pro-Forma reporting. GAAP earing should be the only numbers reported in Headlines and all… with Pro-Forma disclosed as a footnote. Ratios using just pro-forma numbers are distorting reality.
Per Zero Hedge article:
Goldman Sachs warned on Friday that it expects a $5 billion hit to Q4 earnings as a result of tax reform signed by President Donald Trump last week, approximately two-thirds of which is due to the repatriation tax.
I guess that explains GS sharp opening move down. I picked some up very near the morning low. Don’t know if it’s going to hold though (BE stop in place). Also in ICE which has opened gap up and that gap is holding so far. Got a bit of the “holiday rally” but appears to be no sustained buying pressure and the traders are rapidly selling it off.
GS took me out BE and appears to be heading towards it’s 1.27% extension downward, around 252-253. That may be an excellent zone for loading up on the long side, after some buy triggers, IMO.
So a $5 Billion Hit to earnings, that will be reported in January doesn’t phase you at all? Even when compounded many times with all the other disclosures that will be coming to light from many others? What if most are pre-announced in the 1st few weeks of January and then again when actually reported.
I’m a short term trader. Doesn’t bother me a bit. I trade price action backed by wave count, not fundamentals. The more I “know” about what the market “should do” based on talking heads, external claims of “data”, etc., the more badly biased I become. Even listening this this board sometimes compromises my objectivity. I try to view “all that” as merely entertainment, not information. The information I use for trading is wave count and price action, period. Or at least, that’s what I strive for. It is hard to not be biased!
BTW: For those 357 Profitable Stocks… If they have gone up since election day 2016 big… I firmly believe that for 2018 and only 2018 the Tax Reform is already priced in. If they have not moved much for that period… then that is what you buy for the Tax Reform Trade.
BTW: Very interesting how the specific company effects of Tax Reform in the RUT Russell 2000 coming out today + Goldman and I am sure many others is timed perfectly with the “Old Man’s Likely Top range and time range”.
I don’t believe in coincidences like that in the larger power of the mathematical and cycle universe. EW’s are certainly part of that and “Old Man” wrote the books!
So we shall see how it plays out here and in Jan.!
Do all these extremes in everything get adjusted as this all sinks in?
God Bless to all and Happy New Year!
I don’t know much about nothing. Except, a bit of elliott wave. And the market is entering the “end days” of the grand supercycle. So we are going to get a larger and larger (in price, and in time) series of 4 waves, each followed by a 5 wave pushing back up to new highs. Volatility will swing wildly…but I suspect will on average trend back upward to more historic norms. Many will call the “market top” as each of these larger 4 waves gets started. And they will be wrong. It will all be a bit “abnormal”, because the market has never, ever been in this position in the macro level wave count before. So all the pundits who predict based on their fine experience and the norms of the market are generally going to be wrong. Lara’s historic analysis of macro market tops should help up identify the true ultimate top. My $0.02, worth less!!
That’s what I’m thinking looks likely too. If this is a Grand Supercycle trend change coming up, then it’s not within living memory.
Unchartered (uncharted?) waters LOL
Good points Kevin. I agree it could be a mistake not to recognize how unique the situation we are in is. We do tend to be creatures of habit, but it well might be a time to begin expecting the unexpected… 🙂
Hourly chart updated:
So far the small triangle for minute iv looks good. It may be close to completion.
Yes indeed!
Break upwards from triangle underway towards upside target. These are “bread and butter” patterns people. Not too often you get high probablility trades to beat the market makers. Long via SPY 267 calls as we head to upwards target.
I can make out an A-B-C-D (just completed this morning), leaving an E to go (which is often only part way down?). I do see a 4 wave consolidation range from Dec 18 to now, and a lot of gobblygook price movement within it. I’m not convinced of anything really until the range is busted out of, one way or the other. I would expect an “E” to come lower before a move up and away. I continue to be suspicious that rocky politics in the US is not going to allow this market to rumble in Jan. Could be wrong!
Here’s how I see the 4 wave triangle at the moment.
Thank you, Lara. This is very kind of you! But seriously, get back to your vacation!
Don’t worry, I’m vacationing. Got some surf on Christmas Day. Spending most of my time at the beach.
If (when) the SPX starts up again, I believe XIV, which has pushed for a few weeks against resistance at 136-137, will blow to the upside. It could be had for 105 in early Dec. I see 150+ coming pretty soon, assuming the current main plays out. The price volitility makes its a very efficient means of making (or losing!) money quickly. The nominal inverse contango of the futures market its based on gives it a continuous upward push at an extraordinary rate. If you know gambling theory, you know how incredibly valuable that is. +4% a month. That’s just nuts. Sure it has dangers (when the market tanks it’ll go down monstrously). But for the quick and nimble working in tune with the EW…I like it. A lot.
It might. A really bearish sign would be if it starts to diverge from SPX on fifth wave up. It would confirm that this move out of the triangle is terminal.
Hi Joe, let me know what you think of this:
https://www.zerohedge.com/news/2017-12-28/yield-curve-crashes-10-year-lows-trader-shows-how-put-steepener
I don’t have enough time to focus on what they are saying… I basically gave it an overview read.
IMO: The 10 Year Treasury is the most manipulated maturity. I don’t trust it’s signals.
I would look to the 30 Year only for the signal. Now at 2.763%… I am thinking about buying a short the 30 Year type thing in early January.
It’s possible that 2.70% could be tested again in the next week or two. For a trade… if it does do that, going short 30 Year is worth a shot.
3.26% is what the 30 Year needs to penetrate and accelerate higher… which would signal a real tread change in longer yields.
You actually hit the nail on the head. I was exactly wondering about the reliability of the 10 year yield signal. Thanks.
GS is getting close to it’s major support around 254.50, and I will be looking for and jumping on buy triggers from there for sure. In fact, I’m looking for them from here forward; it’s close enough in my book. I see GS ranging all the way back up to it’s recent highs at 262 and maybe beyond.
Also, I really like CCK right here. Sold off hard and turning, low risk stop just below, tons of room to rally above.
VIX is slowly moving higher… kind of an under the radar move.
Price of Silver inching near $17 … AG should benefit from that & higher.
That “sneaky” VIX move put my XIV position under water…so I tripled down, and now at opening I’m nicely in the green with an break even stop in place. Sometimes ya just gotta do it!! And today is looking bullish, so perhaps there’s some coin in my immediate future.
Overall, the 38% retrace continues to hold, and and the market is opening up a bit. I’m still hoping for a end of year/holiday rally today/tomorrow, with a launch of wave 5.
Took my XIV pretty close to the top this early morn, before this market down move started, sweet. A good buy-back should present itself sometime soon, today or tomorrow.
Meanwhile, took a very small bite of XLU, which has pulled back a ton and appears to possibly be turning at a 100% pullback fibo. If it starts trending up at all, I will add. My stop is right at the recent low, a whopping -0.7%. I love stops at less than 1%!!!
Took some TBT, no stop, will add if it moves further down towards it’s longer term floor. Also took some JPM with a very tight stop. That one is speculative, but it’s acting strongly bullish despite the market going sideways/down here. I was in NFLX yesterday, got underwater, it shoots straight up and stalls right at my BE so I count my blessings and exit…and it’s just gone straight up from there! Oh well, can’t win ’em all.
Just in case anyone is here and interested…12/27 and market is holding above a 38% retrace at 2678, and moving up with a little authority. Possible the 4 is over but still uncertain. If the 38% fibo gets undercut, then if the Dec 20 lo at 2676 gets violated…I’m bailing immediately on any remaining longs, and possibly looking to short. I’m still suspicious we’ll get momentous political things happening in the US by week end, and if that happens, the markets will almost certainly roil big time. But for the moment, I’m slowly establishing longs for what “should” be the coming 5 wave up.
Some positions I like: NAIL, XLV. Both are on the move and appear they may really rock if/as the 5 wave kicks in. I also like SQ in the tech space; solid consolidation range/support.
Kevin,
Thanks for the analysis….please keep it coming!
Mike
Thank you Mike, I’ll try to. Another slow and sleepy day really in the market (probably low volume too). Though I note the rather strong performance of RUT. Overall, signals are bullish I’d say. The SPX action can’t be called impulsive yet, it appears to just be more wave 4 ripples.
Maybe the market is tired
I think everyone is tired with 2017, one of the most “interesting” years in US history by my reckoning.
Anyway, I’m seeing a rather large barrier triangle forming in RUT, and it appears to be doing an “E” leg now. The triangle was entered from below; it “should” break to the upside (though a fake out move down a bit then taking off upward could happen). That should coincide with a launch of a 5 wave in SPX, would be my guess. Not likely today, but perhaps there will be a “holiday rally” on Thursday and/or Friday. Keep an eye on RUT.
Fascinating end of year rotation out of tech; nice day to NOT be in the FAANG stocks!!
VIX on the move this morning.
I posted this on the 20th and so far seems to be following past scripts (as to the range and trend during the two weeks ):
{BTW: I looked back 3 years on VIX and next 2 weeks pretty volatile.
2016: Week Starting:
12-19 H 12.52 L 10.93 C 11.44
12-26 H 14.68 L 11.84 C 14.04
2015:
12-21 H 20.21 L 14.45 C 15.74
12-28 H 20.39 L 15.63 C 18.21
2014:
12-22 H 16.88 L 14.01 C 14.50
12-29 H 20.14 L 15.06 C 17.79}
I like XIV here myself. Bought a fair amount; will add a lot more if it falls. It’ll recover very strongly as this 4 ends. +4% per MONTH trader’s edge in XIV, hard to pass up.
#4 with a bullet!
Merry Christmas and Happy New Year to all EWSM members and its great leader, Lara.
I’ve finished work. Had dinner. And still can claim first…. so for the last of the year I will. Claim FIRST.
Not cheating.
Got some Bitcoin analysis coming soon to a website near you 🙂
Thank you Lara
Wishing everyone a very Merry Christmas and a Healthy and Happy 2018!!
Thank you Lara.
Also, I just went over the RUT analysis you did couple weeks back. Thank you for the analysis. I had one question however, I was wondering if its possible that the primary I of Cycle V could be where you have intermediate I.
I have attached a plot….appreciate any comments. It looks like wave1 have been the ones that are extending. Not sure if thats against elliot wave rules.
Merry Christmas…
Absolutely could be, that fits. Looks pretty good too.
I would rather see that strong rise up to December 2016 as a third wave though, not a first, because of the steep slope and strong momentum.
That’s why I put the third wave label there, because MACD. I use MACD to guide the wave count quite a lot.
It’s entirely within EW rules for first waves to extend.