
The main Elliott wave count expected more upwards movement.
A new all time high adds confidence to the target.
Summary: The target remains at 2,773.
The market is overbought and overstretched at the daily and weekly chart levels, but there are no bearish signals yet at the weekly chart level. Assume the upwards trend remains intact while price remains within the narrow best fit channel on the hourly chart, and above 2,652.02.
A new low below 2,652.02 would indicate more downwards movement to a target at 2,605 – 2,600.
A new low below 2,557.45 would indicate a multi month pullback or consolidation has arrived.
Last monthly and weekly charts are here. Last historic analysis video is here.
The biggest picture, Grand Super Cycle analysis, is here.
MAIN ELLIOTT WAVE COUNT
WEEKLY CHART
Click chart to enlarge.
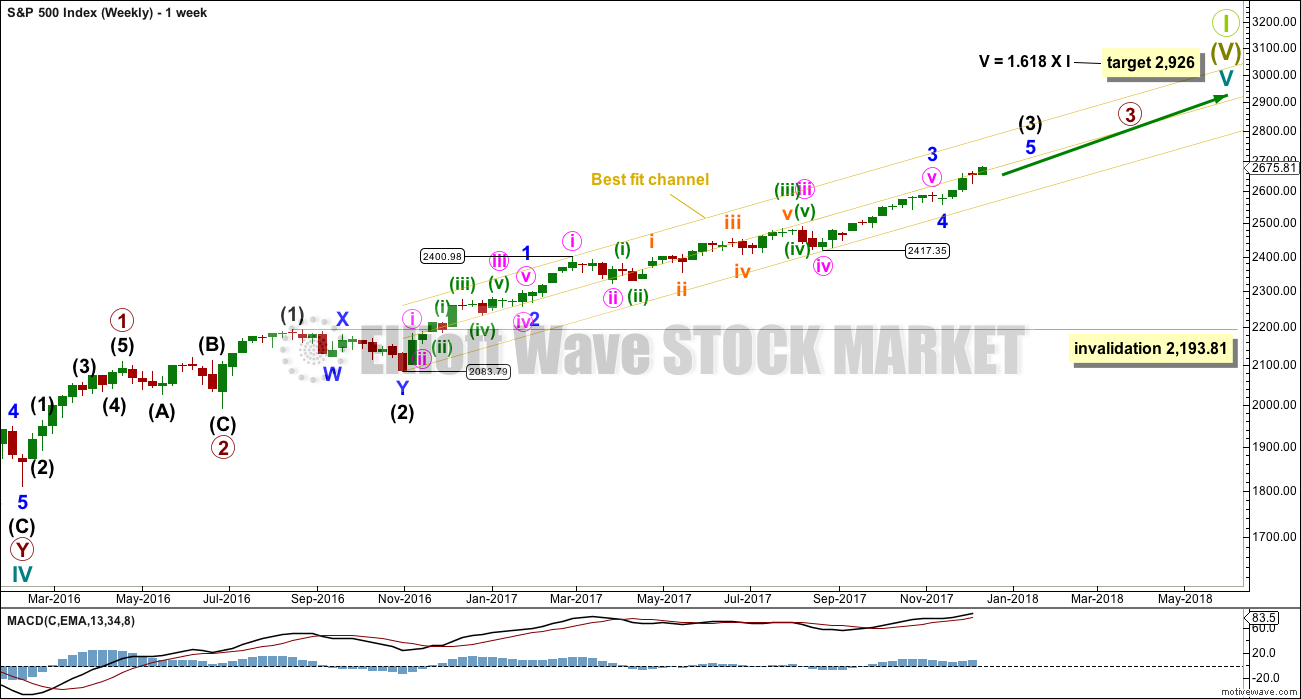
Cycle wave V must complete as a five structure, which should look clear at the weekly chart level. It may only be an impulse or ending diagonal. At this stage, it is clear it is an impulse.
Within cycle wave V, the corrections for primary wave 2 and intermediate wave (2) both show up clearly, both lasting several weeks. The respective corrections for intermediate wave (4) and primary wave 4 should also last several weeks, so that they show up at weekly and monthly time frames. The right proportions between second and fourth wave corrections give a wave count the right look. This wave count expects to see two large multi week corrections coming up, and the first for intermediate wave (4) may now be quite close by.
Cycle wave V has passed equality in length with cycle wave I, which would be the most common Fibonacci ratio for it to have exhibited. The next most common Fibonacci ratio would be 1.618 the length of cycle wave I.
Intermediate wave (3) may now be nearing completion (an alternate hourly wave count again looks at the possibility it could be complete at the last high). When it is complete, then intermediate wave (4) should unfold and be proportional to intermediate wave (2). Intermediate wave (4) may be very likely to break out of the yellow best fit channel that contains intermediate wave (3). Intermediate wave (4) may not move into intermediate wave (1) price territory below 2,193.81.
The yellow best fit channel is redrawn. Price points are given so that members may replicate this channel. This channel is copied over to the daily chart.
DAILY CHART
Click chart to enlarge.
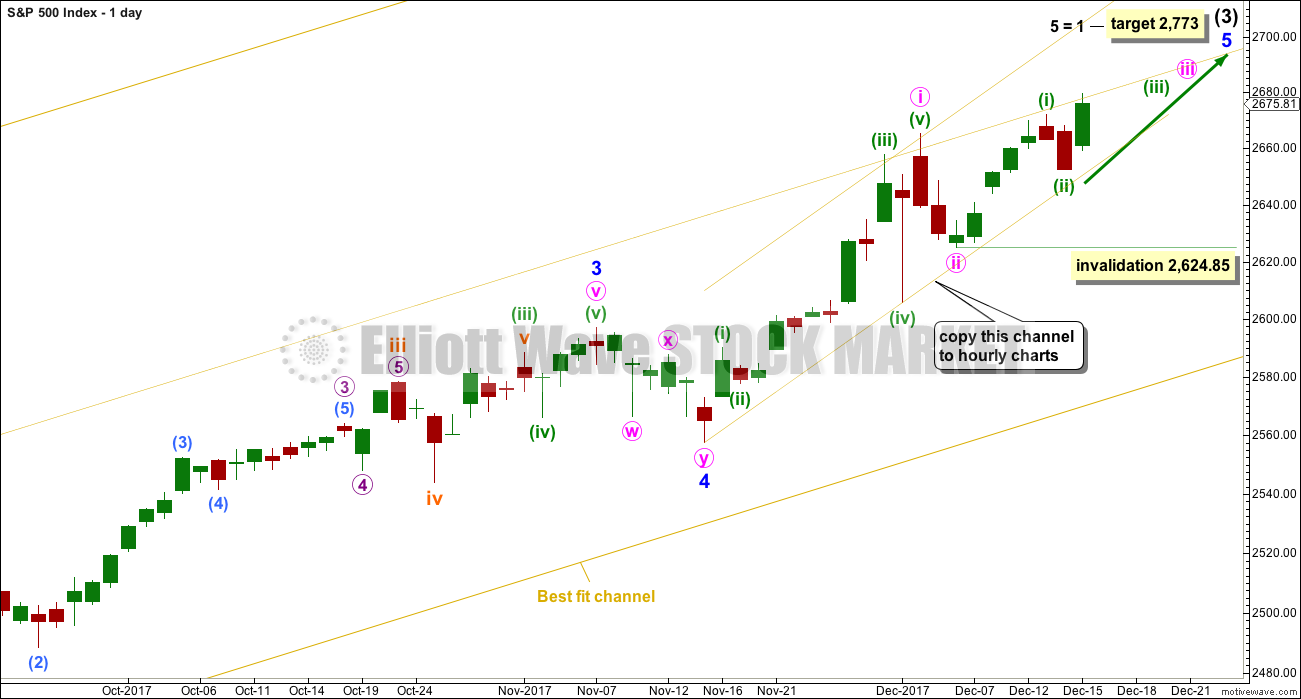
The main wave count will now expect that within minor wave 5 minute waves i and ii are complete.
Within minute wave iii, no second wave correction may move beyond its start below 2,624.85.
The target expects minor wave 5 to exhibit the most common Fibonacci ratio to minor wave 1.
Price is finding resistance about the mid line of the best fit channel.
The narrower channel, which is drawn on the hourly chart, is added to the daily chart in order for members to see how it is drawn. Copy this channel over to the hourly chart. If minor wave 5 is incomplete, then price should remain within this channel.
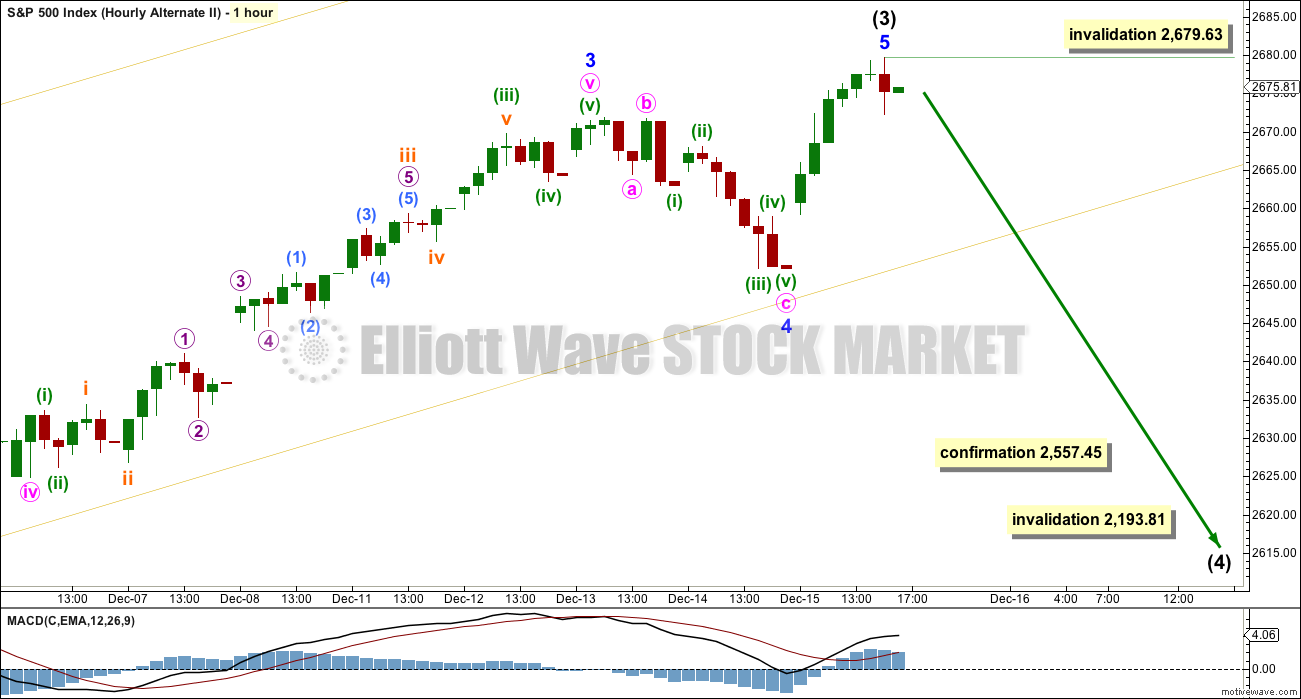
HOURLY CHART
Click chart to enlarge.
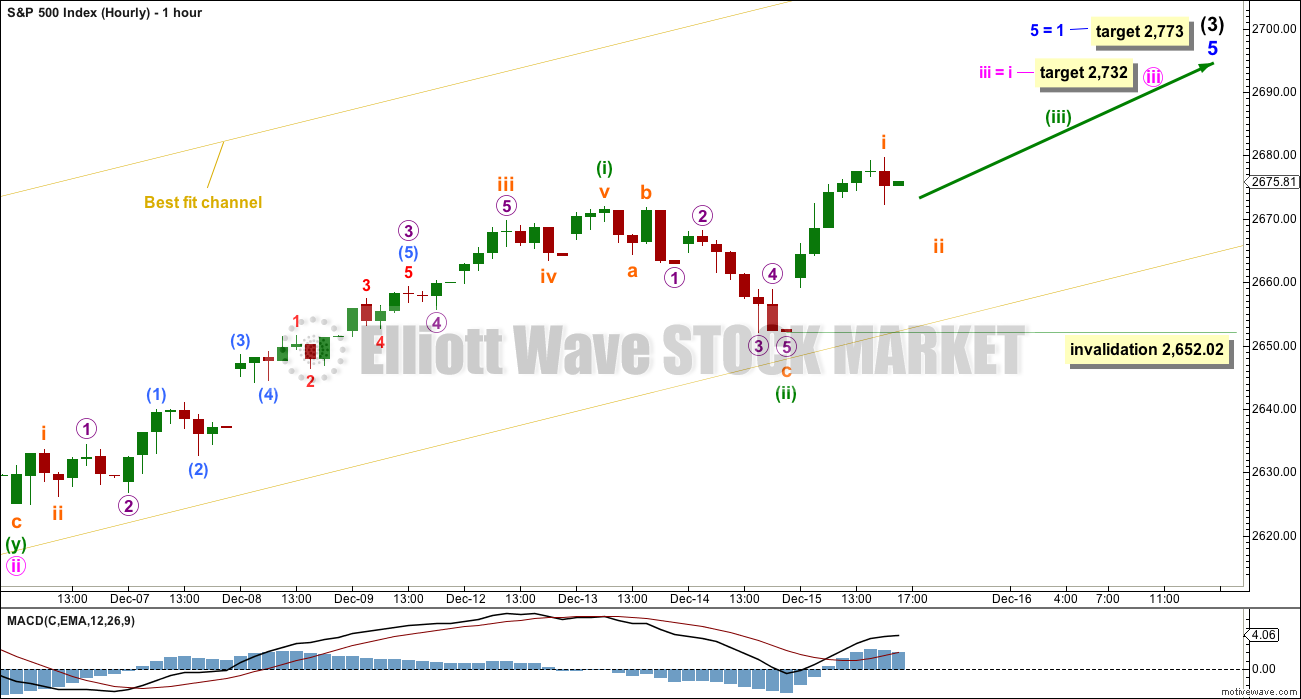
Minute wave iii may only subdivide as an impulse.
Within minute wave iii, minuette waves (i) and now (ii) may now be complete.
The next wave up for minuette wave (iii) should exhibit a strong increase in momentum.
Within minuette wave (iii), the second wave correction of subminuette wave ii may not move beyond the start of subminuette wave i below 2,652.02. This price point is taken from the five minute chart, which sees no truncation for micro wave 5.
If this wave count is correct, then corrections along the way up should find support about the lower edge of the best fit channel. If that channel is breached by clear downwards movement (not sideways), that shall be an early indication that this wave count may be wrong and one of the alternates below may be right.
ALTERNATE HOURLY CHART
Click chart to enlarge.
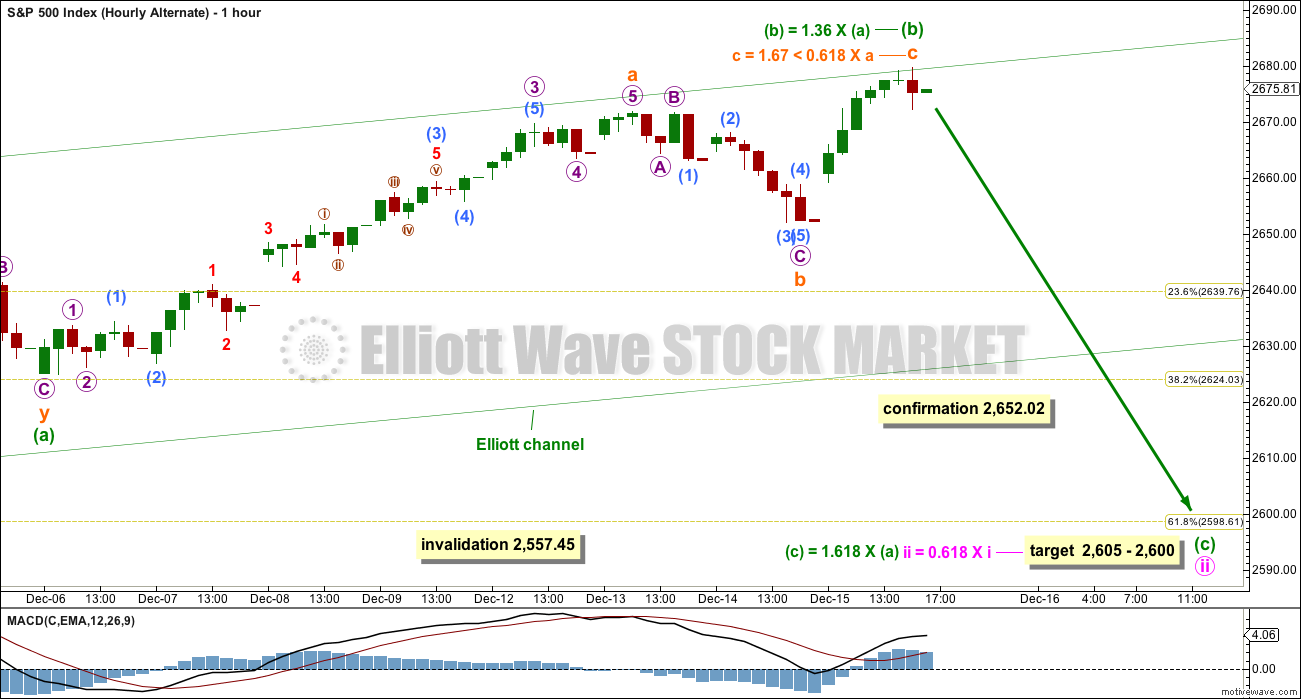
It is still possible that minute wave ii may not be complete and may be continuing as an expanded flat correction.
If price makes a new swing low below 2,652.02, then the target for downwards movement to end would be 2,605 to 2,600. This assumes the most common Fibonacci ratio between minuette waves (a) and (c), and the most common point for minute wave ii to end at.
Minuette wave (c) may last five days if minute wave (ii) exhibits a Fibonacci duration of thirteen.
With upwards movement for Friday, minuette wave (b) now has a better look as a zigzag.
SECOND ALTERNATE HOURLY CHART
Click chart to enlarge.
A more bearish option is still technically possible. It is possible that intermediate wave (4) may begin here or very soon.
A new low below 2,557.45 is required for confirmation of this idea. Only then should it be taken seriously.
Intermediate wave (4) may last about three months. It may be a choppy overlapping large consolidation, or a deep sharp pullback (which may be over more quickly than three months). It should have some reasonable proportion to intermediate wave (2), so that the wave count has the right look at the weekly time frame.
While there is plenty of bearishness in indicators at the daily chart level, there is none yet at the weekly chart level. It may be that a bearish signal at the weekly chart level is needed before this alternate wave count may be correct.
TECHNICAL ANALYSIS
WEEKLY CHART
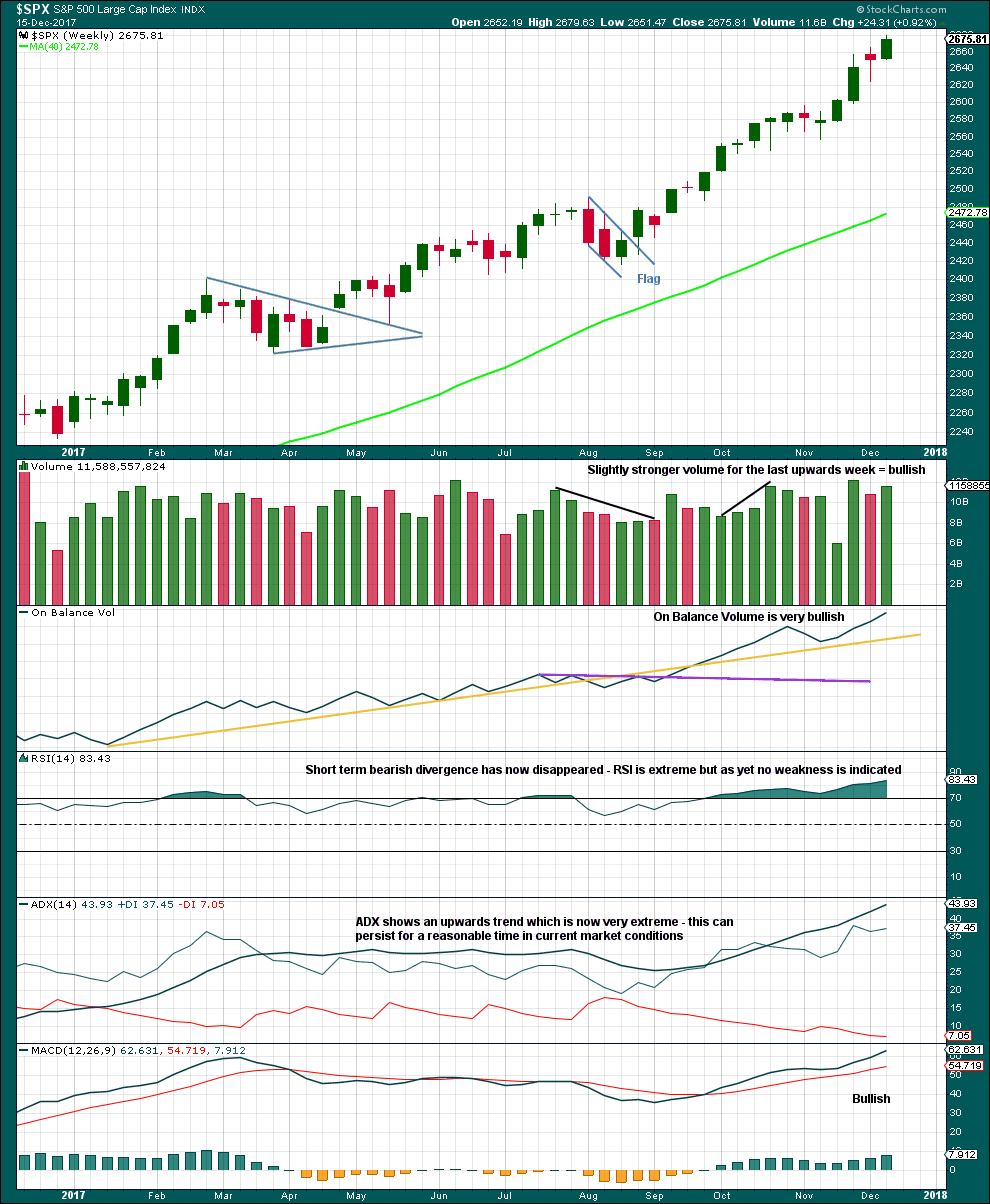
Click chart to enlarge. Chart courtesy of StockCharts.com.
There is still no candlestick reversal signal at highs. The trend is now very extreme and overstretched, but this can continue for longer before price is ready to turn.
Overall, at this time frame, this market remains very bullish.
DAILY CHART
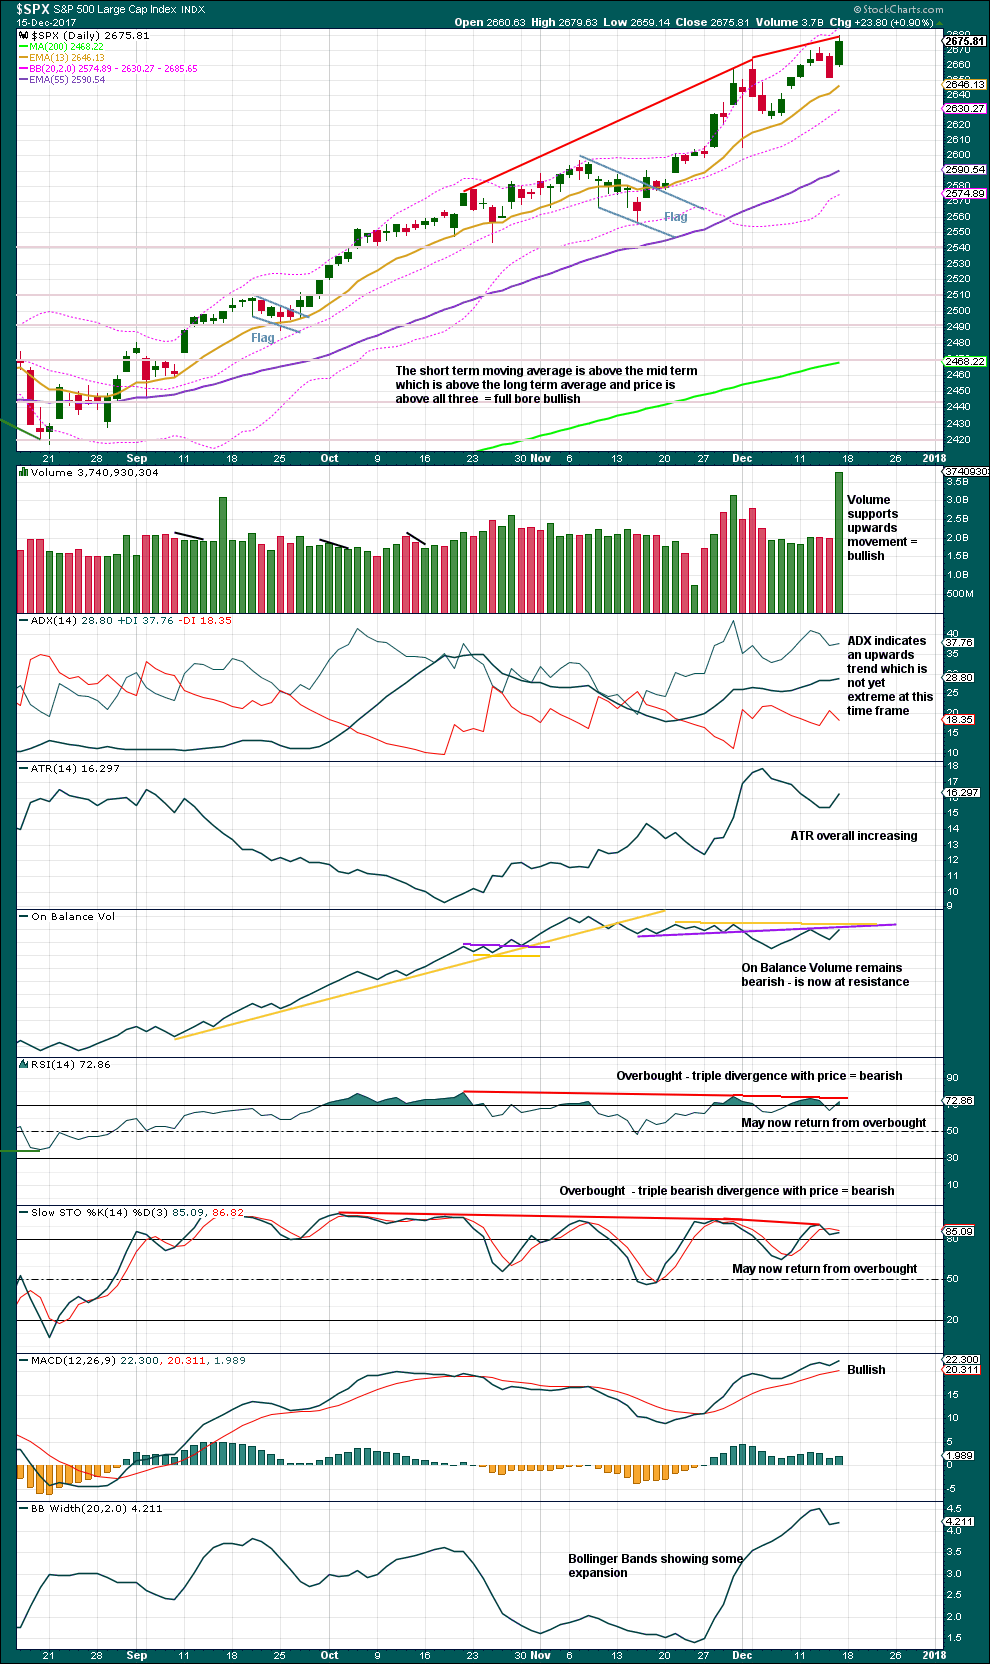
Click chart to enlarge. Chart courtesy of StockCharts.com.
The bearish engulfing candlestick pattern noted in last analysis has failed.
With ADX not yet extreme, there is room for this upwards trend to continue. It is overbought, but that can continue for longer.
There is no reversal signal at this stage.
On Balance Volume is at resistance and this may halt the rise in price for another short term pullback.
VOLATILITY – INVERTED VIX CHART
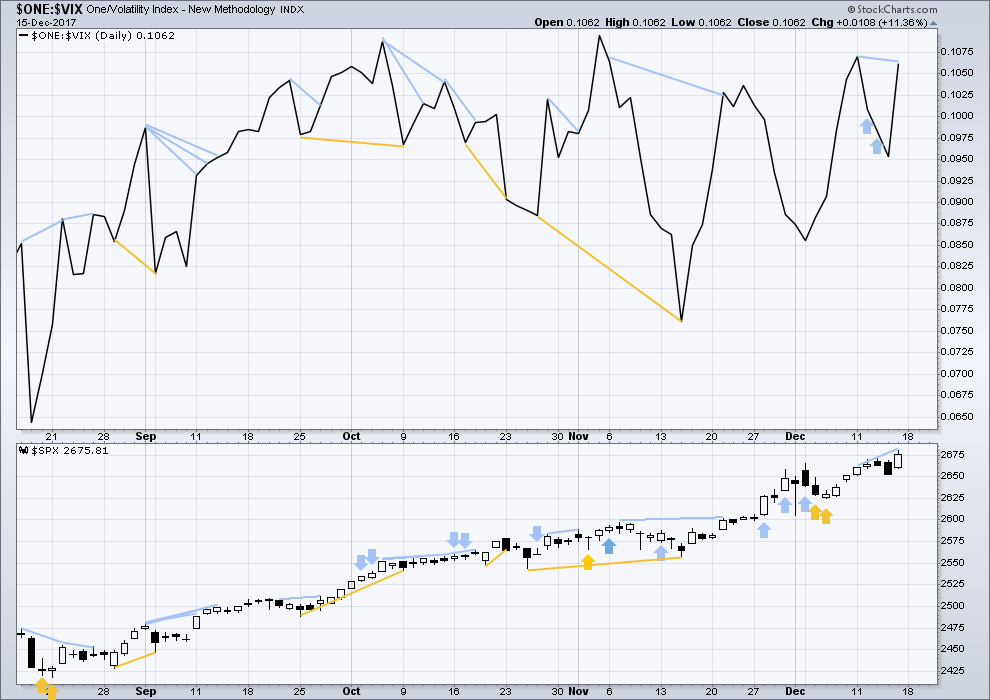
Click chart to enlarge. Chart courtesy of StockCharts.com.
So that colour blind members are included, bearish signals will be noted with blue and bullish signals with yellow.
Normally, volatility should decline as price moves higher and increase as price moves lower. This means that normally inverted VIX should move in the same direction as price.
There is short term bearish divergence between inverted VIX and price. While this supports the alternate Elliott wave counts, it will not be given weight in this analysis because it appears recently to fail more often than it accurately predicts downwards movement.
BREADTH – AD LINE
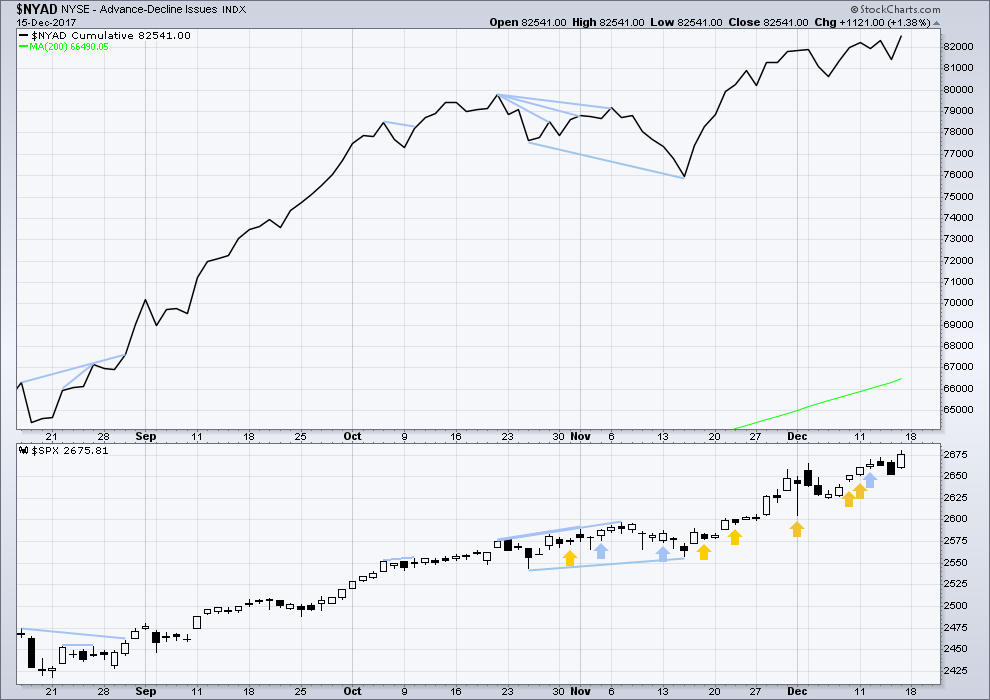
Click chart to enlarge. Chart courtesy of StockCharts.com.
There is normally 4-6 months divergence between price and market breadth prior to a full fledged bear market. This has been so for all major bear markets within the last 90 odd years. With no longer term divergence yet at this point, any decline in price should be expected to be a pullback within an ongoing bull market and not necessarily the start of a bear market.
Only large caps made new all time highs this week. There is some weakness this week with mid and small caps unable to make new all time highs; this is bearish and offers some support to the alternate Elliott wave counts.
Breadth should be read as a leading indicator. The new all time high for price is matched by a new all time high for market breadth. The rise in price has support from rising breadth. This is bullish.
DOW THEORY
The S&P500, DJIA and Nasdaq this week all made new all time highs. Only DJT has failed to make a new all time high, but it has failed by a very small margin. The ongoing bull market is this week not confirmed, but this is a very weak non confirmation.
The following lows need to be exceeded for Dow Theory to confirm the end of the bull market and a change to a bear market:
DJIA: 17,883.56.
DJT: 7,029.41.
S&P500: 2,083.79.
Nasdaq: 5,034.41.
Charts showing each prior major swing low used for Dow Theory are here.
Published @ 9:09 p.m. EST on 16th December, 2017.
VIX trade… has gone back to sleep.
AG:
———
7.54 200DMA – testing now
7.58 previous high… through it today.
7.67 – Breakdown point 8-3-2017
9.59 – last high 4-13-2017
10.92 – high 2-7-2017
19.15 – high 8-10-2016
And up she goes!
The invalidation point can be moved up to the end of subminuette i now. MACD is showing an increase, yes, this looks like a third wave.
Lara can you comment on your use of percentage based targets (equidistant moves on Y axis on your log charts are equal percentage moves, not equal point moves) vs. the value (if any?) of point based targets. (For example, on a point basis, the “1=3” target here is about 2702. You have 2732 because you are projecting 1=3 as equal percentage moves.)
Do you see any value in pure point based target projections, based on your experience?
I am calculating targets manually (old school, I actually use a calculator) based upon points, not percentages.
Minute i from 2,557.45 to 2,665.19 was 107.74 points long. Minute iii begins at 2,624.85.
2,624.85 + 107.74 = 2,732.59.
I just ignore the partial points, usually I round it up or down.
I never calculate targets on percentages.
Are you going to give another update today?
Im a little bit confused on your post here.
If 2732 – 2773 is your wave 3 target
Then what do you estimate the wave 4 low to be?
Thank you
This analysis is once a day. I usually jump into comments to give a quick update prior to NY close so members may adjust positions.
I then wait for data to be finalised from StockCharts, usually happens about 6:30pm EST.
I am preparing the analysis now.
2,732 is for minute wave iii to end. I cannot estimate the minute iv low if I don’t know where it starts. The only guideline prior to a third wave end to see where the next fourth wave may find its low would be the fourth wave of one lesser degree.
That would be minuette (iv). And that hasn’t unfolded yet, so we can’t use that guideline either.
The target of 2,773 is for intermediate (3) to end.
And again, without knowing where intermediate (4) begins I cannot estimate where it may end. All I can say about that one at this stage is it should be a multi week consolidation or pullback, and it should break out of the wider best fit channel on the daily chart.
XIV was at 103 in a mere 3 weeks ago. I suggested when it got back to 115 that 135 was in the cards. I didn’t realize it would only take 2 more weeks. Wow. Just wow. The ultimate high re: the grand super cycle ultimate top…over 200? Could be.
Very nuts indeed, I also did not expect to see green today in my VIX positions
I did. Most are going to ignore the warning….
For the last several weeks, buying the Friday VIX beat down has been a one way bet…. 🙂
If SPX price moves up vs down were of equal momentum (same time required to move +/- X%), then moves up in SPX would spike the VIX exactly the same as moves down in SPX. I.e., “range expansion” in either direction would drive the VIX up the same general amount. So what’s driving the VIX up a little bit today? I suspect it’s actually the UPSIDE volatility. VIX is an equal weighted index of both PUT and CALL option prices across a rolling 30 day expiration window. And note that when this happens, it appears (and operates functionally as if) the VIX is “diverging” signaling a top…which often is the case when the market is moving up with so much momentum. Something to consider, anyway.
Up Up and Away!!
Happy trading all
Fear vs. Greed readings
http://money.cnn.com/data/fear-and-greed/
The entire move is overnight AGAIN (Just as Friday & other material up moves)! Good luck getting any if that is what you choose to do.
Implied Opens =
+ 14.69 S&P 500
+ 172.76 DJIA
+ 52.18 N- COMP
AAII INDEX now 45% Bullish
After today … this AAII Index will be over 50%+++ Bullish
Friday a screaming up day on a large increase in volume, against a backdrop of one of the great bull markets in history. The few daily level bearish signals last week become signs of a healthy market (I get worried when EVERYTHING is bullish at once, maybe soon, nyet). How high it’s going on this run at the weekly level no one knows, but I’m starting to think this thing may need to finish in blow-off style. I continue to believe that pricing in the massive windfall in earnings the tax bill provides is far from complete, and everything about the market behavior so far is consistent with that view, as I see it. Could be wrong! One day at a time…I’ll be getting very long on buy triggers after a completed 2 tomorrow, that’s for certain. 3’s of 3’s of 3’s (of a 5) float my boat!!!
Certainly looks like a 3; I’m mostly cash, except long NUGT, UGAZ and VIX, which I’ll take to full position sometime today or tomorrow
Don’t sit too long on your NUGT booty… 🙂
I’ve built custom algo trail stops that take care of things for me 🙂 Good looking out though; methinks 30-31 is possible
Lol! I just reslised my wholly unintended pun! Waaaay funny! 🙂
From worst to first. That’s the way I like it.
Have a great weekend all. Have you ever heard of virtual hugs. I have not. But they make great sense and feel so good. Therefore, I am also sending out a virtual hug to a friend.
Now if I can only trap that dag nabbit rabbit. I have a yearning for hasenpfeffer,
🙂
well ok,, virtual hug it is,,, but dont try to slip me the tongue
Tongue in cheek? 🙂
🙂 🙂 🙂