
Last analysis expected for the very short term more upwards movement to about 2,650. Price did continue higher as expected, reaching 2,651.53.
Summary: The main wave count expects downwards movement to begin next week to a target at either 2,599 or 2,586.
If price makes a new low below 2,557.45, that would indicate a multi week (about 10) correction may have arrived.
If price makes a new all time high on Monday, then the next target would be at 2,732 for a small consolidation, and then 2,773 for the upwards trend to end for the mid term.
Always trade with stops and invest only 1-5% of equity on any one trade. All trades should stick with the trend. The trend remains up.
Last monthly and weekly charts are here. Last historic analysis video is here.
The biggest picture, Grand Super Cycle analysis, is here.
MAIN ELLIOTT WAVE COUNT
WEEKLY CHART
Click chart to enlarge.
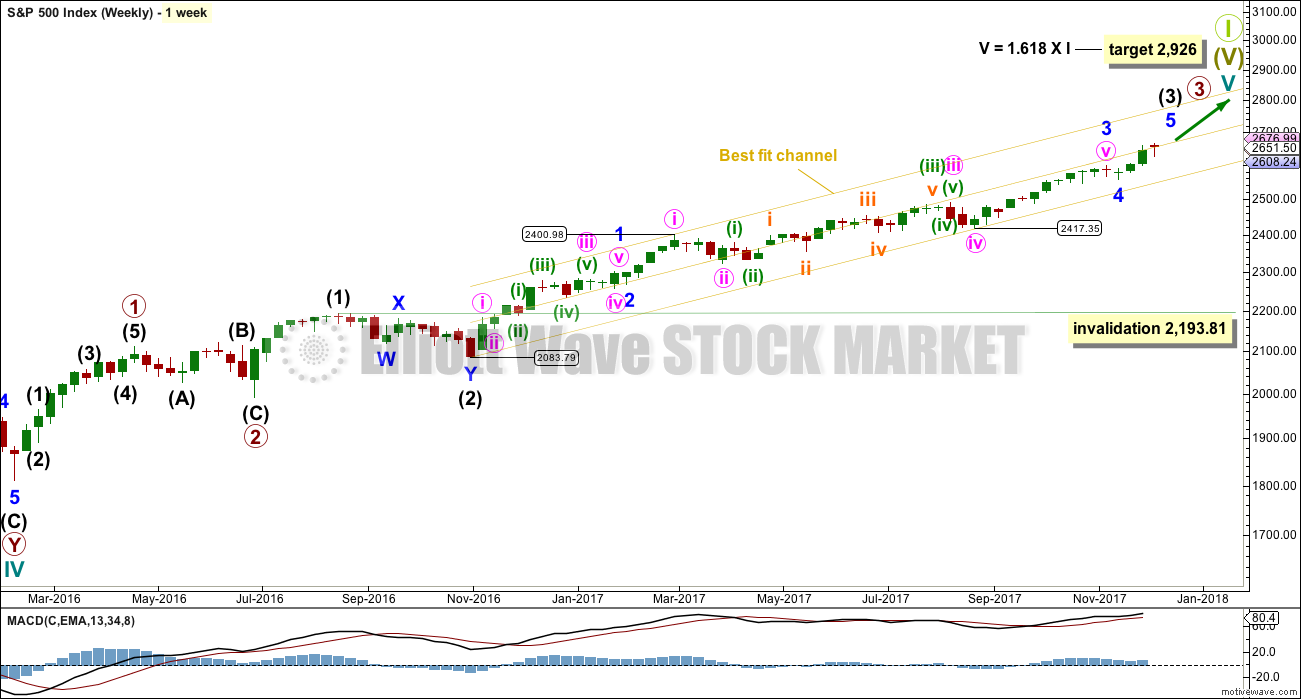
Cycle wave V must complete as a five structure, which should look clear at the weekly chart level. It may only be an impulse or ending diagonal. At this stage, it is clear it is an impulse.
Within cycle wave V, the corrections for primary wave 2 and intermediate wave (2) both show up clearly, both lasting several weeks. The respective corrections for intermediate wave (4) and primary wave 4 should also last several weeks, so that they show up at weekly and monthly time frames. The right proportions between second and fourth wave corrections give a wave count the right look. This wave count expects to see two large multi week corrections coming up, and the first for intermediate wave (4) may now be quite close by.
Cycle wave V has passed equality in length with cycle wave I, which would be the most common Fibonacci ratio for it to have exhibited. The next most common Fibonacci ratio would be 1.618 the length of cycle wave I.
Intermediate wave (3) may now be nearing completion (the alternate hourly wave count looks at the possibility it could be complete at the last high). When it is complete, then intermediate wave (4) should unfold and be proportional to intermediate wave (2). Intermediate wave (4) may be very likely to break out of the yellow best fit channel that contains intermediate wave (3). Intermediate wave (4) may not move into intermediate wave (1) price territory below 2,193.81.
The yellow best fit channel is redrawn. Price points are given so that members may replicate this channel. This channel is copied over to the daily chart.
DAILY CHART
Click chart to enlarge.
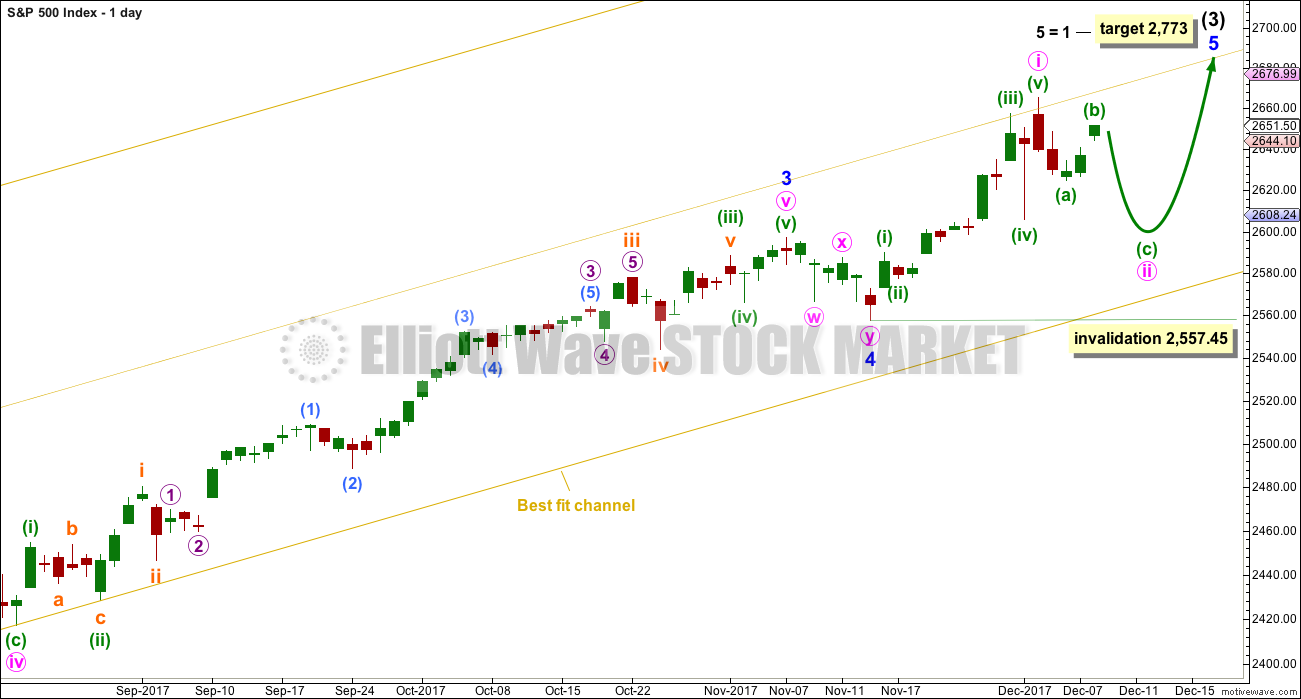
We should always assume the trend remains the same until proven otherwise. Assume that minor wave 5 is incomplete while price remains above 2,557.45.
The target calculated for minor wave 5 expects it to exhibit the most common Fibonacci ratio for a fifth wave. This target would not expect a Fibonacci ratio for intermediate wave (3) to intermediate wave (1).
Within minor wave 5, no second wave correction may move beyond the start of its first wave below 2,557.45.
HOURLY CHART
Click chart to enlarge.
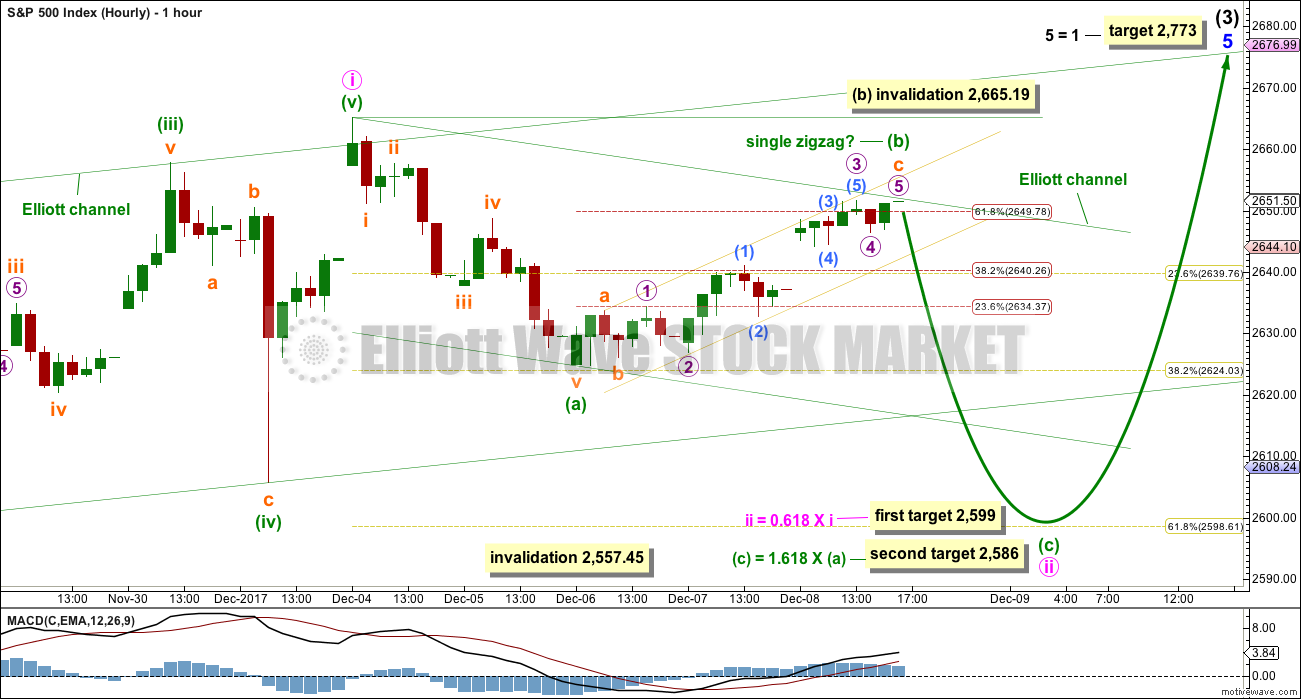
This first hourly chart follows on from labelling on the daily chart.
Minute wave ii may take another four days to complete if it totals a Fibonacci eight days. Two targets are calculated for it to end.
There is a five down complete at the hourly chart level. It looks like this is now being followed by a small bounce for minuette wave (b). Minuette wave (b) will now fit as a single zigzag ending just a little above the 0.618 Fibonacci ratio of minuette wave (a).
Minuette wave (b) may not move beyond the start of minuette wave (a) above 2,665.19. When minuette wave (b) is complete, then another five down should unfold for minuette wave (c).
ALTERNATE HOURLY CHART
Click chart to enlarge.
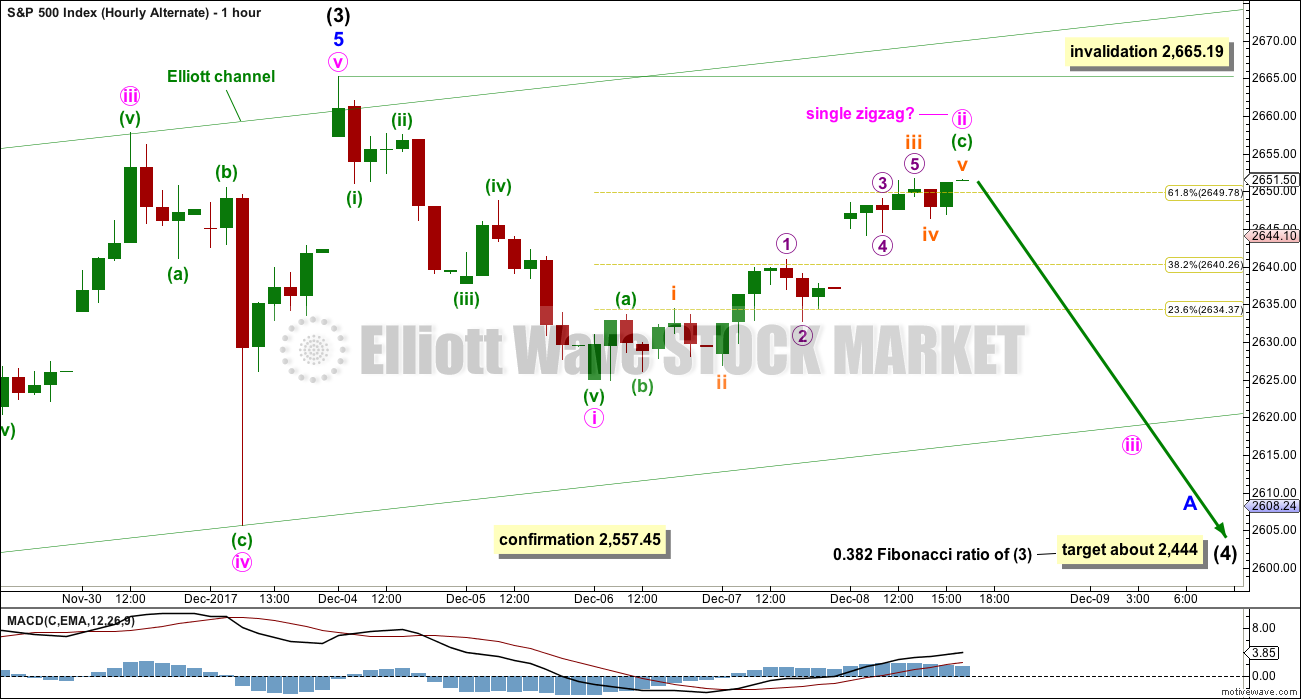
Because we should always assume the trend remains the same until proven otherwise, this wave count should be considered an alternate while price has not confirmed it.
By simply moving the degree of labelling within the five up from the end of minor wave 4 all up one degree, it is possible to see that intermediate wave (3) could be over.
If this wave count is confirmed with a new low below 2,557.45, then it would expect a multi week pullback or consolidation for intermediate wave (4) to last about ten weeks or so. If it is a complicated combination or a triangle, then it may be longer lasting, possibly a Fibonacci thirteen or even twenty-one weeks.
At this early stage, the 0.382 Fibonacci ratio of intermediate wave (3) would be a reasonable target.
For the short term (the next week or so), a trend change at intermediate degree should see a larger five down develop at the hourly chart level. So far only a first wave within that five down may be complete.
Minute wave ii may not move beyond the start of minute wave i above 2,665.19.
Both wave counts expect overall the same direction next.
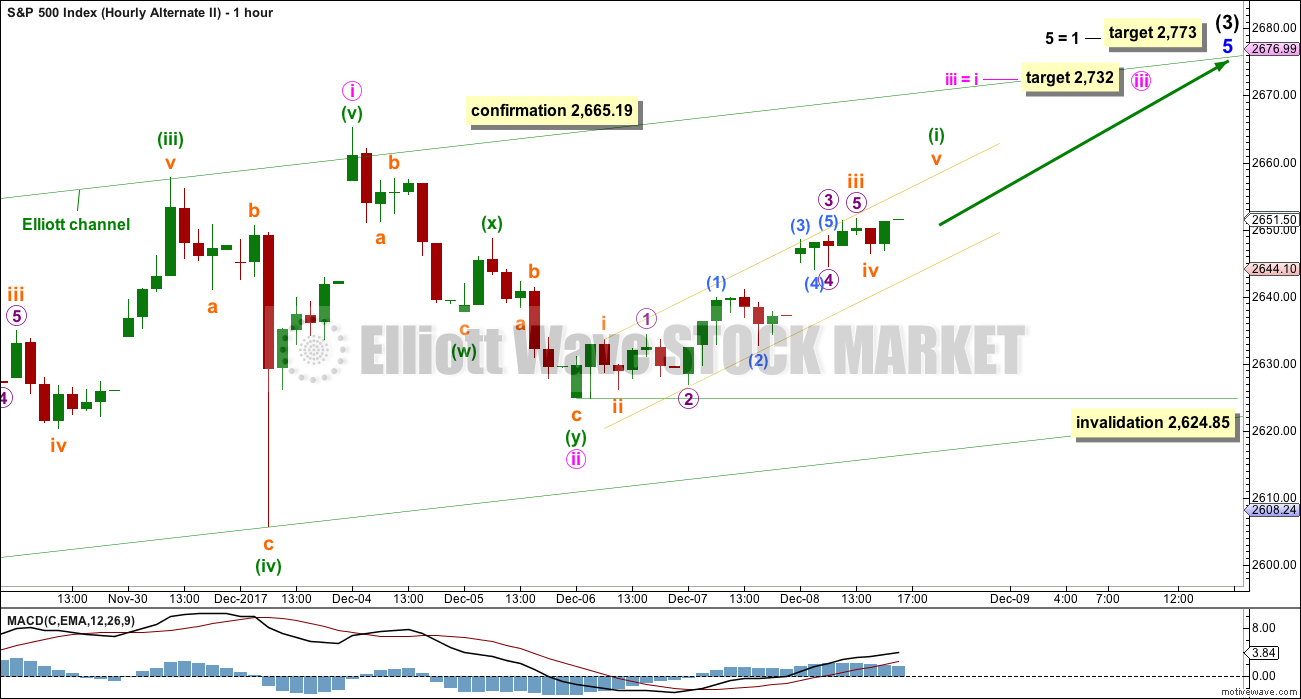
SECOND ALTERNATE HOURLY CHART
Click chart to enlarge.
A more bullish wave count should be considered because the AD line has this week made a new all time high.
If price follows the AD line and makes a new all time high next week, then the last wave down cannot be seen as a five. It will fit as a double zigzag, although this does not have as good a fit. The S&P does not always have waves that have the right look though, so all possibilities should be considered.
If price makes a new high, then a low degree third wave should be underway. The target is for equality in length with minute wave i, because minute wave ii was shallow, and because it fits with the higher target for minor wave 5 to end.
Within minute wave iii, no second wave correction may make a new low beyond the start of its first wave below 2,624.85.
TECHNICAL ANALYSIS
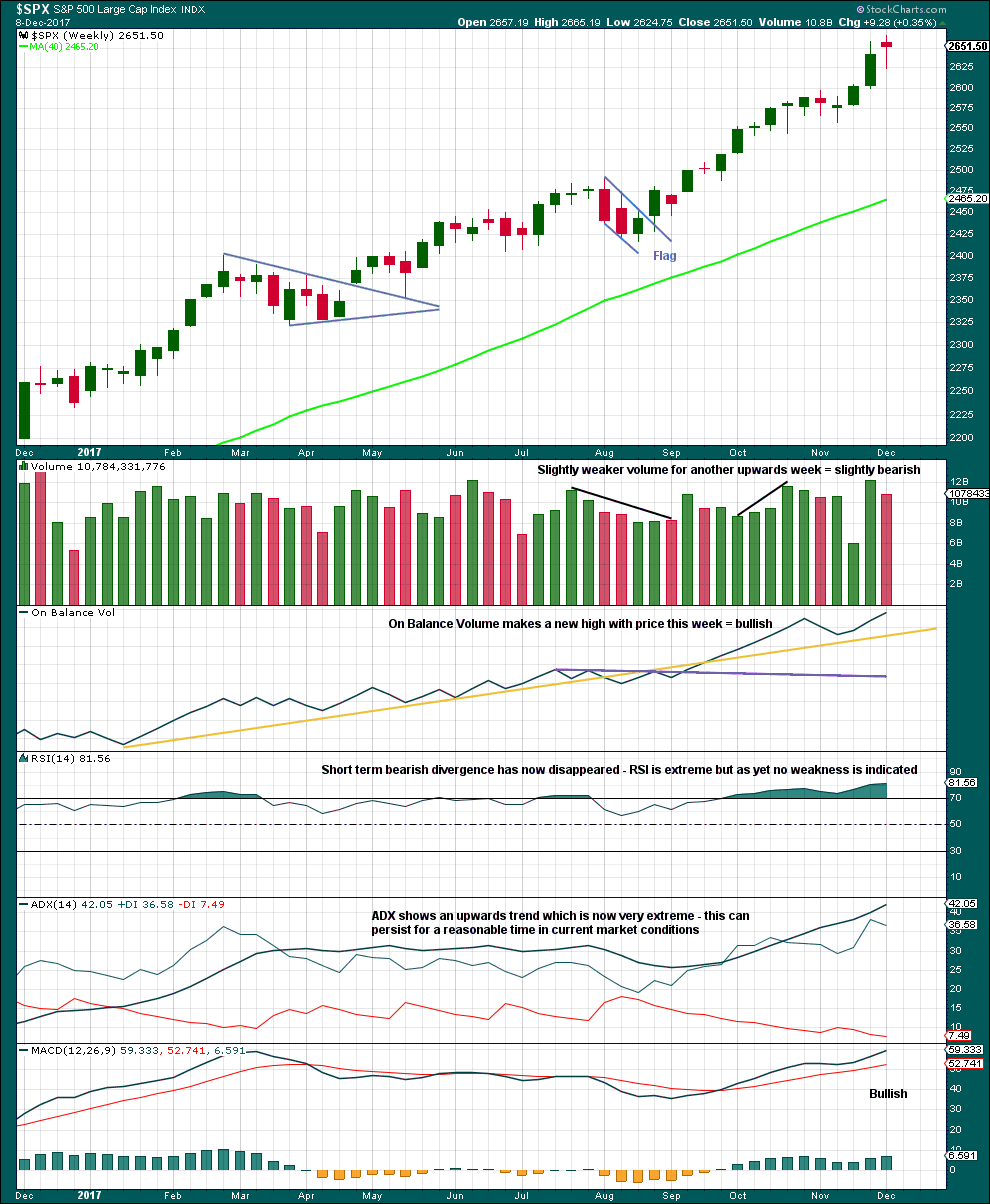
WEEKLY CHART
Click chart to enlarge. Chart courtesy of StockCharts.com.
There is no candlestick reversal pattern yet at highs.
Price and On Balance Volume continue to make new highs. This is bullish.
The trend is extreme, but as yet there is no reversal signal at this time frame.
DAILY CHART
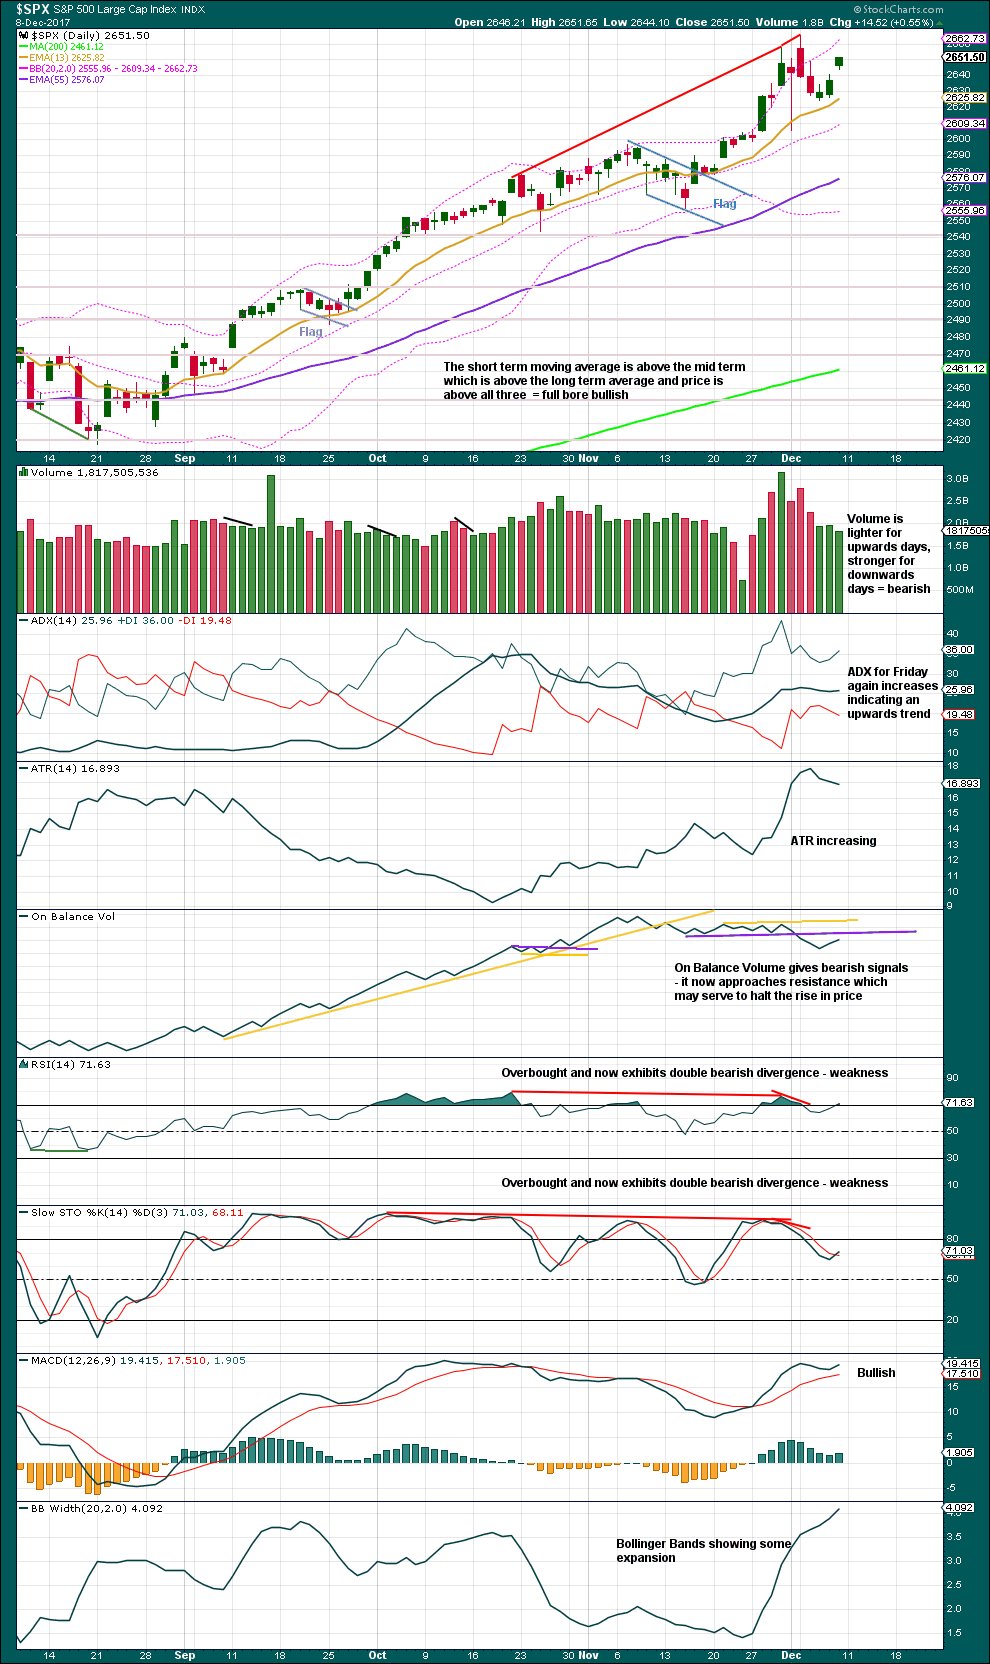
Click chart to enlarge. Chart courtesy of StockCharts.com.
RSI, Stochastics and On Balance Volume are all bearish. At the end of this week, On Balance Volume is also bearish.
This analysis gives weight to the bearish signal from On Balance Volume. This is exactly the kind of signal which turns up at trend changes of reasonable magnitude. It is looking a little more like a trend change of a reasonable magnitude, and this supports the alternate hourly Elliott wave count.
VOLATILITY – INVERTED VIX CHART
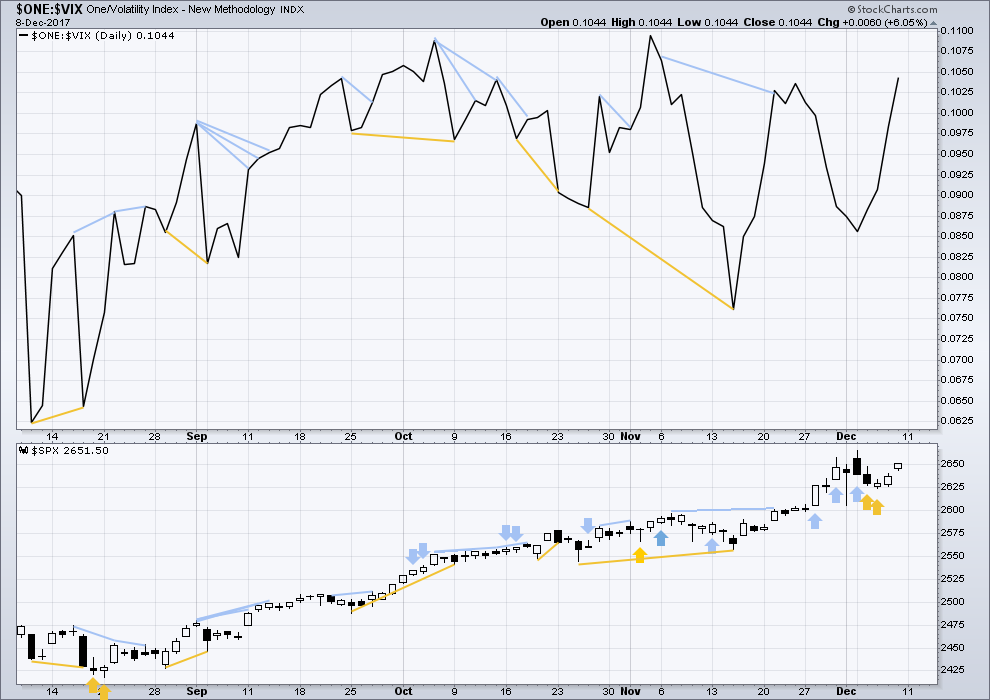
Click chart to enlarge. Chart courtesy of StockCharts.com.
So that colour blind members are included, bearish signals will be noted with blue and bullish signals with yellow.
Normally, volatility should decline as price moves higher and increase as price moves lower. This means that normally inverted VIX should move in the same direction as price.
The rise in price today came with a normal corresponding decline in market volatility.
BREADTH – AD LINE
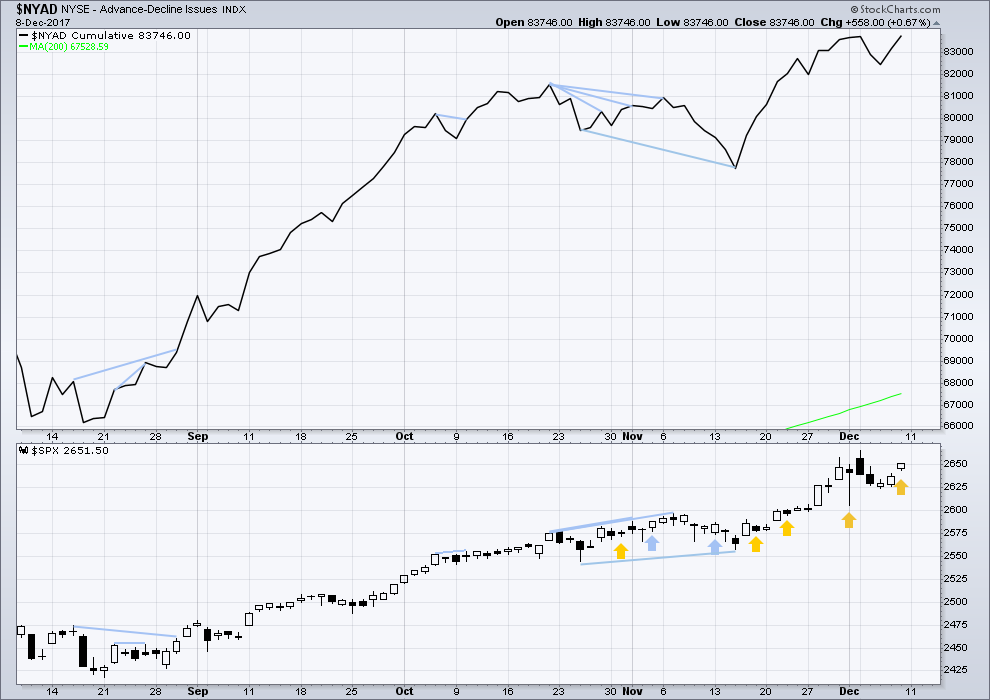
Click chart to enlarge. Chart courtesy of StockCharts.com.
There is normally 4-6 months divergence between price and market breadth prior to a full fledged bear market. This has been so for all major bear markets within the last 90 odd years. With no longer term divergence yet at this point, any decline in price should be expected to be a pullback within an ongoing bull market and not necessarily the start of a bear market.
All of large, mid and small caps this week have made new all time highs. The rise in price has support from market breadth.
A very slight new high from the AD line for Friday is bullish. Breadth should be read as a leading indicator.
DOW THEORY
The DJIA, DJT, and S&P500 have this week made new all time highs. Only Nasdaq was unable this week to make a new all time high.
The following lows need to be exceeded for Dow Theory to confirm the end of the bull market and a change to a bear market:
DJIA: 17,883.56.
DJT: 7,029.41.
S&P500: 2,083.79.
Nasdaq: 5,034.41.
Charts showing each prior major swing low used for Dow Theory are here.
Published @ 11:54 p.m. EST.
Stock market headed toward a record 12 months out of 12 months with a positive return. $1.5 trillion borrowed from future generations and paid out now to the uber rich and uber profitable corporates, the elimination of all consumer protections, environmental protections, fraud protections, financial risk management protections, the elimination of all US attorney efforts to prosecute corporate crime, all add up to a Ferengyi’s dream!
Boohoo…. Waa… waa…. Waaaa!
Boohoo…. Waa… waa…. Waaaa! Waa… waa…. Waaaa!
Look at that market soar. Is the clock ticking backwards now?
For the second alternate which is looking more likely as price goes higher, a second wave correction may be coming up soon.
That may keep us guessing for a few days as to which wave count is the right one 🙁
With the AD line making new highs that is very bullish.
But On Balance Volume is still bearish.
The confusion comes because these two indicators that I place a lot of weight on, are disagreeing at this time.
Thank you, Lara!
You’re welcome 🙂
Bitcoin analysis up for you all now too.
Thanks Lara!
I’ve been a bit suspicious of OBV as a reliable indicator at a daily chart level. I put much more weight on OBV at the weekly level, and largely discount a bearish OBV reading at the daily level if it contradicts the preponderance of the evidence, and in particular, price action. This may be a function of the general abnormality of this raging bull market, I don’t know. Or I could be seeing a pattern of “failed daily bearish OBV readings” where in fact one doesn’t exist.
You may be right. I’ll be keeping this view in mind firmly over the next few days. If OBV fails here and price moves to new ATHs then that may be the case 🙁
At the daily chart it’s working so very well for Gold.
This first alternate is looking less and less likely the higher price goes…
GAAP earnings up only around 2.20%… Yr over Yr.
So 2.20% in earnings = + 30% in market movement???
Sorry, I don’t believe people who promote this line of BS!
#$&@ &^$
We have been through the economic looking glass for quite some time now my friend. The divorce from reality is commensurate with the magnitude of a historic 500 year cycle top.
This is true.
Thoughts on VIX as it sits right now?
Looks like we are back to the Friday smash. If we in a impulse higher we could hang around these sub-ten lows for a bit. I continue to accumulate but am taking positions a few months out. The action in VIX is indeed, unless it changes prior to the close. hinting at the second alternate as others have suggested.
A most remarkable chart showing why vol has been essentially a one-way bet this year.
Could we possibly see a mirror image of this some time in the future?
https://www.marketwatch.com/story/global-stocks-could-make-history-this-month-by-refusing-to-fall-2017-12-08
Second alternate hourly chart is gaining credence. Will we witness another in a series of corrections that fail to materialize? Maybe the old saying is correct, “Surprises in a bull market are to the upside.”
Second hourly is now the main for myself personally. Several aspects of price action and other markets suggested that strongly to me Friday (the gap which the market never attempted to fill, the push beyond the 61.8%, the strength in RUT, and I noticed IBB was very oddly up strongly contrary to the general NDX), and the action this morning is not definitive, but very strongly confirming. Note that as modeled, the overall push up is a minuette 1. Hence, a minuette 2 could have price pullback back nominally to 2637 (61.8% retrace of current low/high range). I will view that if and as it develops as a minuette 2 of the second hourly after this morning’s action, NOT the start of big new legs down ala the hourly main and first alt. However, it’s not clear that minuette 2 is even started yet; price may go to the 100% retrace, or even the 1.28% first.
I’ll add that with price kind of in no man’s land right here (going up more?? coming down first?? I have NO CLUE), I’m quite busy…playing chess. I have a stop buy on VXX a ways above its market price, and a SPXU (2x leveraged short SPX) market buy ready to punch, just in case I see some very sharp downside action suddenly occurring. Lots of US political/world events could drive a very sharp spike down (the minuette 2) at any moment, and I’d like to catch some of that action should it occur.
Lara,
I recall you had mentioned doing a Bitcoin analysis. I see some on the Gold website and wondering if it was shared with folks here or was only for GOLD members. Please advise.
I’ll copy it over to this site for EWSM members. Sorry about that
The Fed Balance Sheet Liquidation has started and liquidity is being drained.
Good article on the process of how it is being done…
http://www.zerohedge.com/news/2017-12-09/qe-unwind-really-happening-fed-assets-drop-lowest-level-over-three-years
Looks Like mission accomplished… The “Bag Holders” are now in place!
{“Updating one of our favorite data series from the Federal Reserve’s latest Z.1 Release, we see that in the 3rd quarter, household and nonprofit’s stock holdings jumped to 36.3% of their total financial assets. This is the highest percentage since 2000. And, in fact, the only time in the history of the data (since 1945) that saw higher household stock investment than now was during the 1999 to 2000 blow-off phase of the dotcom bubble. Perhaps not everyone is in the pool, but it certainly is extremely crowded.”}
Article from Zero Hedge
We have to keep in mind this is what the FED is reporting. I take everything these folk place in the public arena with a huge grain of salt. They were a bit fuzzy about what is gong on with MBS purchases in the article but the bottom line is they have NOT reduced them and I consider this more back door Q.E. I will try to find the data I saw on this recently and post it.
Nonetheless, I think the larger context of the bloated balance sheet remains of greater significance… 🙂
They steadfastly refuse to be audited, and rumor has it there are another three to four trillion not accounted for…
“Audit the fed” has nothing to do with an audit. It means giving congress more control over the fed policies. From the Brookings Institute (a bastion of right wing “thinking”, which is itself hilarious):
“The Fed is already thoroughly audited in the usual sense, by an independent inspector general and by an outside accounting firm (currently, Deloitte and Touche), and
the resulting financial reports are made public online. Every security owned by the Fed, up to the detail of the identifying CUSIP number,
is also available online. Moreover, the Government Accountability Office (GAO), which does in-depth reviews and analyses (“audits” of a different type) of government activities at the request of Congress, has wide latitude to review Fed operations, including supervision and regulation as well as other functions. For example, as required by the Dodd-Frank Act of 2010, the GAO conducted reviews of the Fed’s emergency lending programs during the crisis and of the Fed’s governance structure. Since the financial crisis, the GAO has done some
70 reviews of aspects of Fed operations.
So what does Audit the Fed actually do? The principal effect of the bill would be to make meeting-by-meeting monetary policy decisions subject to Congressional review and, potentially, Congressional pressure. The bill would do this by repealing existing restrictions, imposed by Congress nearly forty years ago, on what the GAO can examine when reviewing the Fed. The most important such restriction blocks the GAO from reviewing “deliberations, decisions, or actions on monetary policy matters,” as well as “discussion or communication among or between members of the Board and officers and employees” related to such deliberations. The repeal of the existing restrictions would accordingly allow the GAO to view all materials and transcripts related to a meeting of the Fed’s Federal Open Market Committee (FOMC) at essentially any time and require the GAO, at Congressional request, to provide recommendations on monetary policy, including potentially on individual FOMC interest-rate decisions.”
You are really waaaay to funny Kevin. You assert those things with such conviction that it makes me smile. The audit the FED argument had NOTHING to do with micro-managing their day to day operations or even setting policy, and EVERYTHING to do with so-called “Off Balance Sheet” transactions, which they steadfastly refuse to acknowledge, much less provide any details as to their nature. We are talking about non-trivial sums, ammounting to fully HALF the “official” balance sheet. Luckily for them, the great unwashed don’t know and care even less…
You really believe the hogwash you read about these crooks? Come on man! 🙂
BTW, if you think I am BS-ing ask Obama where he got that cash he sent to Iran…it is truly amazing what they even do right under our noses, to say nothing of behind closed doors…
my comment is,,, first,,, dilly dilly
Why doc, you are quite on the spot this last week. You must have been up late partying last night. Good for you!