
For the very short term, downwards movement was expected, and this is exactly what has happened for Tuesday’s session.
Only two hourly wave counts will be published today, and they both expect overall the same direction for price next.
Summary: For the short term, look now for a pullback to about 2,624 or 2,599. This may be a second wave correction. Thereafter, look for upwards movement to continue towards the target about 2,773.
If price makes a new low below 2,557.46, that would indicate a multi week (about 10) correction may have arrived.
Always trade with stops and invest only 1-5% of equity on any one trade. All trades should stick with the trend. The trend remains up.
Last monthly and weekly charts are here. Last historic analysis video is here.
The biggest picture, Grand Super Cycle analysis, is here.
MAIN ELLIOTT WAVE COUNT
WEEKLY CHART
Click chart to enlarge.
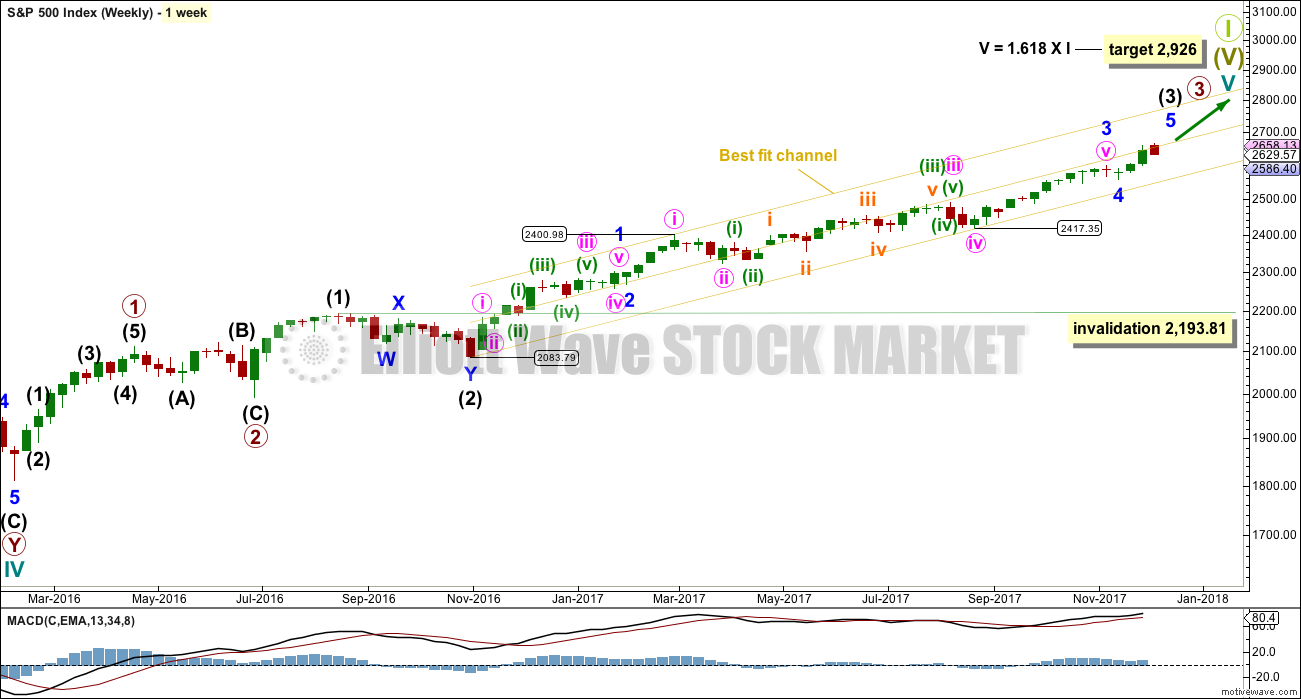
Cycle wave V must complete as a five structure, which should look clear at the weekly chart level. It may only be an impulse or ending diagonal. At this stage, it is clear it is an impulse.
Within cycle wave V, the corrections for primary wave 2 and intermediate wave (2) both show up clearly, both lasting several weeks. The respective corrections for intermediate wave (4) and primary wave 4 should also last several weeks, so that they show up at weekly and monthly time frames. The right proportions between second and fourth wave corrections give a wave count the right look. This wave count expects to see two large multi week corrections coming up, and the first for intermediate wave (4) may now be quite close by.
Cycle wave V has passed equality in length with cycle wave I, which would be the most common Fibonacci ratio for it to have exhibited. The next most common Fibonacci ratio would be 1.618 the length of cycle wave I.
Intermediate wave (3) may now be nearing completion (the alternate hourly wave count looks at the possibility it could be complete at yesterday’s high). When it is complete, then intermediate wave (4) should unfold and be proportional to intermediate wave (2). Intermediate wave (4) may be very likely to break out of the yellow best fit channel that contains intermediate wave (3). Intermediate wave (4) may not move into intermediate wave (1) price territory below 2,193.81.
The yellow best fit channel is redrawn. Price points are given so that members may replicate this channel. This channel is copied over to the daily chart.
DAILY CHART
Click chart to enlarge.
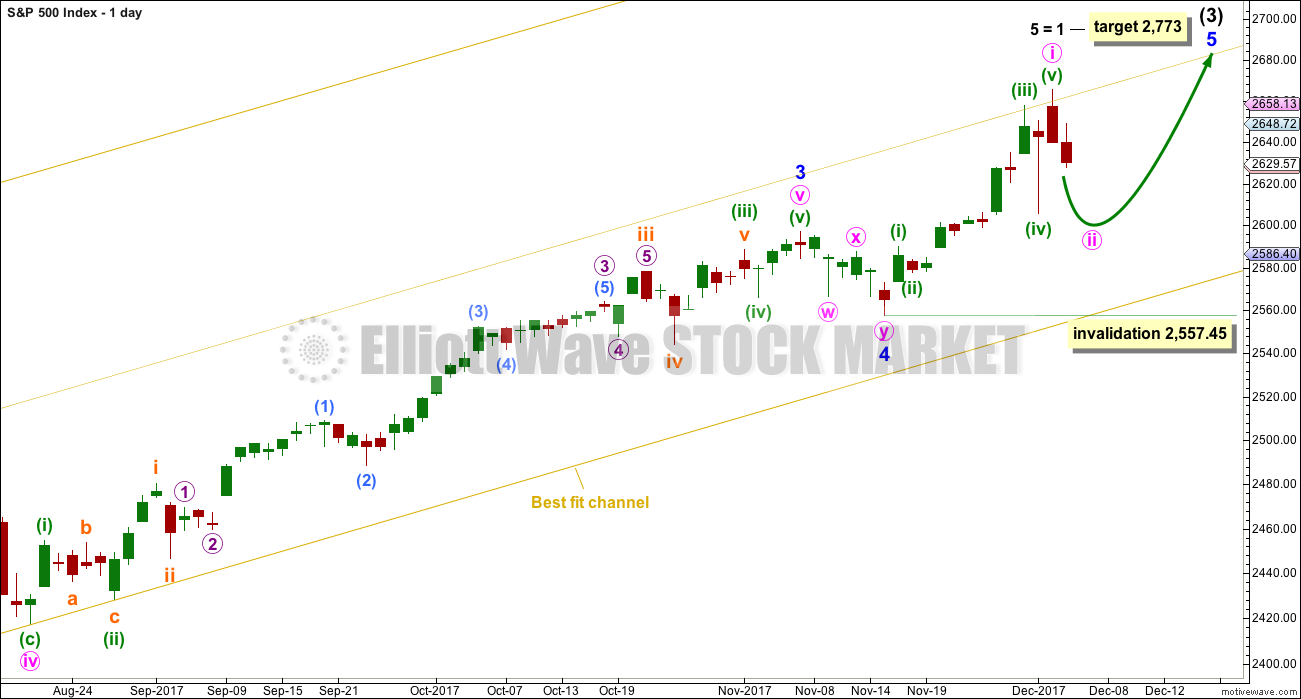
We should always assume the trend remains the same until proven otherwise. Assume that minor wave 5 is incomplete while price remains above 2,557.45.
The target calculated for minor wave 5 expects it to exhibit the most common Fibonacci ratio for a fifth wave. This target would not expect a Fibonacci ratio for intermediate wave (3) to intermediate wave (1).
Within minor wave 5, no second wave correction may move beyond the start of its first wave below 2,557.45.
HOURLY CHART
Click chart to enlarge.
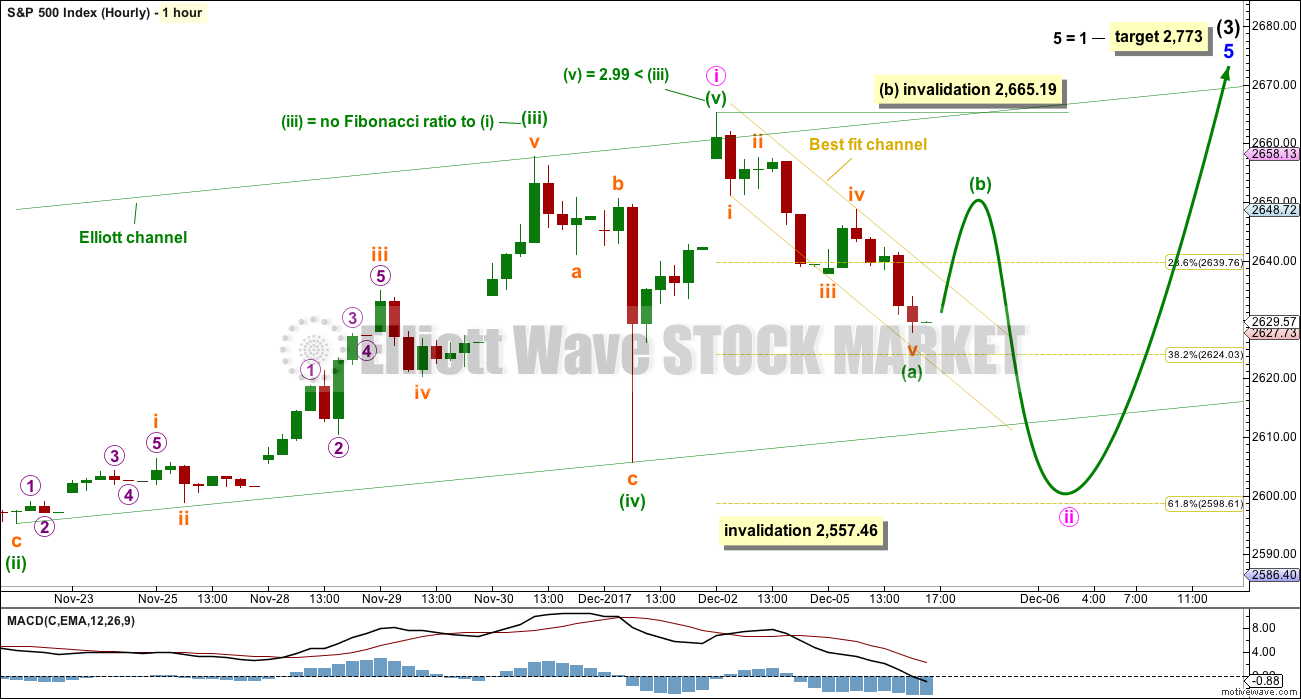
This first hourly chart follows on from labelling on the daily chart.
A five up from the low of minor wave 4 is complete. This wave count fits with MACD: the strongest momentum within this five up is the end of the third wave of minuette wave (iii), and within the third wave the strongest portion of the histogram is its middle, subminuette wave iii. At the end of the five up, there is some divergence with price and momentum for the fifth wave of minuette wave (v).
With a five up now compete, a three down should follow. If minor wave 5 is incomplete, then only minute wave i may be over at today’s high. Now minute wave ii may take a few days to complete. The most likely point for it to end may be the 0.618 Fibonacci ratio about 2,599, but the 0.382 Fibonacci ratio about 2,624 is also a reasonable target.
There is a five down complete at the hourly chart level. If my analysis of this wave down is correct, then it should be followed by a small bounce for minuette wave (b). Before this happens though, it is entirely possible that minuette wave (a) may continue lower. Use the yellow best fit channel as a guide as to when minuette wave (a) is complete and minuette wave (b) has arrived. When price breaks above the upper edge of this channel, then assume that minuette wave (b) has begun.
Minuette wave (b) may not move beyond the start of minuette wave (a) above 2,665.19.
Minute wave ii looks like it may now end closer to the 0.618 Fibonacci ratio than the 0.382 Fibonacci ratio. It may be subdividing as a simple zigzag.
ALTERNATE HOURLY CHART
Click chart to enlarge.
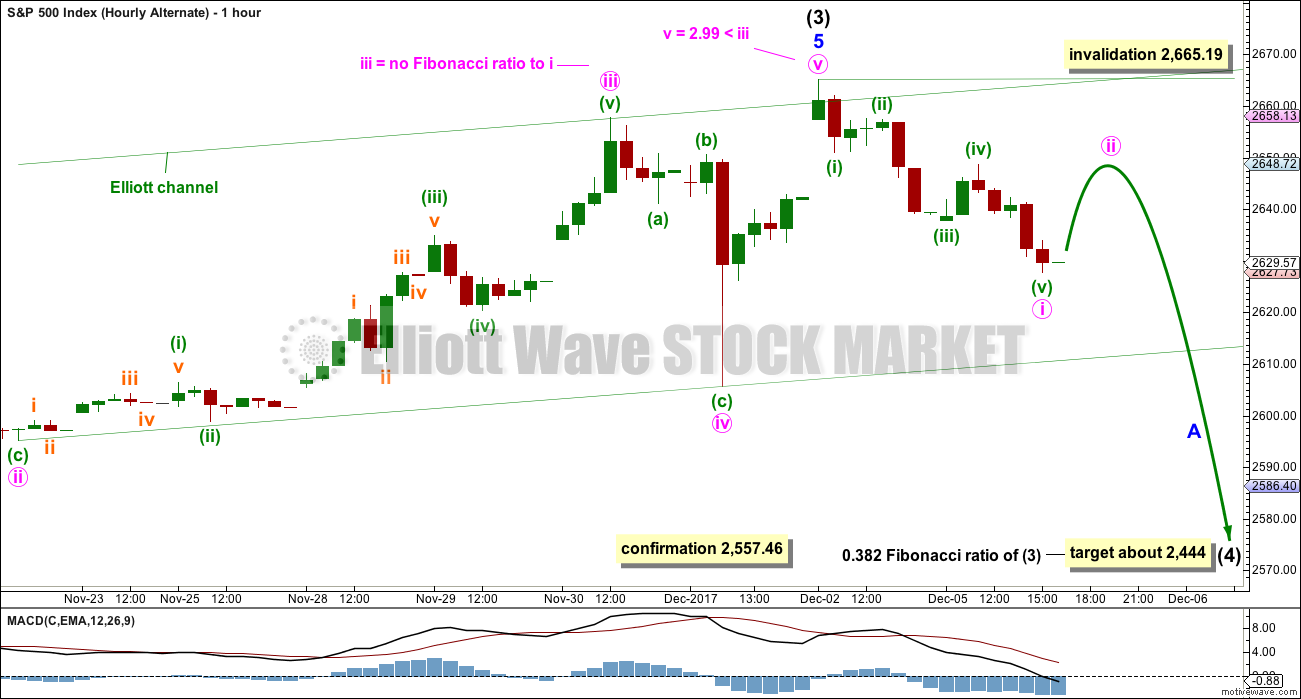
Because we should always assume the trend remains the same until proven otherwise, this wave count should be considered an alternate while price has not confirmed it.
By simply moving the degree of labelling within the five up from the end of minor wave 4 all up one degree, it is possible to see that intermediate wave (3) could be over.
If this wave count is confirmed with a new low below 2,557.46, then it would expect a multi week pullback or consolidation for intermediate wave (4) to last about ten weeks or so. If it is a complicated combination or a triangle, then it may be longer lasting, possibly a Fibonacci thirteen or even twenty-one weeks.
At this early stage, the 0.382 Fibonacci ratio of intermediate wave (3) would be a reasonable target.
For the short term (the next week or so), a trend change at intermediate degree should see a larger five down develop at the hourly chart level. So far only a first wave within that five down may be complete.
Minute wave ii may not move beyond the start of minute wave i above 2,665.19.
Both wave counts expect overall the same direction next.
TECHNICAL ANALYSIS
WEEKLY CHART
Click chart to enlarge. Chart courtesy of StockCharts.com.
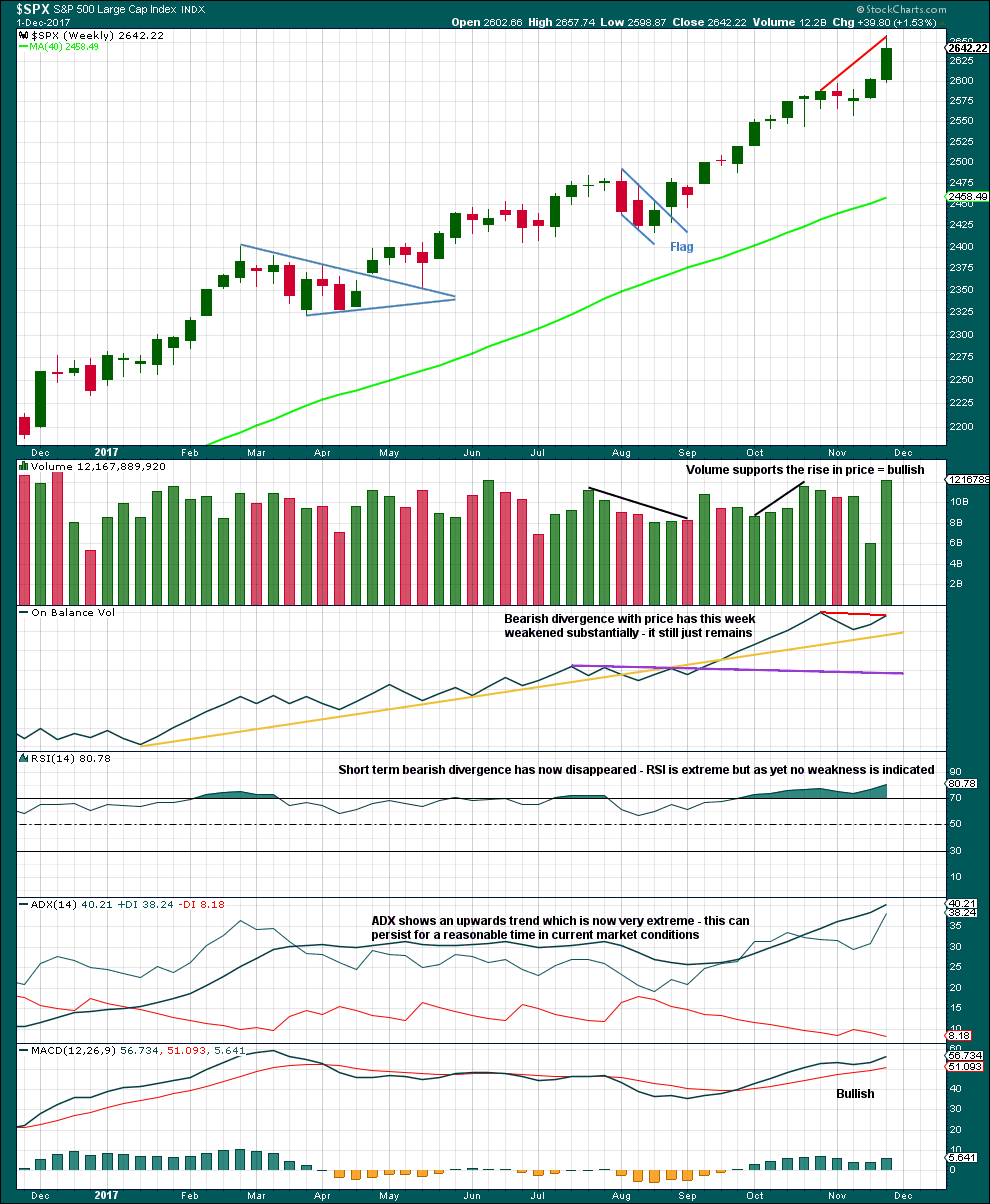
This last week completed the strongest volume for a year, which for an upwards week is very bullish.
The problem with divergence, and one reason why it is hopeless as a timing tool, is that sometimes it just disappears. That is what has happened between divergence with price and RSI. Still, the failure of On Balance Volume to make new all time highs with price is bearish especially if On Balance Volume is a leading indicator.
This trend is extreme, but it could still continue for a while longer. Look for a candlestick reversal pattern or a bearish signal from On Balance Volume.
DAILY CHART
Click chart to enlarge. Chart courtesy of StockCharts.com.
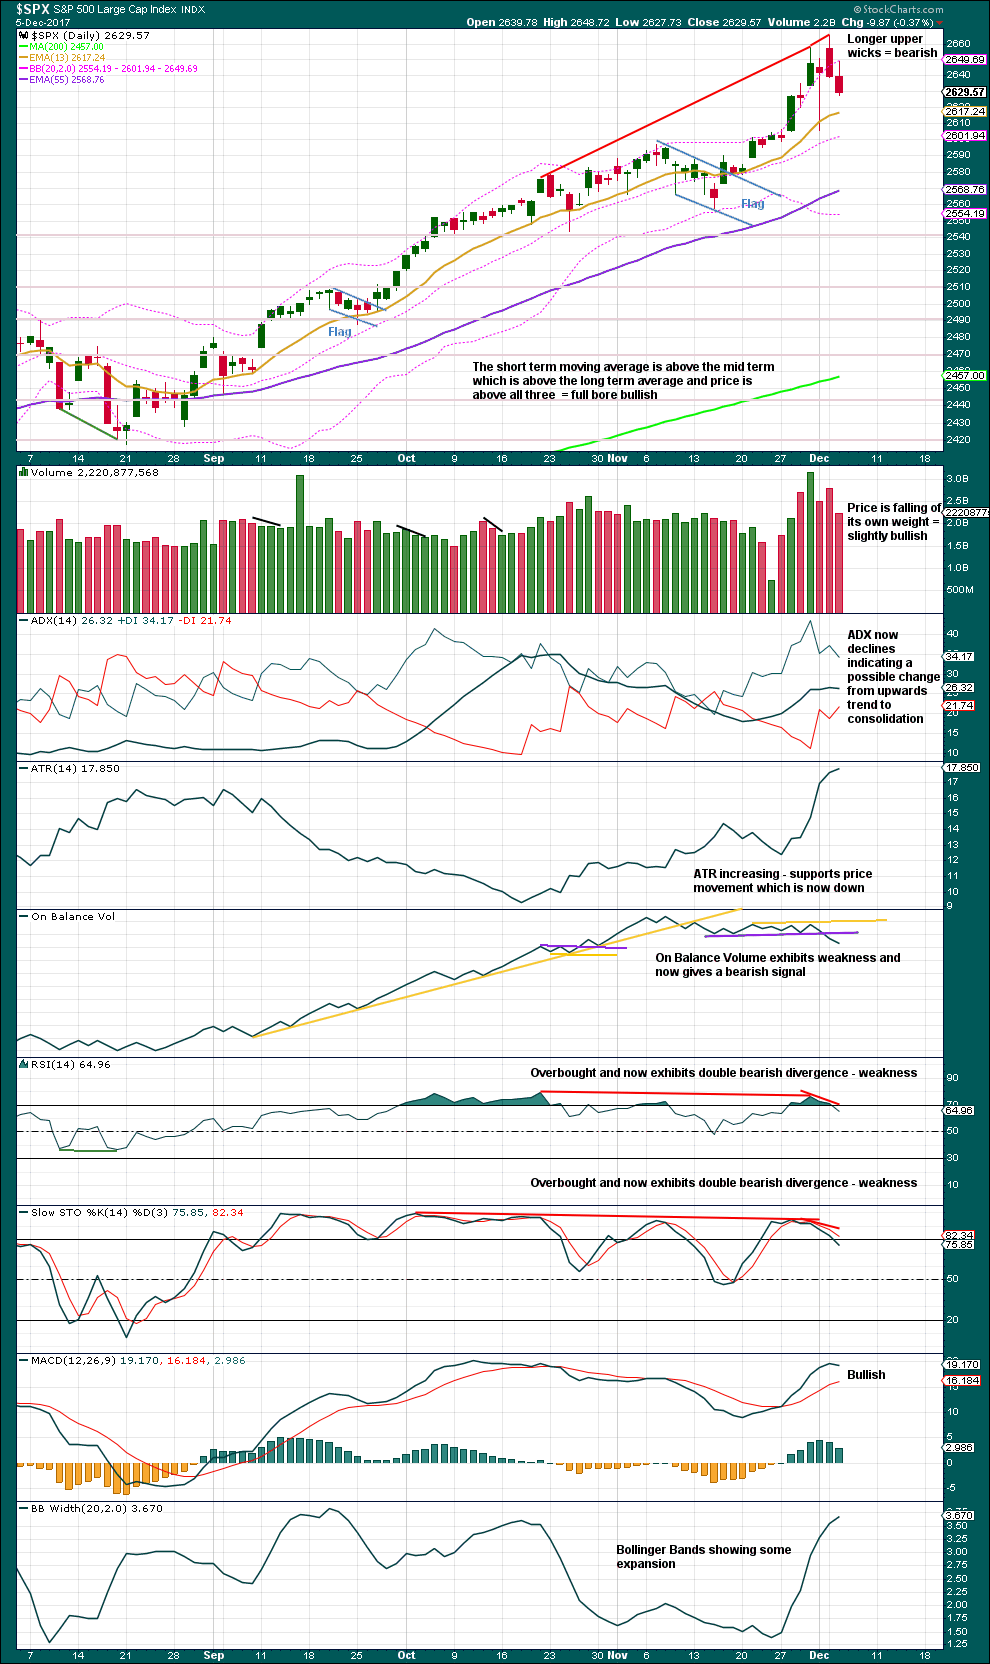
The target using the measured rule from the last flag pattern was about 2,633. It was met and well passed. Price is now turning downwards.
RSI, Stochastics and On Balance Volume are all bearish.
This analysis gives weight to the bearish signal from On Balance Volume. This is exactly the kind of signal which turns up at trend changes of reasonable magnitude. Today, it is looking a little more like a trend change of a reasonable magnitude, and this supports the alternate hourly Elliott wave count.
VOLATILITY – INVERTED VIX CHART
Click chart to enlarge. Chart courtesy of StockCharts.com.
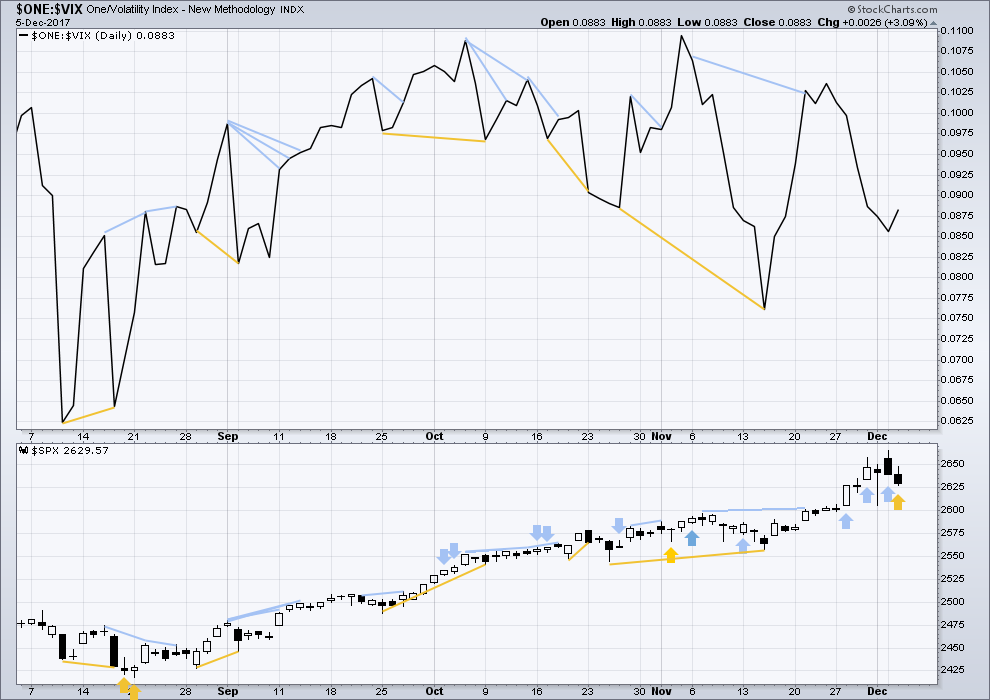
So that colour blind members are included, bearish signals will be noted with blue and bullish signals with yellow.
Normally, volatility should decline as price moves higher and increase as price moves lower. This means that normally inverted VIX should move in the same direction as price.
Another bearish signal noted yesterday between price and inverted VIX has now been followed by a downwards day. This bearishness may now be resolved, or it may require another downwards day to resolve it.
Price has moved lower today, but inverted VIX has moved higher. Downwards movement did not come with a normal increase in volatility. Volatility declined, which indicates weakness within price today and is interpreted as bullish.
BREADTH – AD LINE
Click chart to enlarge. Chart courtesy of StockCharts.com.
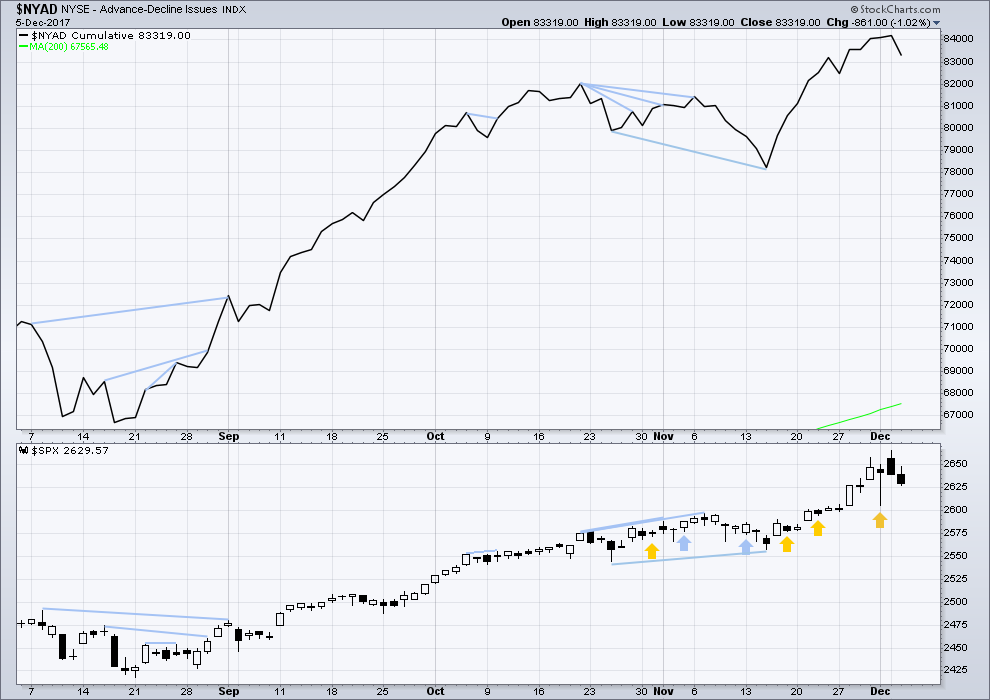
There is normally 4-6 months divergence between price and market breadth prior to a full fledged bear market. This has been so for all major bear markets within the last 90 odd years. With no longer term divergence yet at this point, any decline in price should be expected to be a pullback within an ongoing bull market and not necessarily the start of a bear market.
All of large, mid and small caps last week have made new all time highs. The rise in price has support from market breadth.
The fall in price today comes with a corresponding normal decline in market breadth. The fall in price is supported by a fall in breadth, which is bearish.
DOW THEORY
The DJIA, DJT, S&P500 and Nasdaq have last week made new all time highs. This provides confirmation of the ongoing bull market.
The following lows need to be exceeded for Dow Theory to confirm the end of the bull market and a change to a bear market:
DJIA: 17,883.56.
DJT: 7,029.41.
S&P500: 2,083.79.
Nasdaq: 5,034.41.
Charts showing each prior major swing low used for Dow Theory are here.
Published @ 08:24 p.m. EST.
[Note: Analysis is public today for promotional purposes. Member comments and discussion will remain private.]
Weird! I was just looking over my portfolio of long VIX positions and was wondering why VIX 10.00 strike calls for Dec 15 have an ask of 2.35, while the same strike calls for Dec 20 only 1.95??!!
The market makers sometimes make no sense whatsover…do they know something??!! 🙂
Also exited my DIA 242 puts expiring Friday for a small loss; in at 1.00, out at 0.90; I don’t like the meandering. Have a great evening all! 🙂
Once again knee-jerk selling of VIX to just below the 200 dmsa pivot. Kind of like holding an inflated ball under water. Perhaps we will get enough pressure built up to prompt that needed gap through 14.00 soon…
I must say they did a pretty good job defending that DJI 24,150.00 shelf; not that there was any really serious challenge from the bears which I find a bit curious as breaking it would almost certainly have led to some serious swoon-age so to speak… 🙂
Taking a few more green trades off the table in the form of IWM 150 strike Dec 15 puts ups just under a double. In at 0.86 out at 1.48. We could see a bit of a bounce from here so no point in hanging around….
Again Boring!
For old times sake. Lets chant! Late Day Swoon… For all indexes.
Late Day Swoon…
Late Day Swoon…
Late Day Swoon…
Late Day Swoon…
Late Day Swoon… for 3:25PM to close and then overnight
I’m with you Joe.
Late Day Swoon…
Late Day Swoon…
Late Day Swoon…
Late Day Swoon…
Late Day Swoon…
I would actually rather lean towards the alternate at this time, but I’ve learned that I should be more cautions. Assume the trend remains the same…. until proven otherwise.
And so this will still be the main wave count.
With what looks now like a clear five down complete and upwards movement today breaking above a channel that contains it, now look for a three up to complete which may not make a new high. A target for the three up would be about 2,650.
Only very experienced traders should be considering trading this correction short. It’s against the trend. The trend at this time for all the evidence in hand today is still up. Corrections are an opportunity to join the trend.
If any members who are not very experienced take a punt on the short side then please please manage your risk carefully. Invest only 1-3% of equity here, and always use a stop.
Occasionally we have a new member come in here and make a comment that reveals they’re trading without stops. It never ends well. Do not be that person. When I see that, my policy is to terminate membership and black list that person. I do not want to be the analyst who is blamed for the losses of reckless traders.
Yes indeed! Trading without stops or built in limit to potential losses is a sure way of blowing up one’s trading account in a hurry. There should always be a number that tells you you are wrong about a trade…
Boring!
SPX 5 wave down trend line busted. C up started? If so, a move to 2640 minimally should unfold.
The 23.6% retrace fibo has been tested twice and both times price has failed to push through. Other markets stalling too. Extremely weak, so far.
I really hate when they prolong these waves down to chew up option premium and drive people batty. I know I should wait but I am taking the double on my SVXY 18 strike puts expiring Friday and pocketing it. I am sure it will break 100 by Friday but tired of watching paint dry…
SVXY could be in a leading contracting diagonal down. If so, the deep second wave up is going to to be a great entry for at least a 5 bagger…
Anyone have a view of the Gold price chart … from here?
Breaking support and probably headed South…
Looks like an abc (5-3-5) down starting Sept 11. The b was a flat. The new c down has just started. Should proceed to the 1.28% extension of the first 5 down, minimally (117.2 in GLD). Other likely decison points for a turn are 115.5 where a = c in length, and the 1.62% extension of the 5 down at 114.5. That 115.5-114.5 area is where I will look most intently for a possible turn and buy triggers.
I can see a classic symmetrical triangle and a downwards breakout from that yesterday. A target calculated from the base of the triangle to the breakout point would be about 1,228.
Yes ma’am! 🙂
I am trading the move with Dec 22 GLD 122/125 call credit spreads….
You just watch. We still have some clueless reactive vol short sellers who are once again going to burn capital trying to send it back below the 200 dsma….
Keep an eye on SVXY 98.28.
If we take that out today or tomorrow, it means other traders are following the one that unwound a huge position last Friday. That would take us back to the lower B band and the banksters WILL step in…but you knew that! 🙂
Verne, Chris, Take a look at the a 20 min Chart on VIX over 3 days and tell me what you see?
30 Year US Treasury 2.669%
A short term uptrend… 🙂
Higher Lows after testing the 100 & 200 DMA each of the last few days.
Looks to me to be building for higher VOL levels. Similar to 2016.
I would not be at all surprised by another spastic spike down ahead of another move higher. I continue to buy ‘me….
Very high probability that this sideways triangle like formation entered from above will eventually break to the downside….it could be swift with an equally sharp reversal to the upside so trades will have to be harvested quickly…
Boring pattern continues. Sideways meandering during the session, dive into the close. Price continues to be “managed” in the absence of aggressive sellers…*YAWN*
If you have ever wondered about why so much of the world views American leaders with such utter contemp, look no farther than what is going on in the senate today. Despite all the evidence that has been revealed about the Russian collusion farce, not the least of which was the despicable fraudulent Trump dossier, which was the basis of criminal FAISA warrants to spy on the transition team of a duly elected American president, that dolt Blumenthal is still wasting taxpayers’ money pushing that asinine narrative. I don’t care what side of the political spectrum you are on. If you think this is beneficial to this Republic you need to have your head examined! Incredible that the public at large puts up with this horse sh__! Enough Already!!
Haven’t seen a 11AM to 12 or 11:30AM to 12PM sell off in a long, long time.
SPX fibos on this upward correction at:
2640 (38%)
2644.7 (50%)
2649.5 (62%)
And there’s the downtrend line over the 5 wave move down which could act as resistance right around the 28.6% at 2634.
Agree. And we may be in wave 2 of upward C. Will probably know soon after I post this…
I’m looking at this SPX action and it looks to me more like another 4 of the 5 wave down than it does a correction of the 5 wave down. Either that or…the abc correction back up was completely and utterly anemic??? Either way, it would seem to indicate this market may be falling more soon today. I picked up some VXX for the likelihood. This is EXACTLY where in the last 6 months, a shocker pile driving move up would start within 24 hours or so, blowing away all the bearish counts. Maybe not this time?
Furious support at DJI 24,160.00 shelf.
Bears need to decisively break it for move down to pick up steam….
A classic case of a “managed decline”, frustrating to bull and bear alike. Key is patience for momentum to appear….it should with decisive break of DJI 24,150.00
Interesting! There seems to be quite serious commitment to keep VIX from gapping through 14 as I was suspecting might happen. Frankly, considering the global slide, it should have already gapped pass 14! I wonder why it has not? 🙂
On that note… Treasuries signaling something bad or not good is on the horizon!
30 Year Treasury about to go Sub 2.70% this second at 2.704%.
Due to end of year settlements + Fed to raise discount rate by 1/4 next week + Tax Reform to be Law soon + 3.3% GDP last qtr with rumors of 4%+ this QTR…
30 Year Treasury Yield Should be rising! It’s NOT!
So what is coming at us? This is the question of the day.
Being in TBT….I NOTICED!!! Gad. I’m at least glad to hear “it’s not right”, for what it’s worth! Holding…as long as I have to, honestly. I mean, rates can’t go down for a year or two, CAN THEY??? Fortunately my position there is rather minor, but I hate seeing red.
Because the VIX is computed from SPX option prices, not global market prices? … and SPX is just about doing nothing so far this morn.
I’m waiting for some kind of “2” wave bounce here to set up a better short market/long volatility play myself. The fact it can’t really get up off the floor may be telling!
The point is that complacency reigns supreme…we know however, volatilty and risk are not synonemous…
Agreed, most market participants => complacent (not traders!). But ultimately VIX is primarily to almost exclusively driven by SPX price action. It’s certainly computed strictly from SPX option prices. I suppose at times those prices might move a bit based on non-SPX events, but I believe the standard pricing model uses math based on strictly SPX price action. It’s an area I’d like know a bit more about; how EXACTLY do SPX option seller price their products?
Personally, the ONLY thing that interests me today is the VIX price. So much of what goes on with induces is smoke and mirrors, but there are some critical VIX levels that are going provide reliable clues as to what we might expect going forward, regardless of what else is going on…
Looking at the recent price action in SVXY, it is quite clear that a few smart traders are hauling a_ _ out the back door, while a few clueless ones are storming in the front, or maybe someone covers the hasty exit. If one knew absolutely nothing about markets, the exit of Bozos and Thiel recently should should have got one’s attention, no? 🙂
I know not everyone agrees with me about the role central banks play in back-stopping market price, a position I hold based simply on my observation of price action over the years. I will however readily concede the cluelessness of the American market participant in aiding and abetting bankster racketeering. Today is a great example.
Considering what is going on in global markets, why aren’t American markets down triple digits?! As I said, CLUELESS! But not for long….
1.50% – 2% down in Asia and Europe down overall .25% to .60% so far this morning…
USA should also be down… or headed down.
I guess the BTFD crew could not resist.
UVXY last made a 52 week high just one year ago this coming Friday on 12/8/2016.
It will be most interesting to see what that anniversary brings…
Most of the Asian futures indexes are down from 1.50% to 2.00%…
Will this carry over to the European and USA indexes? I certainly hope so.
Asian markets are finally starting to take notice of the developing bond crisis in China. US markets for the time being remain complacent with most players not only refusing to unwind short vol trades, but doubling down on that remarkable wager! VIX declined yesterday and at first glance that might appear bullish, but viewed in context is more likely bluster…
Reposted from late yesterday, 12/4
——————————————————————————————————————
I need to clarify my comment from earlier today (12/4) regarding the posts here that are political in nature.
Lara you asked if anyone would cancel because of that. I would not. I really don’t mind the occasional perhaps even frequent political commentary especially when it has to do with economic possibilities of the USA or globally. Furthermore, even though I do not need to read all such comments, I do. So I can blame myself if it has bothered me a bit.
It just seems to me that the last few weeks there is much more political commentary regarding the US and its President than at any other time in the last five years I’ve been here. At some point it gets old or becomes too much. However, I would not be in favor of restricting all commentary to the stock market either. I belong to a couple of other blogs where anyone continually posting any comment not related to the technical analysis of the stock market loses their posting privileges. I am not in favor of that. I do enjoy reading all sorts of things and especially enjoy the humorous comments as well. But, as I said, it seems like the last few weeks the political banter has been sort of “over the top”.
So please accept my comment in the most charitable light and accept my apologies if I have offended anyone. I look forward to tonight’s analysis.
Thank you for the clarification Rodney.
I too enjoy reading the comments, and I don’t want to limit it to just TA and markets. This is a really fun community here.
I guess that the number of comments about POTUS is greater now because he is such a controversial figure. He’s a pretty unusual kind of person to have in that position.
woo hoo,,dilly dilly
You win Doc 🙂
But not for long, Doc!