
Price has moved overall higher to begin the new trading week, towards the new target provided in last analysis.
Summary: For the short term, look now for a pullback to about 2,624 or 2,599. This may be a second wave correction. Thereafter, look for upwards movement to continue towards the target about 2,773.
If price makes a new low below 2,557.46, that would indicate a multi week (about 10) correction may have arrived.
Always trade with stops and invest only 1-5% of equity on any one trade. All trades should stick with the trend. The trend remains up.
Last monthly and weekly charts are here. Last historic analysis video is here.
The biggest picture, Grand Super Cycle analysis, is here.
MAIN ELLIOTT WAVE COUNT
WEEKLY CHART
Click chart to enlarge.
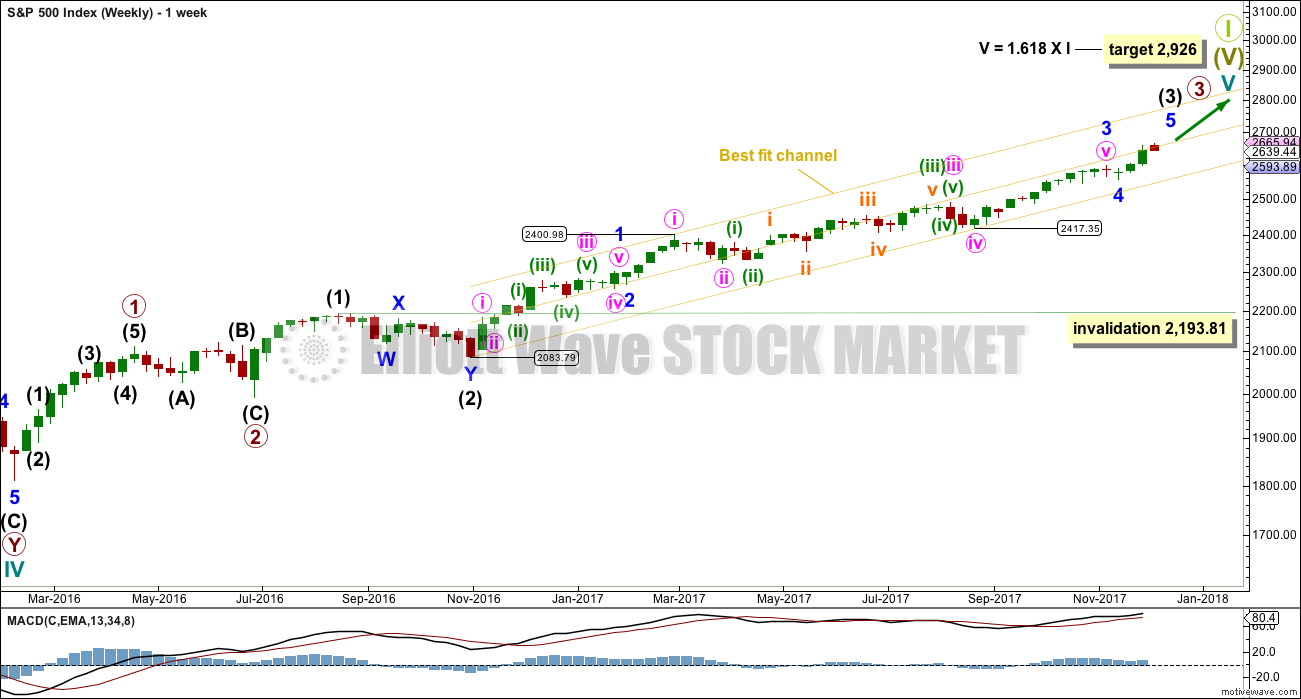
Cycle wave V must complete as a five structure, which should look clear at the weekly chart level. It may only be an impulse or ending diagonal. At this stage, it is clear it is an impulse.
Within cycle wave V, the corrections for primary wave 2 and intermediate wave (2) both show up clearly, both lasting several weeks. The respective corrections for intermediate wave (4) and primary wave 4 should also last several weeks, so that they show up at weekly and monthly time frames. The right proportions between second and fourth wave corrections give a wave count the right look. This wave count expects to see two large multi week corrections coming up, and the first for intermediate wave (4) may now be quite close by.
Cycle wave V has passed equality in length with cycle wave I, which would be the most common Fibonacci ratio for it to have exhibited. The next most common Fibonacci ratio would be 1.618 the length of cycle wave I.
Intermediate wave (3) may now be nearing completion, and a new hourly wave count today looks at the possibility it could be complete at today’s high. When it is complete, then intermediate wave (4) should unfold and be proportional to intermediate wave (2). Intermediate wave (4) may be very likely to break out of the yellow best fit channel that contains intermediate wave (3). Intermediate wave (4) may not move into intermediate wave (1) price territory below 2,193.81.
The yellow best fit channel is redrawn. Price points are given so that members may replicate this channel. This channel is copied over to the daily chart.
DAILY CHART
Click chart to enlarge.
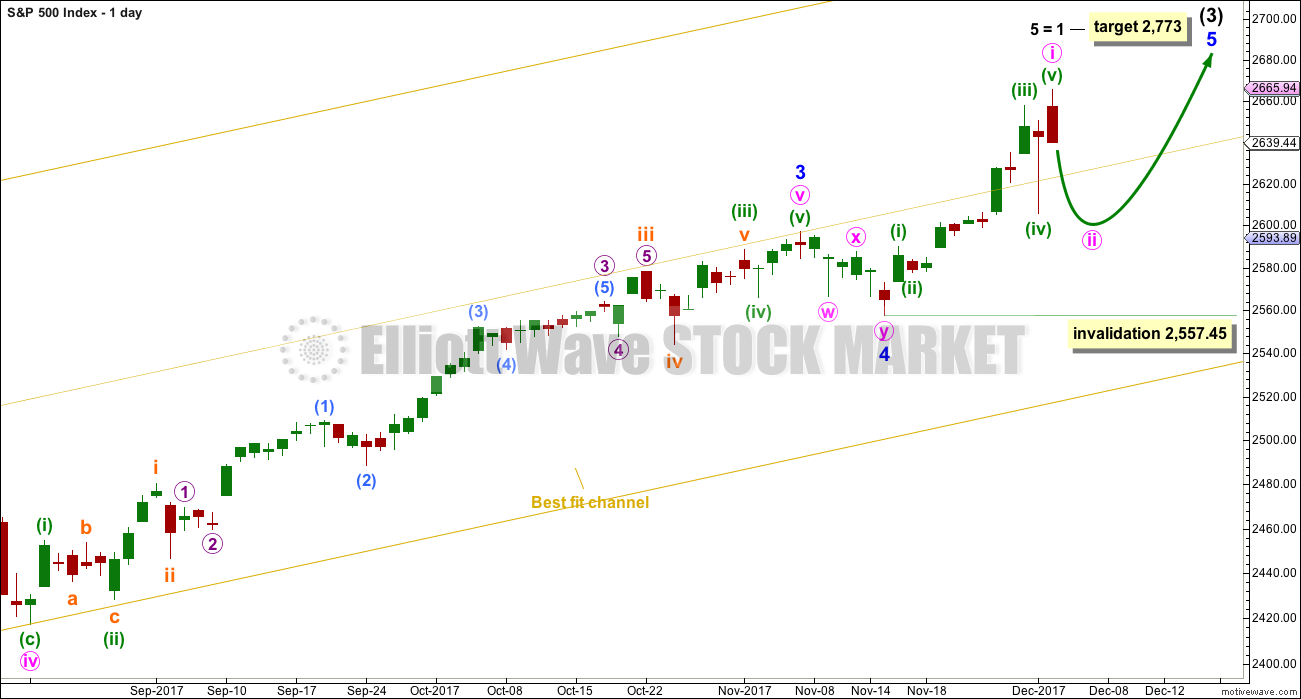
We should always assume the trend remains the same until proven otherwise. Assume that minor wave 5 is incomplete while price remains above 2,557.45.
The target calculated for minor wave 5 expects it to exhibit the most common Fibonacci ratio for a fifth wave. This target would not expect a Fibonacci ratio for intermediate wave (3) to intermediate wave (1). A new lower target is calculated at the hourly chart at minute degree, one degree lower.
Within minor wave 5, no second wave correction may move beyond the start of its first wave below 2,557.45.
HOURLY CHART
Click chart to enlarge.
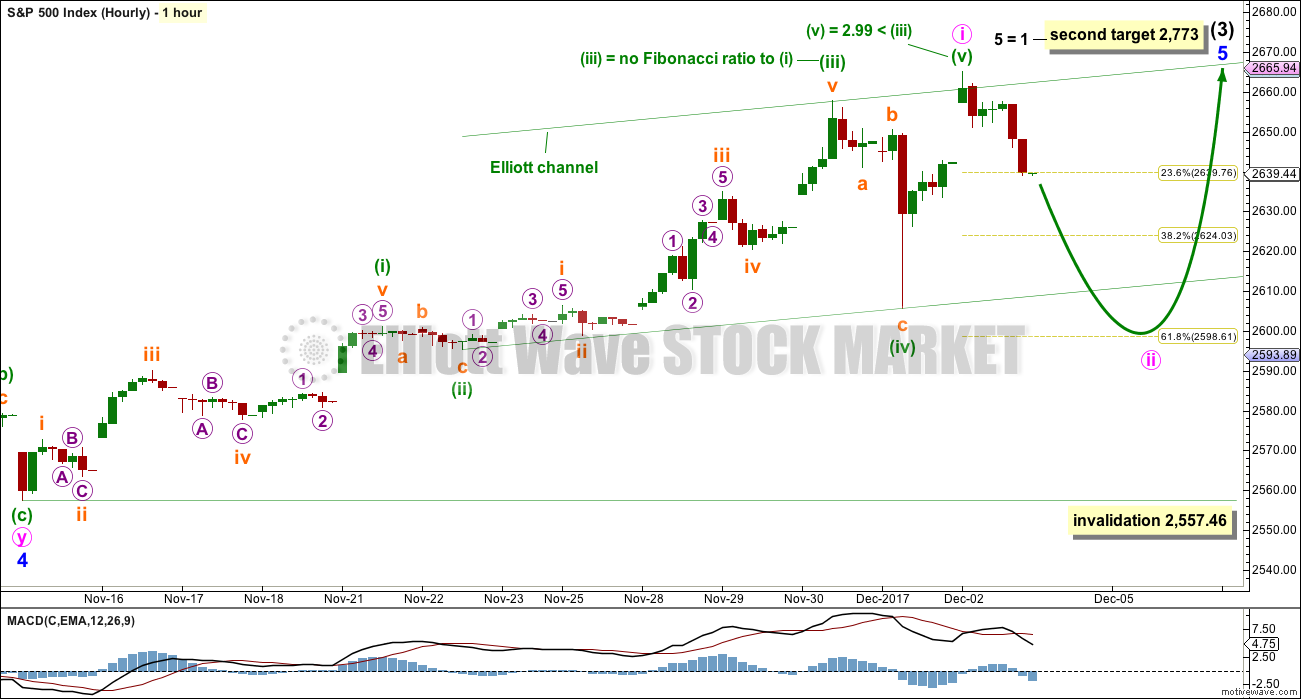
This first hourly chart follows on from labelling on the daily chart.
A five up from the low of minor wave 4 is today complete. This wave count fits with MACD: the strongest momentum within this five up is the end of the third wave of minuette wave (iii), and within the third wave the strongest portion of the histogram is its middle, subminuette wave iii. At the end of the five up, there is some divergence with price and momentum for the fifth wave of minuette wave (v).
With a five up now compete, a three down should follow. If minor wave 5 is incomplete, then only minute wave i may be over at today’s high. Now minute wave ii may take a couple of days to complete. The most likely point for it to end may be the 0.618 Fibonacci ratio about 2,599, but the 0.382 Fibonacci ratio about 2,624 is also a reasonable target.
ALTERNATE HOURLY CHART
Click chart to enlarge.
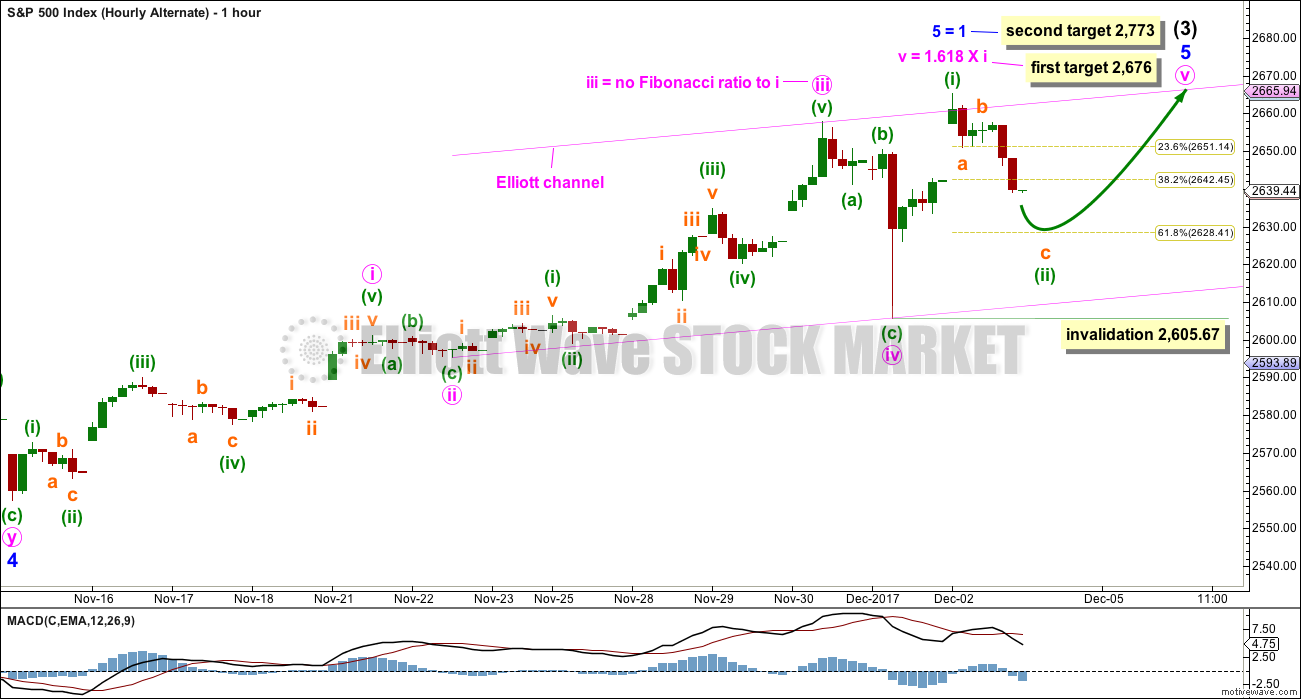
This first alternate hourly chart expects the five up may be incomplete, and within it the fifth wave may be extending. This is also possible and at this stage also fits with MACD.
If the fifth wave is extending, then minuette wave (ii) within it may not move beyond the start of minuette wave (i) below 2,605.67.
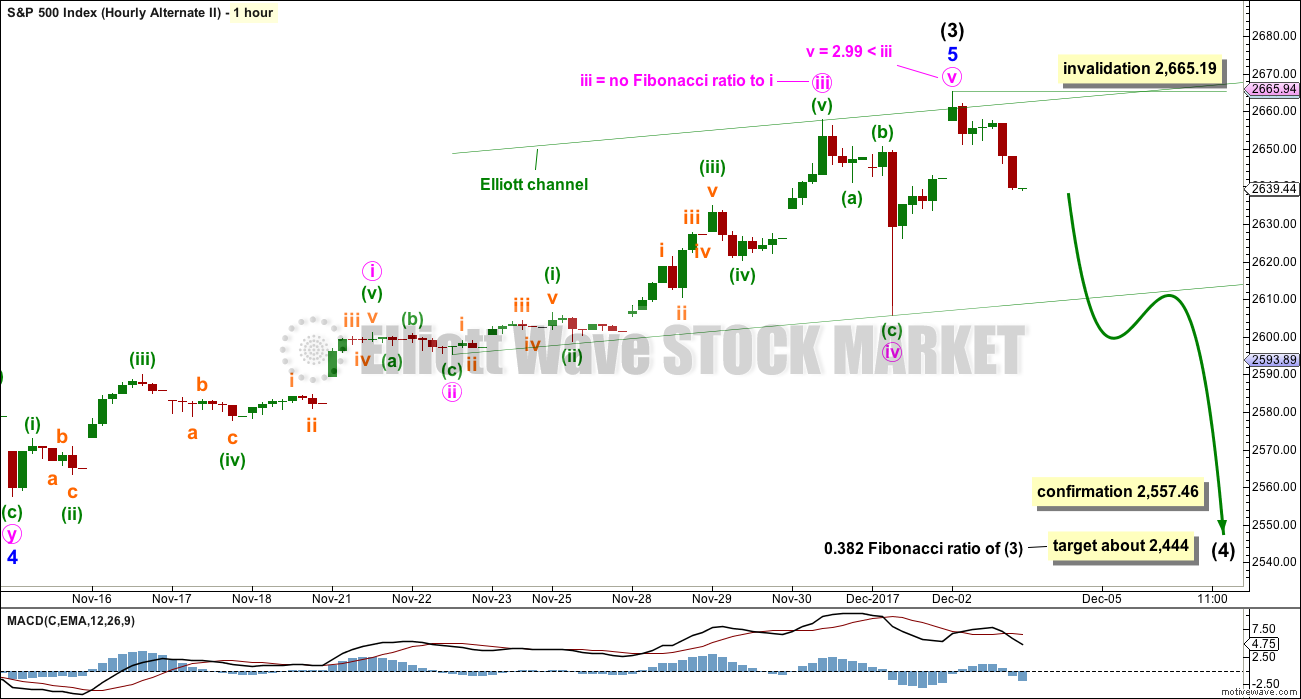
SECOND ALTERNATE HOURLY CHART
Click chart to enlarge.
Because we should always assume the trend remains the same until proven otherwise, this wave count should be considered an alternate while price has not confirmed it.
By simply moving the degree of labelling within the five up from the end of minor wave 4 all up one degree, it is possible to see today that intermediate wave (3) could be over.
If this wave count is confirmed with a new low below 2,557.46, then it would expect a multi week pullback or consolidation for intermediate wave (4) to last about ten weeks or so. If it is a complicated combination or a triangle, then it may be longer lasting, possibly a Fibonacci thirteen or even twenty-one weeks.
At this early stage, the 0.382 Fibonacci ratio of intermediate wave (3) would be a reasonable target.
TECHNICAL ANALYSIS
WEEKLY CHART
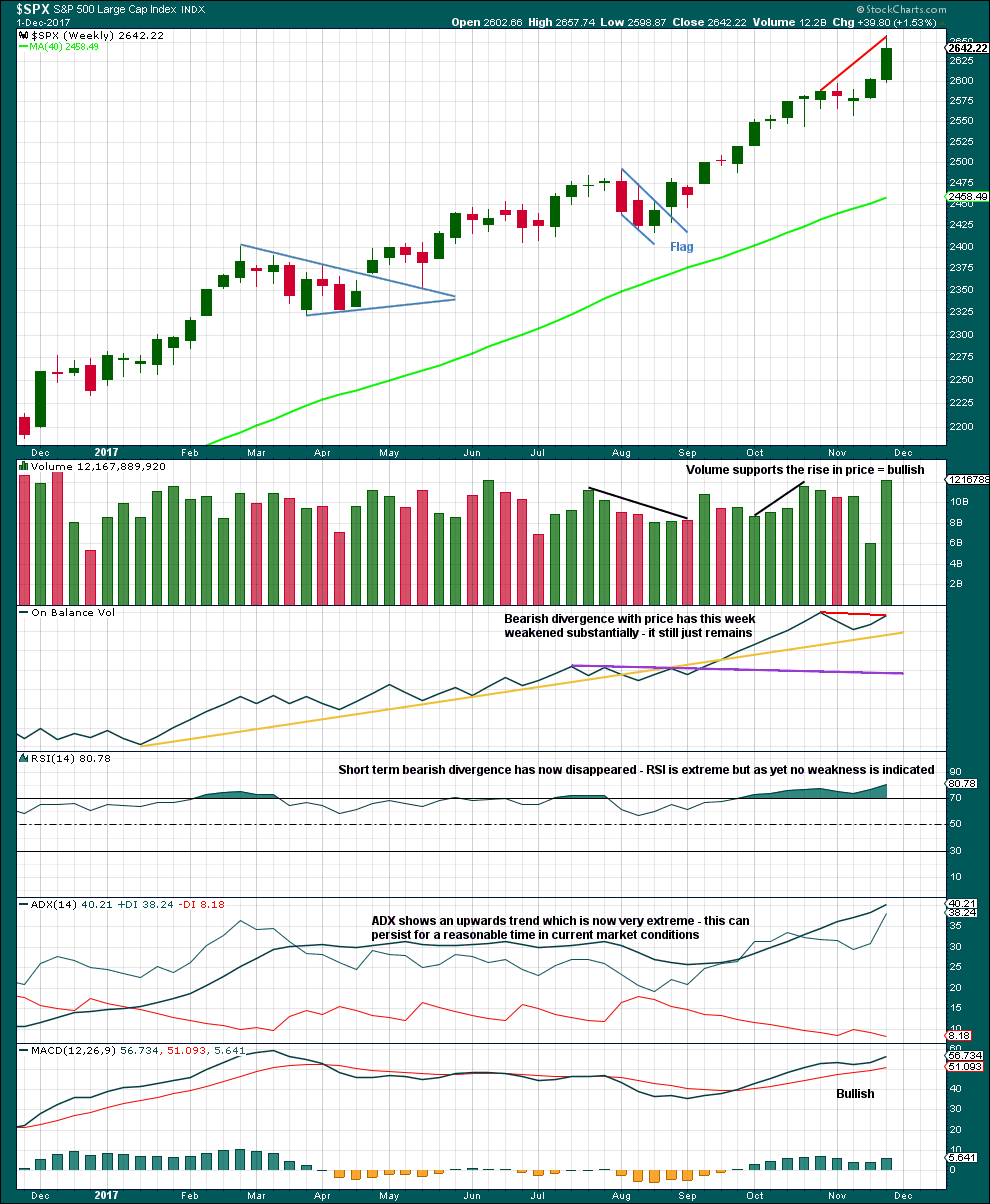
Click chart to enlarge. Chart courtesy of StockCharts.com.
This last week completed the strongest volume for a year, which for an upwards week is very bullish.
The problem with divergence, and one reason why it is hopeless as a timing tool, is that sometimes it just disappears. That is what has happened between divergence with price and RSI. Still, the failure of On Balance Volume to make new all time highs with price is bearish especially if On Balance Volume is a leading indicator.
This trend is extreme, but it could still continue for a while longer. Look for a candlestick reversal pattern or a bearish signal from On Balance Volume.
DAILY CHART
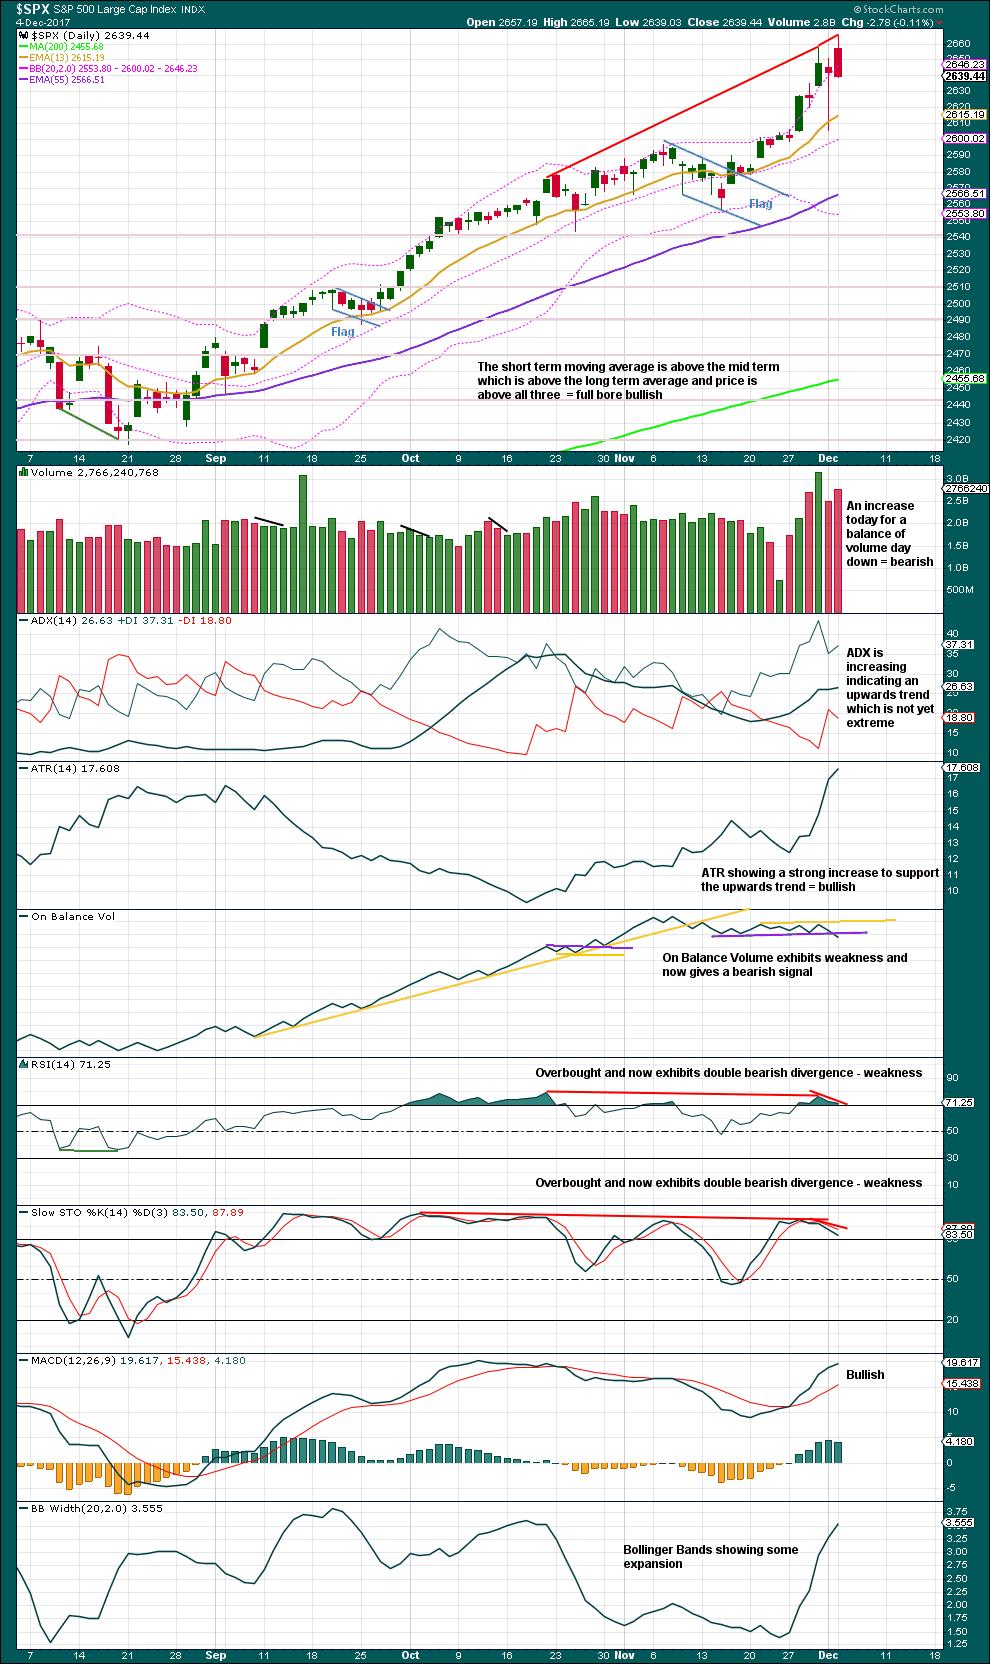
Click chart to enlarge. Chart courtesy of StockCharts.com.
We have a bearish signal now from On Balance Volume. This offers some support to the main hourly Elliott wave count, and the second alternate hourly Elliott wave count, but it cannot distinguish which one of those two wave counts is correct as both expect some pullback. It may offer slightly more support to the second alternate hourly Elliott wave count, which expects a multi week pullback to begin here.
Volume, On Balance Volume, RSI and Stochastics all support the main hourly Elliott wave count, and also offer some support to the second alternate hourly Elliott wave count.
VOLATILITY – INVERTED VIX CHART
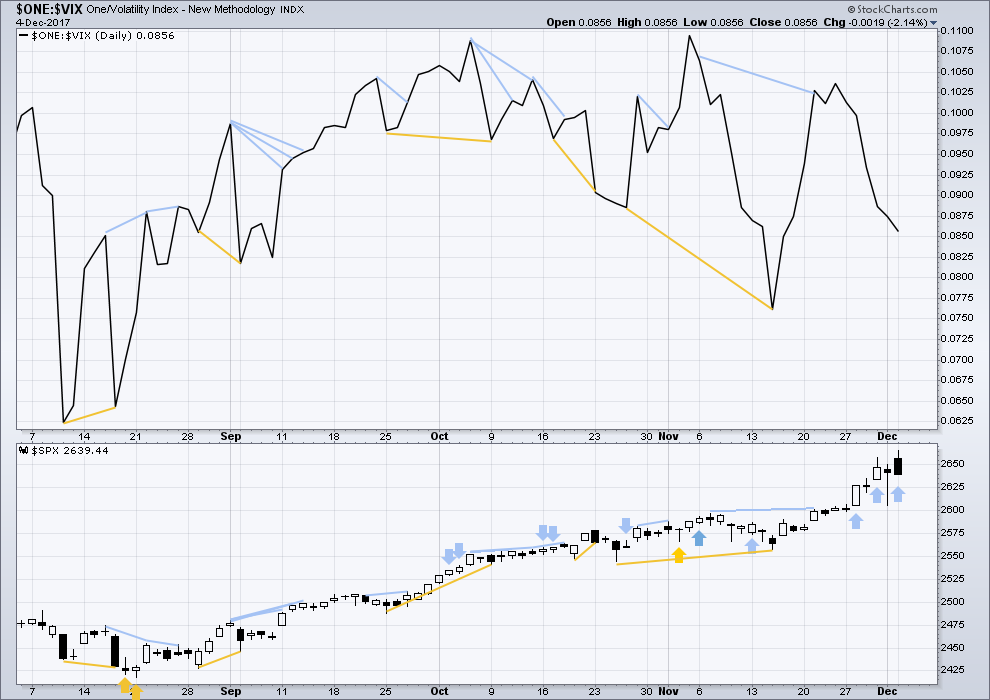
Click chart to enlarge. Chart courtesy of StockCharts.com.
So that colour blind members are included, bearish signals will be noted with blue and bullish signals with yellow.
Normally, volatility should decline as price moves higher and increase as price moves lower. This means that normally inverted VIX should move in the same direction as price.
The last two bearish signals from VIX were followed by a day that saw a sharp pullback. They are considered to have worked.
Another bearish signal is given today from inverted VIX: price has moved higher, but inverted VIX has moved lower. This indicates the upwards movement for price does not come with a normal corresponding decline in volatility; volatility has increased today. This indicates weakness within price, which is bearish.
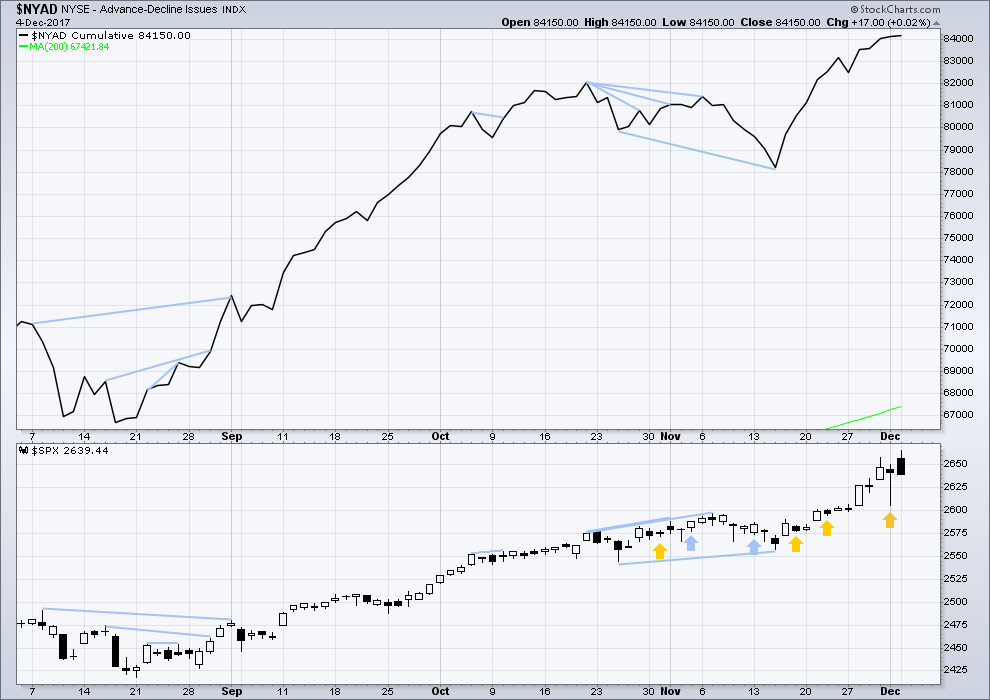
BREADTH – AD LINE
Click chart to enlarge. Chart courtesy of StockCharts.com.
There is normally 4-6 months divergence between price and market breadth prior to a full fledged bear market. This has been so for all major bear markets within the last 90 odd years. With no longer term divergence yet at this point, any decline in price should be expected to be a pullback within an ongoing bull market and not necessarily the start of a bear market.
All of large, mid and small caps last week have made new all time highs. The rise in price has support from market breadth.
Market breadth slightly improved as price moved higher today. The rise in price has support from rising breadth, which is bullish.
DOW THEORY
The DJIA, DJT, S&P500 and Nasdaq have last week made new all time highs. This provides confirmation of the ongoing bull market.
The following lows need to be exceeded for Dow Theory to confirm the end of the bull market and a change to a bear market:
DJIA: 17,883.56.
DJT: 7,029.41.
S&P500: 2,083.79.
Nasdaq: 5,034.41.
Charts showing each prior major swing low used for Dow Theory are here.
Published @ 07:30 p.m. EST.
I need to clarify my comment from earlier today regarding the posts here that are political in nature.
Lara you asked if anyone would cancel because of that. I would not. I really don’t mind the occasional perhaps even frequent political commentary especially when it has to do with economic possibilities of the USA or globally. Furthermore, even though I do not need to read all such comments, I do. So I can blame myself if it has bothered me a bit.
It just seems to me that the last few weeks there is much more political commentary regarding the US and its President than at any other time in the last five years I’ve been here. At some point it gets old or becomes too much. However, I would not be in favor of restricting all commentary to the stock market either. I belong to a couple of other blogs where anyone continually posting any comment not related to the technical analysis of the stock market loses their posting privileges. I am not in favor of that. I do enjoy reading all sorts of things and especially enjoy the humorous comments as well. But, as I said, it seems like the last few weeks the political banter has been sort of “over the top”.
So please accept my comment in the most charitable light and accept my apologies if I have offended anyone. I look forward to tonight’s analysis.
Thank you for the clarification Rodney.
I too enjoy reading the comments, and I don’t want to limit it to just TA and markets. This is a really fun community here.
I guess that the number of comments about POTUS is greater now because he is such a controversial figure. He’s a pretty unusual kind of person to have in that position.
Joe, send me an e-mail…
Verne, I don’t believe I have your email address (searched outlook).
If you want to be in contact regularly offline, have Lara email me yours or to forward an email from you.
As to your post on the Lows…
So if Fridays lows are taken out in the indexes, VIX will spike or move to above 17+… I have this correct, right?
If yes… then I will be able to exit VOL trade with a very good profit.
Something is up… as 30 year Treasury which I did not look at today… until now is trading at a
2.734% yield at the moment. I know this past Friday it traded up to about 2.86%ish.
A 2.734% yield at this moment in time… makes no sense!
I’ll email both of you each other’s email address.
Thanks
I think we will continue to see strong resistance at around 14 so I am cashing in short term trades as that pivot is approached. A move above should see a test of the recent 17 high. If we gap past 14 we could go higher before an interim high.
There is a lot of money riding on whether or not last Friday’s lows hold and it seems to focused in a continuing short vol trade. Someone, or something, is absolutely convinced that low will NOT be taken out. Remarkable really. I now am expecting a gap skyward in VIX, particularly if futures take out those lows overnight….
I remember the old days where final 20 min price swoons were a regular event.
AH longing for the good old days!
Price action in VIX suggesting that there is a cohort of traders who are convinced that last Friday’s lows will hold and a significant bounce will follow a retest of that low. They are persistent…I will give them that… 🙂
Verne, I believe those tests occurred yesterday and certainly this morning.
Nope. Not for the indices Joe.
I thought you were talking the VIX.
All indexes negative at the same time… finally.
BTW: Take a look at every index on a daily chart.
Each have a very bearish candle stick pattern using today and last 2 days.
Looks and feels like all these indexes are all finally going to pull back.
To mean a correction, extended correction (Very needed) or that sell the news correction and major adjustment, etc., etc. I have been posting on.
I hope these shallow/nothing pull backs are finally over and done with.
We shall see!
This is looking like a 5 down. Implying (?) this is the start of a larger correction (i.e., a 5-3-5 zigzag down or other). Looking forward to tonight’s analysis!
Solid bounce off the 61.8%, right where we might expect this 5 wave down to end. But will it hold???
VIX is on the move… broke back over the 200 DMA, looks like VIX 17+ may be in the cards over the next few days. 200 & 100 dayMA stress tested over the last few days. The fact back over again, I think means 17+ may be had.
$DJI has finally broken down, lets see how far it can go.
Watch out for a “2” bounce up here soon though. I’ll be assessing the short side and/or long volatility as that sets up, myself.
Oh ye of little faith…! 🙂
My “faith” is only in the elliott wave structure and internal fractal geometry of the market!
Although I said “Ye”, which is plural Kevin, my comment was directed to Joe regarding our ongoing conversation about VIX price action. It would never remotely enter my mind to tell you how or what to trade! 🙂
Notice: I have deleted one comment from Joseph. No name calling please. It breaches the comments guidelines.
Otherwise… as you were folks. Well done on keeping it (mostly) civil for a very controversial topic. Very interesting comments below.
Sorry, but I call them… as I see them.
Controversial times. I will strive to tone it down as well, as I’m sure this isn’t meant to be a political forum.
No worries guys. Like I’ve said before, we’re all adults here and should be able to discuss controversial topics in a polite way. Nothing is off the table, as long as my comments guidelines are adhered to.
Sometimes not saying something is hard, but the right thing to do 🙂
What a pathetic story from price so far today. Small, sideways, range bound…. just weak and pathetic.
But…
The interesting thing to note here today is that it now looks like a small five down may be completing. And if that is what happens, then it tells us something important.
It tells us there has been a trend change… but at this stage it can’t tell us of what degree. It may be minute degree (main hourly chart) or it may be intermediate degree (second alternate hourly chart).
Because we should always assume the trend remains the same until proven otherwise, assume it is minute degree (main hourly chart) until price tells us it cannot be by a new low below 2,557.46.
aaaaannnnd… a new low below subminuette iii now sees a five down complete.
I will be publishing only two wave counts today, main hourly and the second alternate
DJI filling gap from last Friday could be important if we are looking at an exhaustion gap….
SPX price at a crux: with a push up here it would appear the up then down today is subminuette 1 and 2 of minuette 3 of minute 5 of minor 5. If the low from this morning gets broken…over to main or alternate #2, the more bearish counts.
I was NOT expecting this SPX price break in the upward direction. Given the 3 hourlies, and the weak opening action, I expected a sharp jag down. This is rather bullish for the short term as I see it. Along with the situation in the NDX, which is seemingly finished with its correction and plowing upward fast.
All I see on 20 min chart for NDX is a series of 1, 2’s
Maybe!!!
This sideways consolidation triangle-like movement was entered from an impulsive looking decline. Chances are it breaks to the downside…
I continues to dig into the short vol story and it gets curioser and curioser. It turns out a number of bank employees lost their jobs in 2008 because thy ignored risk guidelines and were way too short volatility when things imploded. It also turns out that quite a number of them ended up at hedge funds where the lion’s share of this business of shorting vol to generate returns has been going on with reckless abandon. As vol has headed lower, they have increased their notional short to generate the same level of returns and this has led to the remarkable situation we are in today. I have to smile when I hear people talk about how this is going to be unwound. Let me explain something to you if you will let me. These cretins have NO INTENTION of covering these positions. They have made good money the last eight years and fully intend to walk away from the ensuing carnage as they did during the last crisis and leave taxpayers, and this time I suspect, retail investors holding the bag. I had never before heard about the fired bankster angle of all this but it makes perfect sense.
Hopefully this time a lot of them will be going to jail….but I doubt it…. 🙁
The exchanges or their brokerage accounts will force them to cover…
Because all these go through regulated accounts. They will get margin calls on open exposure in the accounts or on the exchange. That’s how the system works.
If the brokerages were really following regulatory strictures, they would never have allowed a situation like this to arise. The fact is that they were only too happy to take the commissions and look the other way. They are complicit.
The accounts would pick up the exposure… it’s a different part of the firm from the people collecting the commissions.
You would not be able to get away with that kind of exposure in you personal account. At soon point you will be getting a phone call… a margin call.
Exchanges have to provide balance or meet margin daily.
Also: Looks like the VOL trade is dead for today.
Complicit!!! Word of the year, for darn good reasons.
I’m sure the massive deregulation of the financial industry by Trump and his corporate kleptocrats will solve those problems and risks, Verne! Lol!!!! The mad king fiddles while his minions plunder.
That has nothing to do with Open Exposure in Trading Accounts of Brokerages or in Exchanges. This stuff is the norm for a long time… Decades. Humans used to do it… now mostly technology with human audit.
There you go with your Liberal stuff… typical, even trying to add it to trading accounts.
Deregulation is wonderful, for institutions that profit from fraud.
Lets see how you will feel when your job or business is regulated out of existence.
I never worked in a business that routinely utilized fraud as a means of making profit, like many in the financial space routinely do (I was in embedded and server system software and later application security software, extremely large and very small companies. There is some fraud in the security space for sure; my security company did participate in that, we sold very effective technology to customers who repurchased during my tenure at an astounding 98% renewal rate; no fraud!). Hence the urgent need to roll back regulations in the financial arena. The current administration is in the business of providing aid to fraudsters, aid to Russia, and aid to the uber rich. And enabling corporate pillaging via rollback of environmental regulations as well. And giving away land for commercial exploitation (today’s news: Bear Ears National Monument). They are succeeding beyond all expectations!
Wow… I have no further comment!
oops, serious typo, SORRY: “my company DID NOT particiapate in that” was what I intended.
No offense Kevin, but it was Obama’s FED hold handing policies that created the social and financial divide, and Russia is very very obvious witch hunt and diversion for the public.
Chris, it is “very obvious” that Trump is deeply compromised by the Russian gov’t/mafia. Deeply. He was developed by them for well over 5 year prior to the election. Steele (long time MI6 and SIS agent, with impeccible credentials) unearthed comprehensive intelligence on the breadth and depth of the compromise. They developed Trump starting way back, 6 years back minimum. He’s received (absolute fact here, not “intelligence”) a $45M payoff from the Russian oligarchy via a rediculously priced home sale to them. The breadth and depth of Russian interactions throughout and after the election is astounding. Intelligence services ALL OVER THE WORLD picked up on the unusual communications between Trump people and various Russians, so much so they approached the US services asking “what the eff is going on here??”. Then you have Trump’s BEHAVIOR relative to the Russians; completely conciliatory. He made DEALS. He will revoke sanctions: that was a DEAL. His energy policy is 1000% supportive of Russian economic interests, NOT American interests (except the oil and gas industry, period). Read “Collusion”. If you refuse to read it, you are merely refusing to look at the data. The data speaks VOLUMES. Look at the data.
What Planet are you from???
Trump was very well know for decades here in NY/NJ, his view points very well known for that time as well. Been covered by the media since the 1970’s. He talks like 90% of the males who were born & raised in the NY, NJ area. I know, I am one of them.
He didn’t just crawl out from under a rock!
You Kevin have been deeply brain washed! Please get some serious help.
I have no further comments for you ever!
BTW: Did you forget about the 145 Million the Russians gave to the Clinton Foundation? Or Hillary’s stupid ass Red Reset Button for the Russians?
The American People have no issues with the Russian People, I personally have liked every one I met.
The cold was has been fought already… We don’t need to start another for all these ficticious reasons.
That’s what the Homes have been selling for to all who buy them.
That’s the Life of the Rich! What you think all the Rich Liberals you adore pay for their homes? The same if not more than!
I’m not a liberal. I’m not a conservative. I’m not a democrat. I’m not a republican. I am a citizen. I review the data from the world around me, and try to consider it objectively. I’d urge you to do the same, at this time when we have a president who desperately want the entire country not to. Mueller is now also following the money trail, which Trump deperately does not want and cannot allow if he is to remain without charges. Hence, my best guess is that before the end of the year, Trump will fire Mueller, and feed America the line “it’s all fake”. No. Mueller is one of the best prosecutors of our time, and he has assembled a crack team. They would not be wasting their time if there wasn’t tons of smoke (and they’ve already issued indictments and we already have one guilty plea!). They are incrementally exposing Trump. If there’s NOTHING TO HIDE, then Mueller should be allowed to proceed, correct? In fact, allowing Mueller to proceed would be in Trump’s best interests, correct? Just watch what happens, and please, strive to learn about the facts, rather than just adopt the postion Trump has trained you to adopt: “lies!! lies!!!”. Please. Isn’t ensuring we DON’T have Russian agent in the WH so critical that we MUST let Mueller fully investigate this? I think so; any sane American would have to agree, in my opinion. If Trump is innocent, he won’t get charged will he?
Re: Clinton: she is not in power. My concern about her is about 1/10,000th of my concern about the potential duplicitous nature of the man sitting in charge of the executive branch, at this point in time. Let’s not play the silly “look at Clinton!” card. That’s worse than a red herring at this point in time. Clinton is baking cookies; she has no power to sell out America at this point in time. Trump does, and there’s lots of EVIDENCE that he has and is. Let’s see what Mueller finds, shall we?
Actually, thanks to senator Ron Johnson from Wisconsin, at the last minute they made some changes to the bill that are good for small pass through businesses.
You now also get a better deal now if you are a trader and opt for an LLC as opposed to either capital gains or investment or ordinary income.
50% retrace at 2635.7
61.8% at 2628.8
76.4% at 2620.2
of Friday’s low to yesterday’s high.
(all #’s approximate)
ABC corrective move in /NQ looks complete (20 min Chart) after a completed 5 waves down…
Next is (should be) new 5 wave move down.
Very easy to count this one… very rare IMO.
??? Sorry my friend but all I see in NDX is a corrective mess in progress, against a backdrop of a generally raging bull market. Highly overlapped waves. Waves within corrections do (often) have 5 wave structures; that is not informative re: the nature of the broader action. Caveat: I’m not an expert. But I think I can say with reasonable confidence that nothing about the action in NDX since Nov 28 indicates a new impulsive move down. Look at a 20 minute; see how it’s overlapped 3 or 4 times now? Corrective.
The Futures NQ…. Not NDX. Its clear in NQ
If waves can be believed… you have to believe what you see in NQ as well.
Looking at NDX, my best take is that it’s done a WXY, now complete, and the current push up is the launch of a new 5 wave up. That’s what it looks like to me.
Lara,
Please elaborate on the following comment you made yesterday. I am not sure I understand. I am not in favor of this service going to a once a week service.
——————————————————————————————————
Lara wrote:
December 4, 2017 at 3:05 pm
I am really beginning to think that my publication of hourly charts on a daily basis, giving blow by blow accounts, is making members here focus on the minutae. On volatility which should be ignored. On the little swings and movements.
And not on the bigger picture.
And I think this leads to overtrading. Not seeing the forest for the trees.
And I’m thinking only once a week with daily and weekly and monthly charts may be a better approach.
Reply
I remember when Lara published 5-minute charts every day. That might qualify as minutiae, but certainly not hourly charts!
Some here chose to trade short-term for their own good valid reasons. Some chose to trade volatility for their own good valid reasons. Those who focus on minutiae do so for their own good valid reasons. Those who want to tune it out and focus only on the bigger picture can easily do that.
Lara and Cesar can make their own business decisions, but if hourly charts went away I probably would too.
My .02…
I happen to agree with Rodney as well Lara. The market warrants constant appraisal and analysis, which I believe fosters the appropriate risk management. Within respect of a reasonable work load, updates once or twice daily should suffice. I also believe because we are nearing the end of the cycle, people need advice and guidance like yours. Overtrading should be expected of those who subscribe to the blog, and just a part of the commitment to the capital markets. Furthermore, everyone is going to need as many friends as possible (next 4-6months) as the worst time in modern times will unfold.
At this time I have no plans to change this service to once a week.
I am considering providing a once a week only update as a separate service with a lower price.
The problem I have (and I may be too open and honest here) is that as this market continues it’s climb upwards the membership is falling. It’s falling because I think people are buying and holding. They’re not needing my daily blow by blow account.
The problem is that if the membership falls below a certain point, then it’s just not going to be economic for me to keep doing this. My time would better be spent trading and supporting Cesar in his trading by giving him my analysis.
I know that when intermediate (4) and then primary 4 arrive the membership will improve again. Because it always goes up when price falls hard.
And when the bull market is over and the bear market begins it will rocket up. It was at it’s healthiest during Cycle wave IV.
But that may be a long time to hang in there.
I, for one, appreciate your openness, Lara. Thank you!
A weekly $SPX update at a lower price point, like you do for US Oil, might be just the ticket for many.
With such a one-a-week product, let me suggest some kind of “summary” for the true buy and holder (my son is one), that indicates level of risk of the initiation of a major bear market (ala your analysis of major tops a few weeks ago). Something that can clearly and easily alert people like him that “hey, NOW is the time to cash in for a while and watch this thing likely go over a cliff”. Incredibly valuable (to those will will listen and act!). That info in such a weekly needs to be “above” the level of the details of the wave count, rationale, etc. That might make it quite attractive to the “average” investor, and would be something that I, for one, would be happy to promote to anyone/everyone with significant $$ in the market.
Thanks for the explanation. I sure hope no changes are necessary. Did you ever consider there may be members who are tired of reading all the political chatter (unrelated to SPX) that goes on here lately? I prefer to stick to technical analysis and trading tactics / strategies.
I’ll drop it Rodney. Thanks for speaking up, seriously.
No, I didn’t. Thank you for speaking up Rodney.
Is there anyone else here that reads comments who is put off by politics?
Is there anyone here who would actually cancel their membership, or avoid the value found in comments, by the political chat?
Well to make it a bit more interesting (as market goes one way)… maybe we should submit ideas (from us to you) for a handful of individual stocks (5) initially priced in the $8 to $19 range with good volume and chart patterns… that we can all trade. Then we can follow & trade to higher prices.
I say that price area for 2 reasons… Most of us can buy 500/1000 or maybe 2000 shares of to group at any time. Also, Lara in this price area initially… you will get the most subscribers. If your trading stocks north of $30 to $1,000… that’s a small number of people and they probably don’t need your advice.
The indexes just go up… an not easy to trade because there is never a correction anymore or not enough of corrections.
Just a thought and I would be happy to research and find some to consider.
Really interesting idea, Joe. I would find that potentially very useful
Interesting. I personally avoid all stocks under $20 like a plague, and prefer a lower limit of $30. In fact, I focus on a relatively small range of stocks from larger companies that have general business stability (reduced risk of a major “stochastic shock” in price from a singular bad event for the company) so that I can “learn” their behaviors (to the degree such is possible), and use them as my “tools” for trading the wave count, in coordination with their own set ups. I try to get a few from across the sectors, for obvious reasons. Ergo, I would find this of no value to me personally.
Starting in that 20-30 price range defeats the purpose and my idea.
So I would not participate in that research for stocks… if that initial range is decided on.
Thanks for your viewpoints Lara.
I like the idea for an Elliott Wave service that focuses on trades and trading.
Also, Elliott Wave classes, including Motive Wave with chart sharing.
FWIW, there is a well known person (a CNBC personality) that offers these services. Might be worth a look as to what he is doing if you are thinking about broadening your offerings.
Thank you for you openness and dedication!
Thanks very much for all the ideas guys!
One of my bottom lines ATM has to be that any weekly offering must be on the four markets I am currently analysing regularly; S&P500, Gold, US Oil and Silver. I can present the analysis in a different way, but I really don’t want to be adding more markets to the workload.
Because the last time I did that I thought it would be short term, now it’s long term.
Analysing markets as a paid service takes time away from our own trading and analysis. And trading takes time as you all know.
So I’m thinking some kind of summary package for the markets I’m currently analysing… we’re working through some ideas there.
First, a few tweaks to the websites to maximise what we’re currently doing.
*edit to add: If I had software that could do a quick sector rotation analysis then I could offer picks for stocks, which wouldn’t be much more work to my S&P analysis. That would be a good one….
*goes off to search on Google*
Really Good Article explaining the reality of valuations. Here is some…
“The problem for investors is not being able to tell whether the next correction will be just a “correction” within an ongoing bull market advance, or something materially worse. Unfortunately, by the time most investors figure it out – it is generally far too late to do anything meaningful about it.
As shown below, price deviations from the 50-week moving average has been important markers for the sustainability of an advance historically. Prices can only deviate so far from their underlying moving average before a reversion will eventually occur. (You can’t have an “average” unless price trades above and below the average during a given time frame.)”
“Notice that price deviations became much more augmented heading into 2000 as electronic trading came online and Wall Street turned the markets into a “casino” for Main Street.
At each major deviation of price from the 50-week moving average, there has either been a significant correction, or something materially worse.
This time is unlikely to be different.
Just how big could the next correction be?
As stated above, just a correction back to the initial “critical support” set at the 2016 lows would equate to a 29.1% decline.
However, the risk, as noted above, is that a correction of that magnitude would begin to trigger margin calls, junk bond defaults, blow up the “VIX” short-carry and trigger a wave of automated selling as the algorithms begin to sell in tandem. Such a combination of events could conceivably push markets to either strong support at the previous two bull market peaks or to support at the 2011 peak which coincides with the topping formations of 2000 and 2007.”
“Such a correction would entail either a 41.1% to 49.2% decline.
I won’t even mention the remote, but real, possibility of a nearly 75% retracement to the previous lows of the last two “bear markets.”
That can’t happen you say?
It wouldn’t even match the decline following the 1929 crash of 85%.”
“Furthermore, as technical analyst J. Brett Freeze, CFA, recently noted:
“The Wave Principle suggests that the S&P 500 Index is completing a 60-year, five-wave motive structure. If this analysis is correct, it also suggests that a multi-year, three-wave corrective structure is immediately ahead. We do not make explicit price forecasts, but the Wave Principle proposes to us that, at a minimum, the lows of 2009 will be surpassed as the corrective structure completes.” ”
Technically Speaking: This Is Nuts…………. go to zero hedge to read full A.
That future is a big, big chunk of the reason I’m here and the value I believe I (we) get. Study Lara’s market top material published a month ago. We’ll know it’s “approaching”, and be able to prepare (in all likelihood, yes nothing is ever certain). I intend to make a boatload of money in that market collapse. I intend to make sure my son with his money is clear of the market as that collapse sets up. However…it’s at least many months, and probably a few years, away still.
There are many opinions on wave counts… another (decades) has 5’s at multiple degrees as complete in DOW, S&P & DJT once the lows of Thanksgiving week are taken out. Currently all on Throw-overs of EW trend lines.
It has been my experience that many times here is very correct/spot on and disclosing other counts seen and some times the one above has been spot on and very clear… other times wrong and vague (then claims called).
Please Note: this time very clear… unknown if at this point correct. But very clear that if those lows taken out Bull is over (day, week month).
I raise these points because you just never know. Must be prepared at all times at this juncture.
With regards to first hourly alternate, on 1 hour chart looks like 3 wave structure up which raises possibility of ending diagonal.
Yes, this is true 🙂
Faster than lightning! That’s why I am called “Lightning Rod”.
Now see here Tas, this guy actually thinks he’s faster than you so its your job to catch him, got it?
ha ha good one Verne,,, or should I say dilly dilly