
For the very short term, the hourly Elliott wave analysis expected a pullback for a small fourth wave. With price remaining above first wave price territory, all Elliott wave rules are met and the wave count has the right look. The pullback for Friday was almost exactly what the last analysis expected to see.
Summary: The new next Elliott wave target is now at 2,676. If price keeps rising through this target, or if it gets there and the structure is incomplete, then the next target is at 2,773.
These targets are for a mid term end to the upwards wave. When this structure is complete, then the analysis expects a pullback / consolidation to last about 10 weeks.
Some indicators are extreme and some weakness is beginning.
Always trade with stops and invest only 1-5% of equity on any one trade. All trades should stick with the trend. The trend remains up.
Last monthly and weekly charts are here. Last historic analysis video is here.
The biggest picture, Grand Super Cycle analysis, is here.
MAIN ELLIOTT WAVE COUNT
WEEKLY CHART
Click chart to enlarge.
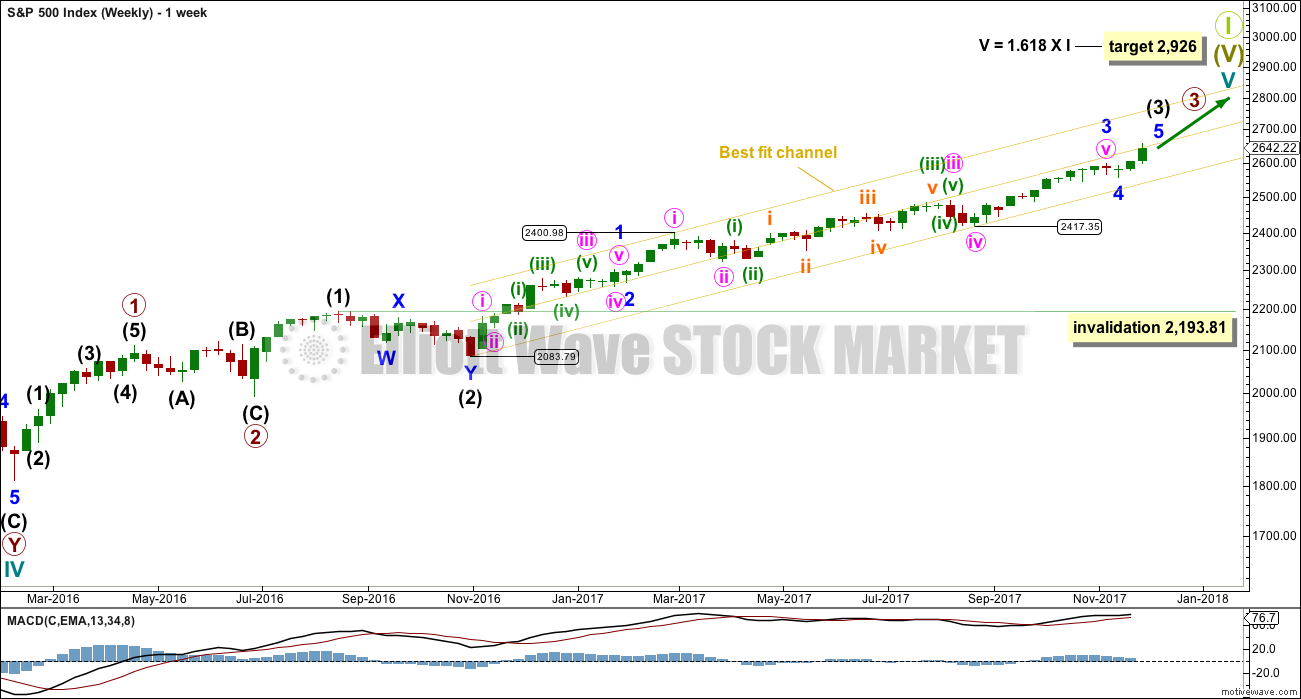
Cycle wave V must complete as a five structure, which should look clear at the weekly chart level. It may only be an impulse or ending diagonal. At this stage, it is clear it is an impulse.
Within cycle wave V, the corrections for primary wave 2 and intermediate wave (2) both show up clearly, both lasting several weeks. The respective corrections for intermediate wave (4) and primary wave 4 should also last several weeks, so that they show up at weekly and monthly time frames. The right proportions between second and fourth wave corrections give a wave count the right look. This wave count expects to see two large multi week corrections coming up, and the first for intermediate wave (4) may now be quite close by.
Cycle wave V has passed equality in length with cycle wave I, which would be the most common Fibonacci ratio for it to have exhibited. The next most common Fibonacci ratio would be 1.618 the length of cycle wave I.
Intermediate wave (3) may now be nearing completion. When it is complete, then intermediate wave (4) should unfold and be proportional to intermediate wave (2). Intermediate wave (4) may be very likely to break out of the yellow best fit channel that contains intermediate wave (3). Intermediate wave (4) may not move into intermediate wave (1) price territory below 2,193.81.
The yellow best fit channel is redrawn. Price points are given so that members may replicate this channel.
DAILY CHART

Click chart to enlarge.
Minor wave 4 may now be complete. It will subdivide very well as a double zigzag. This provides only a little alternation in structure with the single zigzag of minor wave 2. There is also poor alternation in depth: minor wave 2 was very shallow at only 0.16 of minor wave 1, and minor wave 4 would be only 0.12 of minor wave 3. Alternation is a guideline and not a rule; it is seen more often than not, but not always.
The target calculated for minor wave 5 expects it to exhibit the most common Fibonacci ratio for a fifth wave. This target would not expect a Fibonacci ratio for intermediate wave (3) to intermediate wave (1). A new lower target is calculated at the hourly chart at minute degree, one degree lower.
Within minor wave 5, no second wave correction may move beyond the start of its first wave below 2,557.45.
HOURLY CHART
Click chart to enlarge.
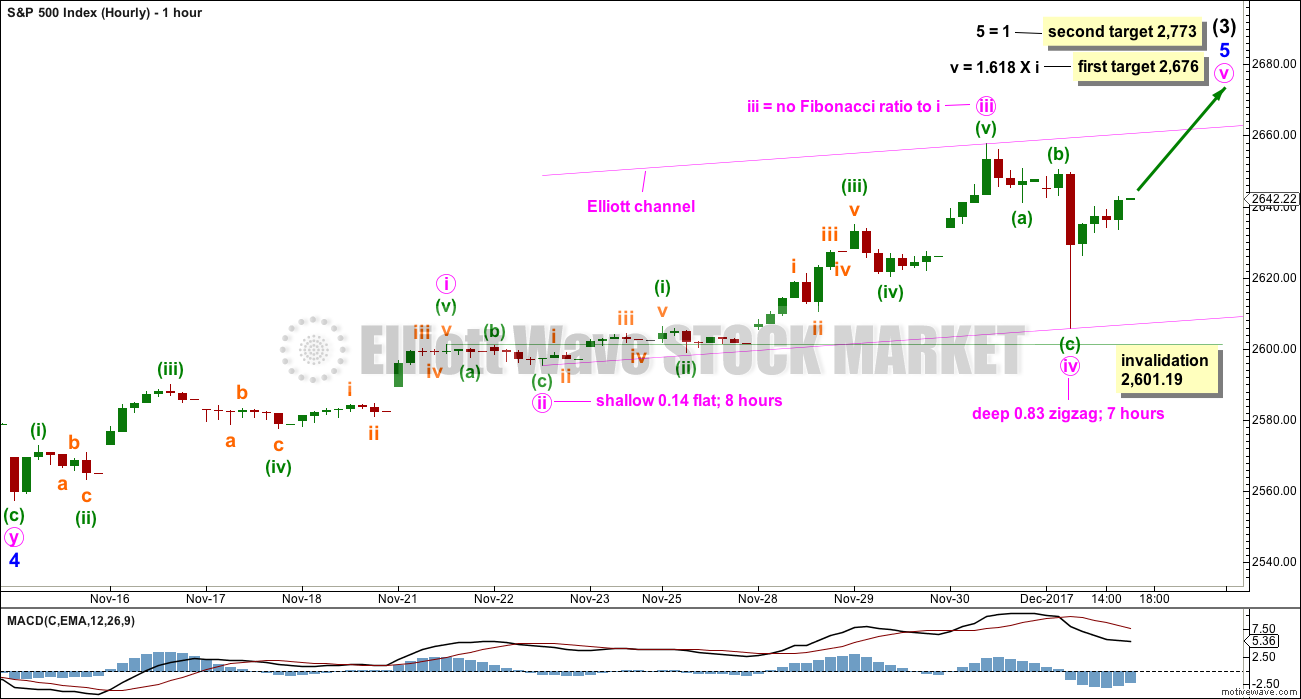
The new target is reasonably lower than 2,773, which was expected. The new target may see intermediate wave (3) end at all degrees fairly quickly next week. This is possible.
The channel about minor wave 5 is now redrawn using Elliott’s second technique. Minute wave iv has remained above minute wave i price territory.
The hourly candlestick to end minute wave iv has a very bullish long lower wick. There is perfect alternation and excellent proportion between minute waves ii and iv.
If minute wave v were to only reach equality in length with minute wave i, it would be truncated, so the next Fibonacci ratio in the sequence is used to calculate the new target.
If it continues further, then minute wave iv may not move into minute wave i price territory below 2,601.19. If this invalidation point is breached before a new all time high is seen, then my analysis of minute waves i through to iii is wrong. It may then be possible that intermediate wave (3) could be over.
ALTERNATE HOURLY CHART
Click chart to enlarge.
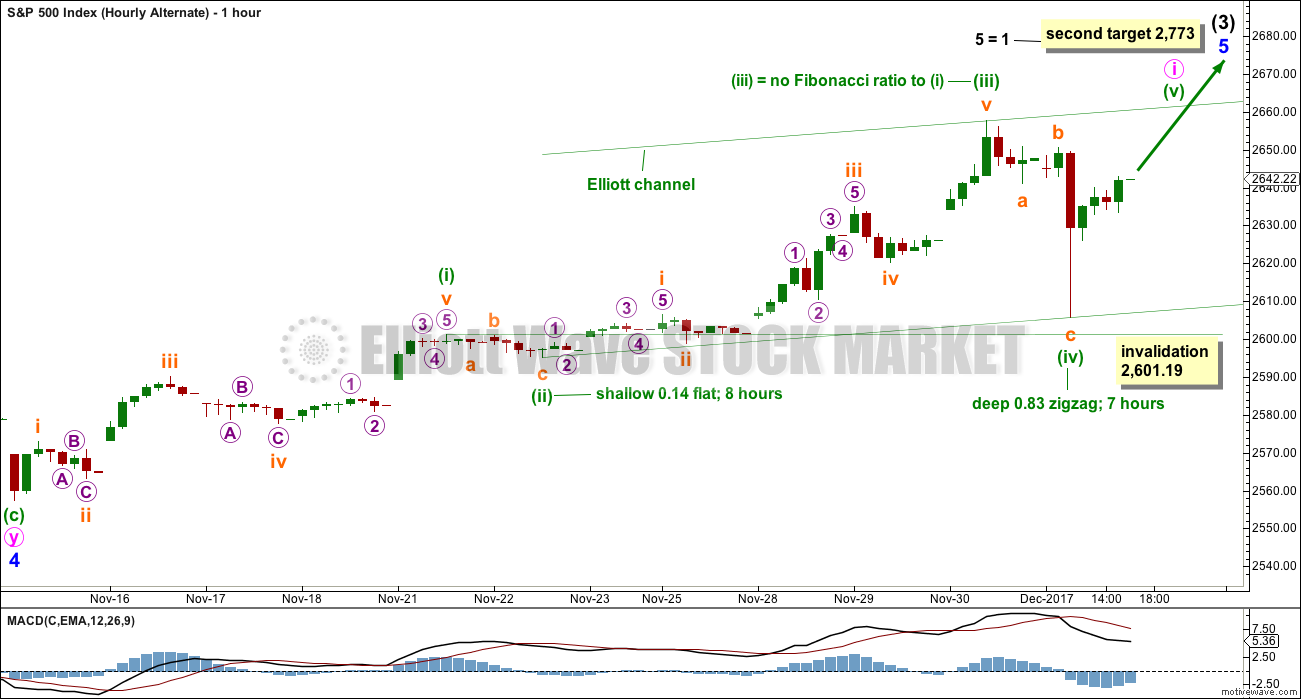
This alternate hourly chart simply moves the degree of labelling within minor wave 5 all down one degree. It is possible that only minute wave i within minor wave 5 is coming to completion.
For the short term, the invalidation point remains the same for both hourly wave counts. As soon as a new all time high is seen, then this wave count moves the invalidation point down to the start of minor wave 5 at 2,557.45.
This price point then becomes the differentiator between the idea that intermediate wave (3) is over and the idea that it continues higher. A new low below 2,557.45 at that stage would be required to provide price confirmation that intermediate wave (3) could be over and intermediate wave (4) may then be expected to have just begun.
TECHNICAL ANALYSIS
WEEKLY CHART
Click chart to enlarge. Chart courtesy of StockCharts.com.
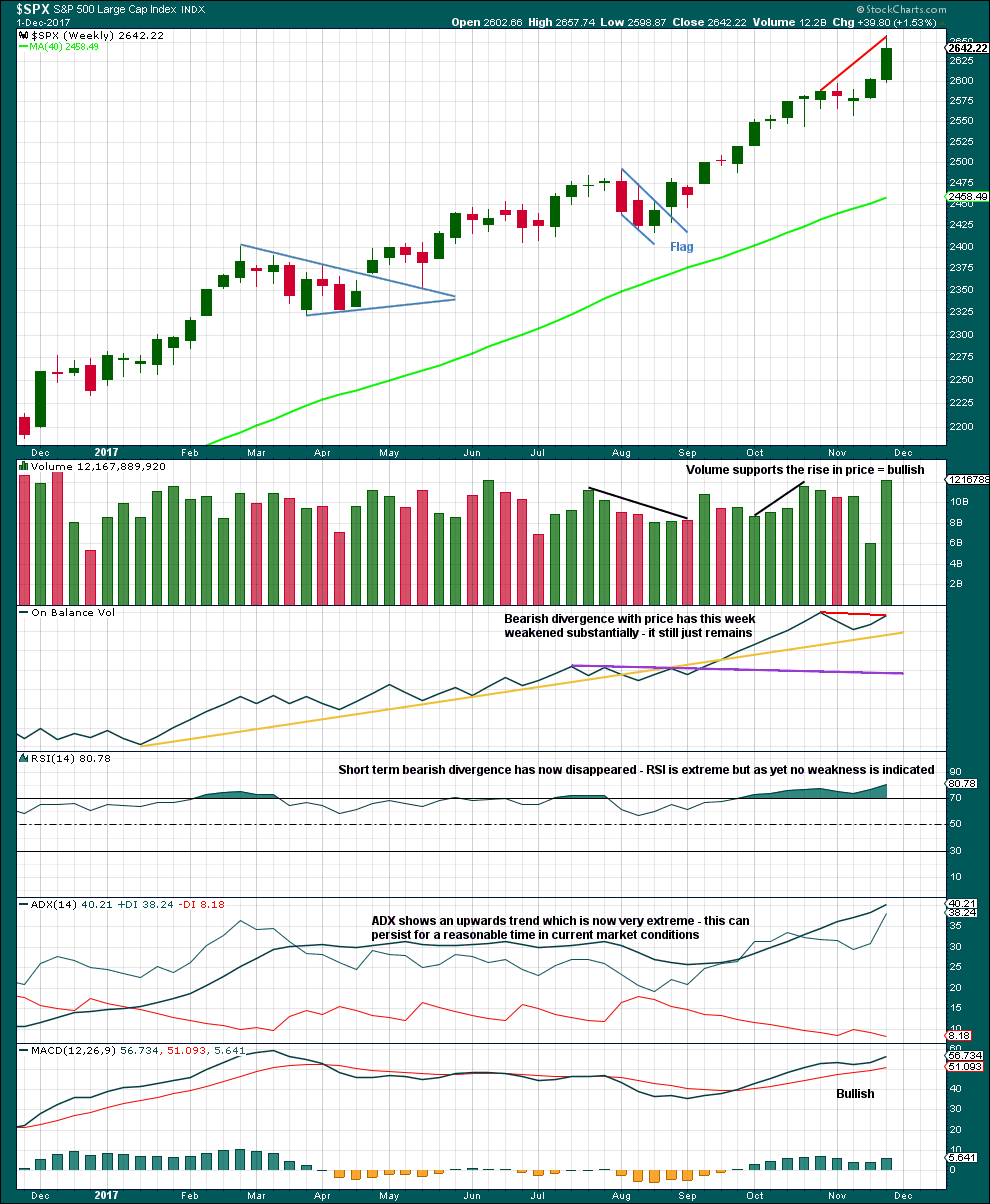
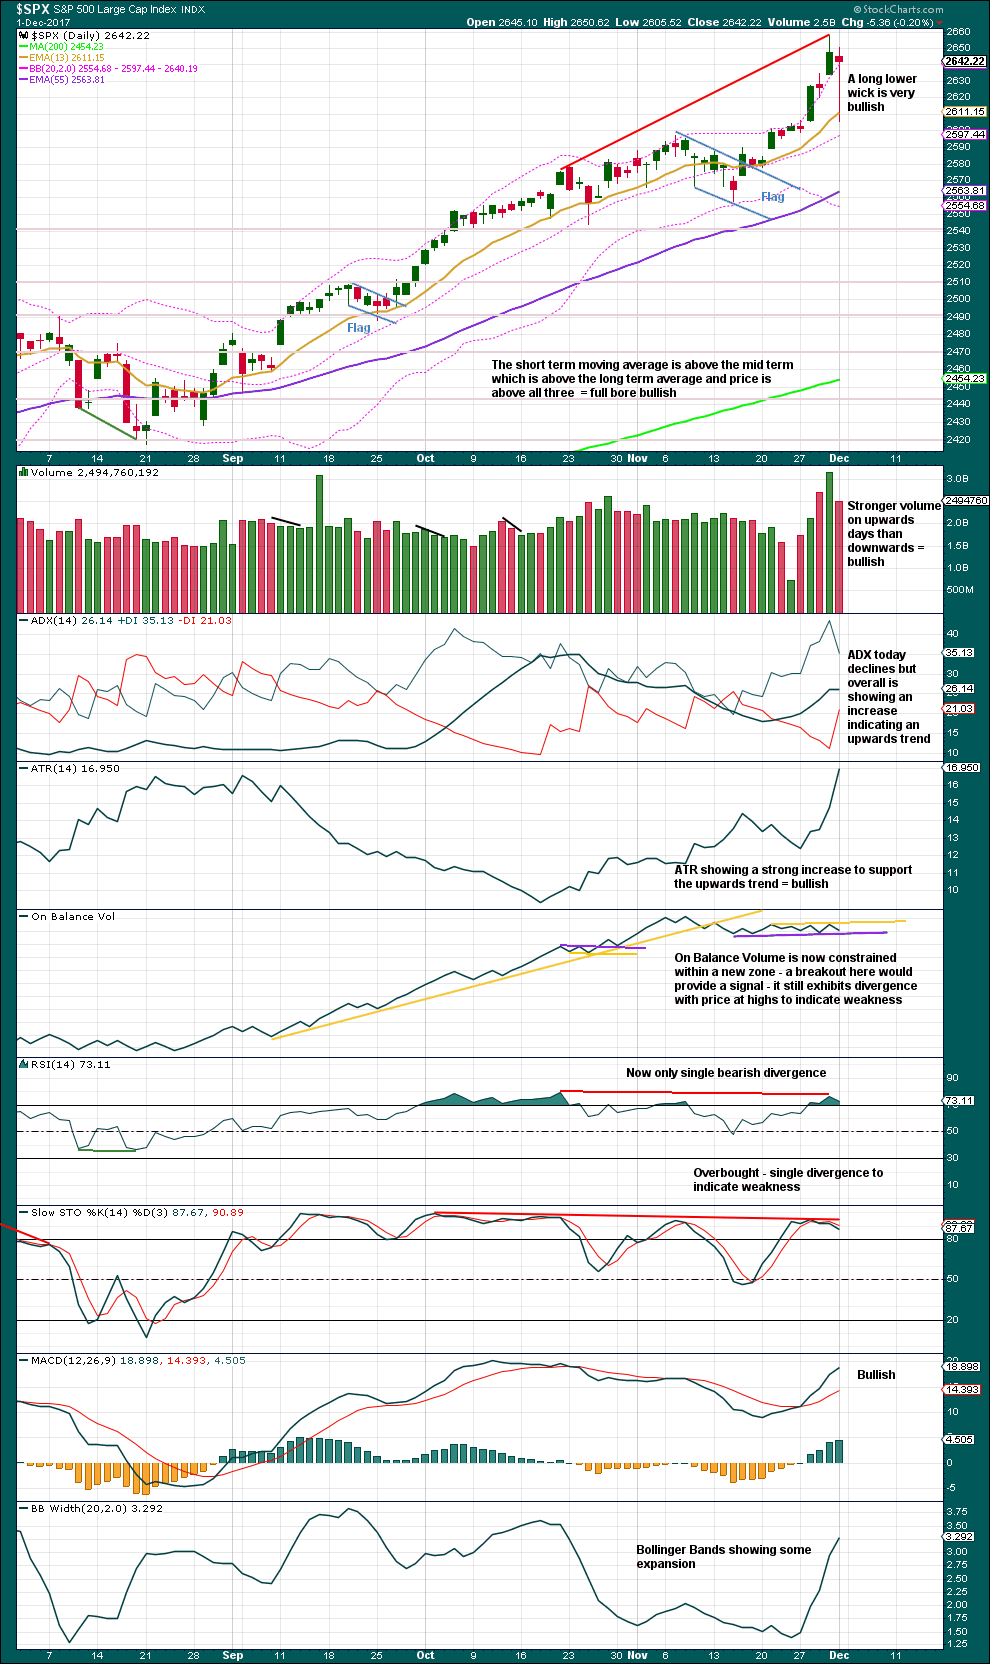
This last week completed the strongest volume for a year, which for an upwards week is very bullish.
The problem with divergence, and one reason why it is hopeless as a timing tool, is that sometimes it just disappears. That is what has happened between divergence with price and RSI. Still, the failure of On Balance Volume to make new all time highs with price is bearish especially if On Balance Volume is a leading indicator.
This trend is extreme, but it could still continue for a while longer. Look for a candlestick reversal pattern or a bearish signal from On Balance Volume.
DAILY CHART
Click chart to enlarge. Chart courtesy of StockCharts.com.
Friday’s candlestick has a very bullish long lower wick. For this to be read as a Hanging Man reversal pattern it needs bearish confirmation. The Hanging Man pattern is in practice a two candlestick pattern. While that bearish confirmation is not present, it will be read as bullish.
Overall, this chart remains very bullish. But with RSI and Stochastics extreme overbought, this warns that an end to the current trend may be approaching. Some consolidation may be required to relieve these overbought conditions.
Look for a bearish candlestick reversal pattern or a bearish signal from On Balance Volume before considering a high in place.
VOLATILITY – INVERTED VIX CHART
Click chart to enlarge. Chart courtesy of StockCharts.com.
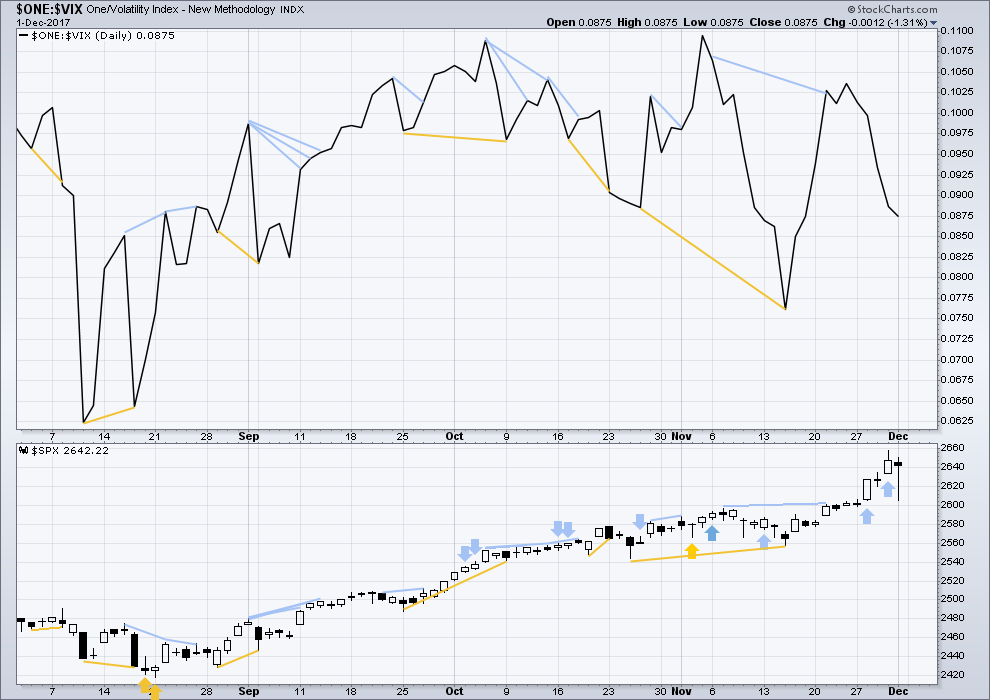
So that colour blind members are included, bearish signals will be noted with blue and bullish signals with yellow.
Normally, volatility should decline as price moves higher and increase as price moves lower. This means that normally inverted VIX should move in the same direction as price.
The two bearish signals given recently from VIX have now been followed by a strong downwards day. This bearishness may be resolved here, or it may need another downwards day to resolve it. There is no new divergence between price and inverted VIX for Friday; both moved lower.
BREADTH – AD LINE
Click chart to enlarge. Chart courtesy of StockCharts.com.
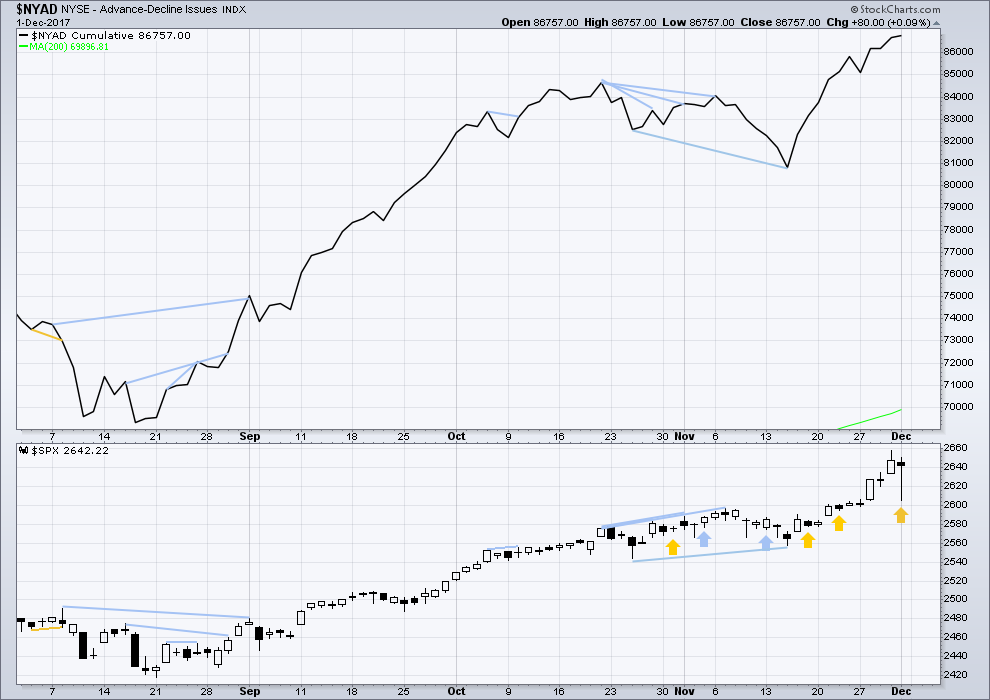
There is normally 4-6 months divergence between price and market breadth prior to a full fledged bear market. This has been so for all major bear markets within the last 90 odd years. With no longer term divergence yet at this point, any decline in price should be expected to be a pullback within an ongoing bull market and not necessarily the start of a bear market.
All of large, mid and small caps this week have made new all time highs. The rise in price has support from market breadth. They all also have very long lower wicks for Friday; this looks bullish.
For Friday price moved lower, but the AD line moved higher. As breadth should be read as a leading indicator, this is read as bullish. This offers reasonable support to the Elliott wave count.
DOW THEORY
The DJIA, DJT, S&P500 and Nasdaq have this week made new all time highs. This provides confirmation of the ongoing bull market.
The following lows need to be exceeded for Dow Theory to confirm the end of the bull market and a change to a bear market:
DJIA: 17,883.56.
DJT: 7,029.41.
S&P500: 2,083.79.
Nasdaq: 5,034.41.
Charts showing each prior major swing low used for Dow Theory are here.
Published @ 09:45 p.m. EST on 2nd December, 2017.
It is starting to feel like the old market again with at least some semblance of volatility which is the life-blood of traders. I don’t think folk realize how detrimental to market health this long-standing abnormal vol situation has been. I am really rooting for the long cohort that now seems determined to roll up these short trades once and for all so we can return to some semblance of normalcy in the markets. I will be watching the 15.00 pivot with great interest!!
VIX … went below the 200 DMA at 11.10 and the 100 DMA at 10.67 and also below 10.50…
Then broke back over all three to go as high as 11.86 late in the day and now sits at 11.68 and is still trading.
So… what does this all mean for the VIX overnight and the next several days???
Supreme Court just ruled that Trumps Travel Ban can go fully into effect!
CA and HI Liberal Judges… Go to Hell!
So much for the constitution. You know, the law of the land that was properly interpreted by judge after judge? But no, not for the SCOTUS: they are (5 of ’em anyway) pure corporate shills. These are same crowd that gave us “corporations are people” and “money is speech”. What do you expect?
You are so Liberal! You should try reading the constitution and the writings of those who composed it!
Are you serious? As commander in Chief, POTUS has the LAST CALL on who gets admitted into the country under the purview of his responsibility to protect citizens from those who would seek to harm them. The judges trying to hamstring that decision are have lost their minds. Immigration is a FEDERAL matter, and POTUS is at the top of the heap. NO ONE questioned Obama when he exercised that with unlimited discretion, so at least be fair about this.
Look at the chart since the new 52 week low at 8.56 on November 24. The bulls now are firmly in charge and continue to accumulate regardless of what the short sellers are doing. They were all probably waiting for that new 52 week low. Keep an eye on the 14 price pivot. Until it CLOSES above, it is smart to keep scalping the moves up from the day’s low which have been able to be safely bought since November 24. We are going to see a massive short squeeze on any move above 15. If it gaps up through 15 there will be fireworks, BELIEVE me! 🙂
Higher Daily Closes for the last 6 days… now need three full green daily break out candles to cause chaos!
CRACK! Goes NQ. It will be an interesting evening…! 🙂
wowza,, tech wreck,,,dilly dilly
NQ is Crashing in the 4:30PM – 5:PM session!
UVXY hitting new daily highs After Hours.
NQ on a daily is a Very Bearish Candle Stick Pattern!
Lets see how wiggle out of this one! I don’t think they can!
Updated hourly chart for you this afternoon NY time:
While it is possible today that intermediate (3) could be over, I would rather wait for at the very least a new low below 2,605.67 before I consider that idea, and even then only as an alternate.
Let us assume the trend remains the same, until proven otherwise. The trend is still up. Which means pullbacks and corrections should be an opportunity to join the trend.
This approach will work for all pullbacks and corrections until the very last one. And so this approach should be a relatively easy way to make $$ in a trending market.
For intermediate (3) to be considered over and intermediate (4), a multi week pullback or consolidation to be considered to have arrived, we need to see a new low below 2,557.45 now.
Below 6275.63 confirms larger impulse down in NQ….
Wow! The fur sure is flying in NQ! They are all in trying to defend that 6275.63 red line….
I think a break of the pivot is fiat accompli…nice try guys…! 🙂
Anybody else watching that NQ dogfight??!
Unbelievable!!!!
If we have another wave up, we will likely get a low in the a.m. tomorrow ahead of the last ramp higher, a good time to ring the register imho. Stay Frosty! 🙂
It seems there’s just not enough price room with the first target (2676) for a minute 5 up to play out here given that a minuette 3, 4 and 5 are needed to complete it. Price coming down further first doesn’t help: the problem is the small gap between the top of minuette 1 and the 2676 target. The 2nd target is reasonable, but rather lofty, and would seem to upset proportionality?
Traders accumulating vol have re-claimed the 10.50 pivot the last two sessions on nice volume and will probably not surrender it, panicky short sellers not withstanding. Think “PYTHON”…. 🙂
Looks like NQ has a second wave up completed. If we we’re off to the races….
Algos now set to aggressively short VIX at 200 dsma in a desperate last ditch effort. The minute it breaks back above…”Farewell and Adieu, to you Spanish Ladies…”
Price is 11.10….
Ok ok, baby short on DJIA
I know I know…! You just don’t want to get tired of…..WINNINGG!!!!! 🙂
Russell looks interesting as well.
COMP and RUT are setting new lows on the day.
NDX and NQ about to join in.
I know bears are running scared but come on people. What d’ya want; someone to spoon feed ya??!! 🙂
I don’t have that kind of power.
I did buy DXD this morning.
Looks like VIX trade is dead.
Are you kidding?? If anything, that beast is getting ready to go on a rampage…! 🙂
Today?
I will go out on a limb and say withing 48 hours…! 🙂
Remember when you are trading against the official trend, the key is to scalp the moves. I ALWAYS enter an order to sell at the expected profit target when you are scalping or profits will quickly evaporate. This is an absolute must when you trade corrections.
They have clearly opted for a strategy to prevent the decline for as long as possible into the close. VIX on sale…
It may be traders getting positioned for five up. If that is true, we will see a powerful gap up in VIX as they all exit….
The banksters have done a magnificent job of cowing bearish traders. With all the red flags waving VIX remains in the red. It is like succulent salmon splashing around right under the nose of Polar bears and them not even noticing!! lol! 🙂
Put me in that category Verne, although I’ve been watching them do this for years, Friday scared me to be honest.
I sympathize completely Chris. The have bloodied quite a few bears over the recent years and those wounds are still fresh for many… 🙂
Very true, and I’ve been fortunate enough to have one of the best years in my career in the face of that. I lucked out big time Friday, and not trying to press it here. Calls up 3x and futures up 20 points really made the holidays greener. Probably won’t do anything until that low is taken out.
Probably a smart move. I expect the thrashing around to continue… 🙂
I view the VIX as driven by “smart money”. Not manipulated. Driven by smart money. Big money writing lots of calls and puts on the SPX (the prices tags attached to those instruments are what the VIX is calculated from, let’s not forget). Last week was a fantastic demonstration of this: two days of surging SPX, yet the VIX spiked up. Clear and present DING DING that a major spike down was very near on the event horizon. And it came on Friday. Now the VIX is back to behaving relatively normally, against an SPX backdrop of another surge upward in price. If we assume the VIX is still representing “smart money” (it is), what’s that tell us about the short term future? If we put aside our biases, the data speaks volumes. On the other hand…no money is always “smart” (right) all the time, and of course, external events can intrude, surprise, and drive the market hard too. That all said, the VIX now just adds to the preponderance of the evidence that SPX is not yet topped out and started that intermediate 4. Close perhaps…but still no cigar.
Oh, how I wish it were that simple my friend…! 🙂
If it were, shorting VIX right now would be a sure money trade. NOT GONNA DO IT!!! 😀
Pension Funds Selling Volitility for Income! Yes, that is very smart money!
LOL
I still CANNOT believe it is LEGAL for custodians to do this. I realize that they are in serious trouble because of perennially low interest rates blowing up the actuarial tables but talk about jumping from the frying pan into the fire!! 🙁
That’s 10 times worse that the CDO’s of 2006-2009
VIX just went back over the 100 DMA of 10.67
next up that 200 DMA at 11.10
Good call, I didn’t think it would turn around today the way it was going. I want to get out of my VIX trade from Thursday/Friday asap. Hopefully at huge profit as VIX exceeds 17
I feel so sorry for all those people who are depending on their pensions to provide a source of income in retirement. This is going to be one of the most tragic things about the coming crisis. Once again the little guy is going to be forced to pay the piper…!
Sorry, but those trading volatility are NOT what I called “smart money”. What I called smart money is those establishing the price of SPX options that expire over the next 30 days. The VIX is computed through simple math executed over the option prices. Those who bet on changes in those options prices (changes in the VIX) are not who and what i was referring to. I was referring to those who ESTABLISH THE VIX VALUE. It’s very informative to read the actual descriptions on the CBOE web pages that describe the VIX precisely, what effects it, etc. It is often seriously misunderstood (who knows, maybe even by me).
I used to painstakingly monitor actual put call ratios to get some idea of what I should expect from VIX valuations. After many years of attempting to determine if that ratio is ALL that is involved, I can tell you with absolute certitude that it is NOT. I cannot explain how they arrive at the number. I know it’s not simply the put call ratio, I don’t care how much they protest to the contrary. Go check it out for yourself….
I read a cycle analysis today that calls for an economic crisis, not a correction, in 2017. The call was first issued in 2008 and updated in 2010. Since we are not seeing the usual evidence in some TA indicators, could this be an “event” driven outcome, a black swan of some sort? Lord knows we have been playing with financial fire, so a conflagration in the house of cards would be no great surprise…!
I have this down as March 2018 going onto April. Think we still have some more madness until then
Will have sold all longs by then and build the long term account short
It will be interesting to see how the markets handle the huge drop in liquidity arriving soon.
https://northmantrader.com/2017/12/03/the-carrot-top/
Frankly Davo, that is what concerns me the most. Without liquidity, it does not matter if you are right on the trade. Few people are considering the huge implications of this potential problem. It is really going to be a problem as you simply cannot plan on making monster trades, unless you are prepared to cash out a little at a time…..
Well, whoever made that call has just 26 days for it to come to pass.
Almost every SPDR sector is green, with financials up over 2%, and many others up well over 1%. Despite this large tech sell off (sector rotation??) continuing. That said, SPX is only one final minuette 5 up away from (“most likely” re: the main hourly) starting a 10+ week correction!! Darn I hate corrections…so bloody hard to trade!!!
I hate them too. A nightmare to analyse.
B waves are the worst, but fourth waves are right behind them as next worst.
SPX on 23.6% retrace at 2651.2
Next down: 38.2% at 2642.6 (which just about perfectly would close the gap)
50% at 2635.7
62.8% at 2628.7
Somewhere in there this 4 is going to turn back up I suspect.
The minuette 4 looks like a reasonable zigzag down and has bounced off the 23.6%….hmmmm.
They must have given up on propping up Nasdaq futures. They are already down 1%. Can you believe DJ is up triple digits??! Are people asleep?! Yikes!!!
Look at how deep down NDX, COMP and soon to catch up RUT are on the 20 min chart.
Once SPX and $DJI break down… look out!
You don’t a cleaner impulse down than we see in NQ…
The NDX is executing large overlapped price movement, against a backdrop of a one of the largest bull markets in history. The trend must be assumed to remain until proven otherwise. Hence, I see the NDX as executing a largish sloppy 4. It looks quite similar to what NDX did back in June, and again in August. I don’t know where the invalidation point is for this one, perhaps right around 6000 or maybe up at 6130, but suffice to say, those aren’t threatened yet.
Bid on SVXY 118 strike puts up to 6.00 already….going to 10.00…
VIX look about to ready to continue higher from here right here 11.16
Maybe not yet.
Who are the FOOLS still trying to short volatility?!
Sell volatility for Income! How do Pension Fund managers fall for this garbage???
LOL
But what happens if the markets go down? None of those morons asked the question. LOL
I took my short volatility profit this morn. I’m not reentering into XIV here because I suspect there will be “compression” (i.e. not the normal sized up move in XIV corresponding to the coming minuette 5 in SPX). That will be due to the impending intermediate 4 (i.e, a large in price and time correction); the SPX option traders know this stuff, and price their options with proper discounting of the 30 day event horizon. So I entered UPRO here instead, to try to just get the minuette 5 itself. I’m using today’s low (a nice 23.6% fibo retracement level) as my stop; tiny loss if wrong, perhaps a 10x larger win if right. I’ll take that.
Maybe now?
A green print on VIX today looks likely. A continued move higher on any fifth wave up is your invitation to do some early Xmas shopping! 🙂
For one, I think this corrective wave won’t last long if the job report number is good this week. I always envision how each data will play out, it’s tempting to stay long.
There’s always some substance in the air!
Bulls make money,Bears make money, Pigs get….you know the drill…! 😉
In DXD at 8.91
Filled on VIX spread. Filled on SVXY 118 strike puts at 4.69.
Now to watch the musical chairs… 🙂
Good morning all. SPX relentlessly pushing upper BB. As Verne has noted, this will end relatively soon. Some cycle analysis I follow is calling for SPX and DJIA top on Dec. 11th. NDX and RUT later in January 2018.
At the end of day, I will be exiting all long positions in my long term account. Then waiting for some confidence that a larger correction has started.
I will note that Lara stated in this weekend video the bull market top is at least 4 months away and possibly as much as a year or two.
I really appreciate hearing how you are trading using Lara’s work at a higher timeframe than my own trading, thank you Rodney! That 12/11 date for a top looks late to me, for the reason that if price keeps moving up at all here, it’s going to hit the target sooner (today/tomorrow, maaaaybe Wed?) than that. And if that completes the minor 5 (vs. just the minute 1 of the minor 5, in which case a bull run of epic proportions is about to unfold!), it’ll be intermediate 4 start time. We live in interesting times!
I am really beginning to think that my publication of hourly charts on a daily basis, giving blow by blow accounts, is making members here focus on the minutae. On volatility which should be ignored. On the little swings and movements.
And not on the bigger picture.
And I think this leads to overtrading. Not seeing the forest for the trees.
And I’m thinking only once a week with daily and weekly and monthly charts may be a better approach.
The overnight hourly’s are critical for me (if those are what you mean). The intraday update…pleasant, but not “needed”. Thanks.
Thanks for the input Kevin. As always, it’s just my musing. I’d poll all members before considering any kind of change like that.
Almost 300 up on DJ!! The higher they fly, the harder they fall.
Buying DIA Jan 245 puts for 3.80 per contract…
Using Lara’s count, everything since the bottom Friday is a final 5 of a minor 5 up. Clearly the action here is the 3 of that final 5. I’d guess the top of the 1 up is probably 2627.5 or so. A smallish 4 should be coming very soon and perhaps even starting here, a final thrust up to the 2676 target area and it’s time get bearish re: an intermediate 4 due, is the model I see implied by the Lara’s count. (The alternate is so extraordinarily bullish I just have to discount it for the time being until there’s some evidence supporting it.)
Selling to open VIX Dec 20 9.5/10.50 put credit spread for .35 per contract, 100 contracts…
Sold my SPY 267 calls for .50. The automated trade system cost me 0.08 cents because it was too stupid to execute an options trade!
Wow… all “Giddy” on the Business networks, all of them, Calling for 25,000 DOW by Christmas.
Watch for 2,666.66 on S&P as top… (To me you’re close enough)
Perfect symmetry with 666 at the bottom in 2009
The Old man at EWT loves to point things like this out. That old man says 5’s at multiple degree’s for $DJI, DJT & S&P are currently on throw overs which when all go back below EW Trend lines, confirms all have completed.
They need to go wash some of that egg off…! 🙂
No… the condition was when all go back below trend lines, they are over!
Could be days or week. Report… Late on Nov 30th.
“All on throw-overs”! I see being back below as lows 2 weeks ago… from what I can tell.
2,666.66 we got to 2,665.19… Close enough!
Now if old man is right… < 666 may be in the cards again.
The above B band cavorting will not last long, that is certain. A swift visit to the lower band is highly likely imho…strange times!
One of my learnings is that a critically important element of trading is to put my own preconceptions (that aren’t based on Lara’s count) into a little box at the side of my desk; they are toys for occasional dalliance during the trading day. All trades: strictly off the price action and the count, NOT on my biases and preconceptions. I think such a mentality is critical, personally. I’ve lost a lot when I didn’t do this well.
I saw the actual count. They incorrectly once again labeled a five up complete…
If VIX gets anywhere near printing green today, stick a fork in it…! 🙂
I did take my Friday’s XIV 1/2 at open, and the second 1/2 about 90 seconds after open when it didn’t immediately start rising. Birds in hand.
Hilarious story on Drudge:
“Possum breaks into liquor store, gets drunk as a skunk!” lol!?
The marmots in California’s High Sierra mountains are known to climb into hiker’s parked car engine compartments, then chew on hoses until they can start downing the radiator fluid, which is believed to waste them rather severely! Bad news when you get back to your car after a week in the backcountry, ready to roll to a hot shower and a giant plate of fresh cooked food, and you’re overheating before you even hit pavement!
LOL
Here in Northland in New Zealand it’s one of the dope growing areas. We have the Australian possums (not to be confused with your American opossums which are like giant rats) overrunning our native bush, everywhere.
The possums get into the dope crops and munch away. Then they fall out of the trees, stoned off their nuts 🙂 🙂 🙂 Too funny
Hyuk! Huyk! What a riot! What I would give for some footage of that escapade! 🙂 🙂 🙂
Hilarious. Let me guess…then the growers, in a fit of rage, capture, cook and eat ’em, and get a nice secondary buzz! No possums got to my crop this year, but oh man, the gray mold, yikes!!
I have to say it really is amusing to see how they are thrashing around in the futures market. I knew this is how it would play out. Those red candles are just going to keep getting bigger and bigger with the crawl back higher becoming more and more labored, until the herd wakes up and goes- “Wait just a minute!!!” 🙂
Figures! You mean they can’t even wait until the open? See that big red candle in DJI futures? Joe could be right in that the unraveling starts even BEFORE the open. It is really way too funny…..
Interesting. Futures ramping higher, pre-market bid sliding lower…
VIX down a relatively miniscule 2%…
after making a stupid amount on Friday, I’m sitting out…banksters were all over it Friday and all over it this am
I hope they ramp it enough to let me cash in those SPY 267 calls- ten handles is all I ask! 🙂
haha, they’re in there right now on futures trying to stave off those two big sell candles. With hyperinflation exploding all over EM, I’m starting to get a bit concerned about how to navigate that here.
Yep. I think trades that pay up front are the are the smart way to navigate the turbulent waters ahead…Ahem..! Cough.! 🙂
Here is another interesting thought. There is a huge difference between volatility and risk. Many are about to learn that hard lesson. The world is awash in all kinds of risk – military and geo-political of all sorts, and of course for those paying attention, very dire economic ones, despite all the hoopla. NONE of these seem to matter to market price. We are literally on the verge of NUCLEAR WAR for crying out loud. Of course, any event, any number of which could shortly unfold, will have all the pundits whining about how no one saw it coming…. yeah, right! 🙂
If you want to stay just a step ahead of the herd, keep an eye on option spreads during the cash session today…
“Back UP the TRUCK and BUY for the NEXT 10 Years”
An exact quote just uttered from someone from Merrill Lynch on Fox Business!
Another sign the TOP is at hand.
Dolt, or duplicitous? I’ll let you decide! 🙂
As stunning as it is, the fact is that today a lot of folk are going to pile on, if there are any left on the sidelines. I wonder how many are going to pay the slightest attention to the fact that what is now happening is entirely unprecedented in the history of markets, at least so far as I could find for the indices – namely price executing a triple digit run-up after ALREADY trading two days above Bollinger bands!! Wow!!!
I know some of you have your doubts about mean reversion. Well, you are about to witness one of the most spectacular examples you or I will probably ever have the pleasure of seeing! Strap in! 🙂
SPX up .6% in overnight futures, and the DJIA up .9%. It might be a wild day (again), but this one may be more in the direction of lots of up first. How much and how far is the question. I took a number of longs late Friday anticipating exactly this, and going with the count indicating we’d just launched a minute 3 of the minor 5. Happy with that. But I’m recognizing also that I missed golden opportunity by not loading up the truck BIG TIME when price went down to within a breath of the wave 2 invalidation point. I want and need to be ready to pull the big buy trigger there, by seeing/knowing/stalking those kinds of moves. ALL THE SIGNS WHERE THERE it was coming, with the exponential price rise, the VIX signalling “sharp selloff coming within hours”, then price fall to a major fibo supporting just above the invalidation. I did get in…but not enough, and more significantly…failed to hold!! Time to pull out the trading plan and make some additions!
Despite price being above the B band, that long lower wick so far is batting a thousand so I grabbed a bunch of weekly SPY 267 strike calls for 0.19 apiece. So far looking like a quick double. I will also be adding put credit spreads at the open for two weeks out. Gotta trade what you see in these short term windows…
Yup. I’m a bit suspicious it’s only going to last a few days; Lara’s bearishness re: the impending intermediate 4 throws a proper dose of caution on the immediate proceedings! But at least we get a minute 3/4/5 over the next few. Around then it’ll be time for government shutdown, or more indictments (Jared’s is probably at the printer’s right now, lol!!!). Another possibility: a new “Saturday night massacre” is coming in the next week or two, with a firing of Meuller, and a congress who won’t do a thing about it. Because honestly, the noose of justice around Donald’s neck is steadily tightening, and he’s not going to allow it to close without fighting to retain power to the bitter end. IMO.
Pure Non-sense… You need to find a better place to get your news.
Meuller is wrapping up… His investigation is over! He found Nothing because nothing was done wrong. It’s was all pure fiction!
You all bought it hook, line and sinker.
The people who will go to jail will be in the FBI and former administration and in their justice department.
The Truth will come to light either this month or in January. The swamp will be drained in 2018… all of it!
Rumor has it Joe, that there are a large number of sealed indictments yet to be revealed. It is supposed to be stunning, they say, when they are opened….stand by… 🙂
btw, a number of states co-incidentally also have large numbers of sealed indictments about to be revealed. Something’s a ccokin’ it would seem…
Dummmm-da-dump-dump…
Dummmm-da-dump-dump-DUMMM!!!!!
Waiting for the one to be nailed to the front door of 1600 Pennsylvania Ave!!!! Meanwhile I see the mad king is just about completely losing his marbles. It’s gonna end very, very badly.
Keep dreaming! The Dems are the ones going to jail. “Lock her up” was the campaign chant.
“Winning, winning, winning! “Drain the swamp”!
Campaign chants are not relevant to the wheels of justice. There is an objective reality out there, and for the most part, it is reported on reasonably accurately. Lastly, when you reach a point where the lawyer for the President is stating that the President “cannot obstruct justice” because the constitution says so (with some crazy half baked argument to support that wacked out position)…you know damn well he’s GUILTY, GUILTY, GUILTY!!! And let’s remember, Nixon was impeached for…obstruction of justice!, among several other charges. If a president could be guilty of it then, I’m quite certain the consititution hasn’t changed, and a president can be guilty of it again. And we haven’t even mentioned the “other charges” in the Trump matter, and there are many. Colluding with a foreign power to compromise American foreign policy (even if “president elect”…that means STILL A PRIVATE CITIZEN) and to tamper with an election through illegal collection and distribution of private data are rather serious charges on their own. Oh my this will be fun!
With Nixon… there was an underlying crime. The break in at Watergate.
No crime here… only made up BS!
Obstruction of justice… is destroying 33,000 emails!
Crime… is having Highly Classified Material in an unsecured server and people who didn’t have clearance having access to that server. + Anthony Weiner having access.
Crime… doing something for Russian interests and your foundation received $145 Million from the people who benefited.
Crime… covering all the above up! + Too many other crimes to list!
Trump… No Crime at all!
It is NOT going to last days. EVERYONE is talking about the seasonal bullishness of December, and the purpose of this last manic move up is to draw in the last reluctant cohort of trend followers who have no interest nor inclination to consider the larger context in which the price movement is occurring. I plan on cashing in my calls at the opening as soon as I get filled on my bull put spreads, and I will be monitoring the short puts like an eagle stalking a wabbit. I would not be in the least surprised by a dramatic turn today or tomorrow. The most exquisite trap would be a ramp higher all session, followed by a gut wrenching plunge in futures, a mirror image of this weekend. Remember Mr. Market aims to always ultimately fool the crowd. He may do it sooner, or he may do it later, but He ALWAYS eventually does it! 🙂
Indeed. That’s why I follow Lara. The count indicates it won’t be over until a few days at least, we’ll see…
This all will reverse during the day Monday if not before the open… IMO.
It’s sell the news! The buy the rumor has been going on since election day 2016.
Corporations will not see the benefit of a 20% Rate until 2019. The 1st Regan tax plan for business got phased in also and the market dropped for 12 to 18 months until bottom. The new bull market then did not start until August of 1982.
100% Expensing starts Jan 2018 so the investment part will start. Investment is not stock buy backs
Both the corporate leaders and the economic experts are saying investment will NOT follow. These companies already had boatloads of cash in the vault for that. More won’t change their decision equation. What is agreed is that the most likely usage will be stock buybacks to spread the love. One comment: “Home Depot will skyrocket, because so many boardroom doors will be broken down by shareholders demanding buybacks!”. History will view this tax cut as a critical nail in the American coffin, executed by a bunch of kleptocrats working to pay off the rich donors who keep them in office now that corporations are “people” and “money is speech” and “speech is unlimited”. That set of elements sums up to utter corruption, and this is the result.
Verne, If you haven’t yet, you must read this article… This is the most insane thing I have ever read!
Jim Grant Interviews Alan Fournier: “Pension Funds Are So Desperate For Yield, They’re Systemically Selling Vol…”
http://www.zerohedge.com/news/2017-12-03/alan-fournier-pensions-funds-are-shorting-vol-because-theyre-starved-yield
Wow! Pension Funds??!!
That is beyond insanity. That implies the short vol trade is probably even bigger than currently reported. I did not think this was allowed for pension funds, as desperate as the have become. It smacks of fiduciary malfeasance. CALPERS is already in very serious trouble with their portfolio of high yield junk bonds from oil explorers that are blowing up. Jerry Brown and the other cretins in the California assembly are hiding the losses. I would not be at all surprised if they are a major player in this dangerous arena. I am becoming more and more convinced that the blow-up of the short vol trade is going to be one of the biggest transfers of wealth ever seen. Traders are going to have to be very careful with this one. A lot of issuers on the wrong side of the trade are not going to survive to pay the piper. This could be factored in to the insanity in that they don’t plan to be around when the music stops. The carnage will be enormous. Very sad.
Thanks for the link. Everyone should carefully read it imho. Some may need to take action to protect their pension fund.
He says they were representatives of European Pension Funds. Not sure if any in USA… but it’s monkey see, monkey do with those guys! So I would not be surprised if USA also.
Thank you, Joseph. Pension funds… wow.
Hmmmmm
Looks like something is a brewing. This may take some time to ripen…
Dim bulb Donald Trump, in another foolish weekend tweet storm, writes:
“People who lost money when the Stock Market went down 350 points based on the False and Dishonest reporting of Brian Ross of @ABC News (he has been suspended), should consider hiring a lawyer and suing ABC for the damages this bad reporting has caused – many millions of dollars!”
I sure hope Grand Supercycle 1 ends well before his term is up!
Looks like a lot of other dim bulbs out there on Twitter agreeing with Trump’s nonsense. Yikes!
Beware market “glitches”! I expected to see them in the depths of the bear market, not when we are sitting near all time highs. Nevertheless one of the largest brokerages, Fidelity, with over 1.5 trillion of client assets recently locked clients out of their accounts. The same thing happened at Scottrade recently and with similar reports about denial of online access by a few banks, I am starting to wonder. Are we seeing a trial run to get folk accustomed to this happening?
As mentioned here by me and one other, Schwab was offline for an hour or so a few weeks ago…
You can bet throwing some DoS attacks at online providers during critical minutes of epic market moves to come (bigger and bigger 4’s and 5’s until the Biggest of the All!) could create a timeslice of opportunity to get properly positioned. I would tend to say that going to be a key tactical element of actors with zero morals and effective contacts to those who run DoS attack services (via botted computers and IoT devices on the internet) for a fee. The Russian mafia is the first place you go for service, and I suspect they are happy to do business with any and all.
I’ll just leave this here for the wabbit
Deck-o-ra-shons for yoour twee, wabbit!!!
Oh my! Look at the time! I must’ve overslept Doc…!
Just a little knock would have done it Doc; no need to blow up the neighborhood…!
Oh my! Look at the time! I must have overslept Doc…a little knock would have done it, no need to blow up the entire neighborhood!
Everybody look out. You can’t trust Kevin. It’s a bomb!
BTY, is that supposed to represent the new tax reform effort?
dilly dilly
What??? That wasn’t me! I’m going to have that posting investigated and analyzed. I think my lawyer did it!!
Dilly Dilly!!!!
Investigated. Analysed. Yep. That was you Kevin 🙂 🙂 🙂
Lock him up!! That is tewowism Doc…He is a tewowist!! 😀