
The first target was met and passed today. Price continues higher towards the second target, which is calculated from a flag pattern using the measured rule. If price keeps rising through that target, then the next Elliott wave target would be used.
Summary: The next target using the measured rule is at 2,634, but this may not be high enough. The next Elliott wave target is 2,773. As price approaches each target, if the structure is incomplete and there is no weakness in price, then the next target will be used. But if price approaches a target and the structure is complete and there is some classic weakness, then a high may be in place.
The structure is incomplete at this stage, but some indicators are extreme and some weakness is beginning.
Always trade with stops and invest only 1-5% of equity on any one trade. All trades should stick with the trend. The trend remains up.
Last monthly and weekly charts are here. Last historic analysis video is here.
The biggest picture, Grand Super Cycle analysis, is here.
MAIN ELLIOTT WAVE COUNT
WEEKLY CHART
Click chart to enlarge.
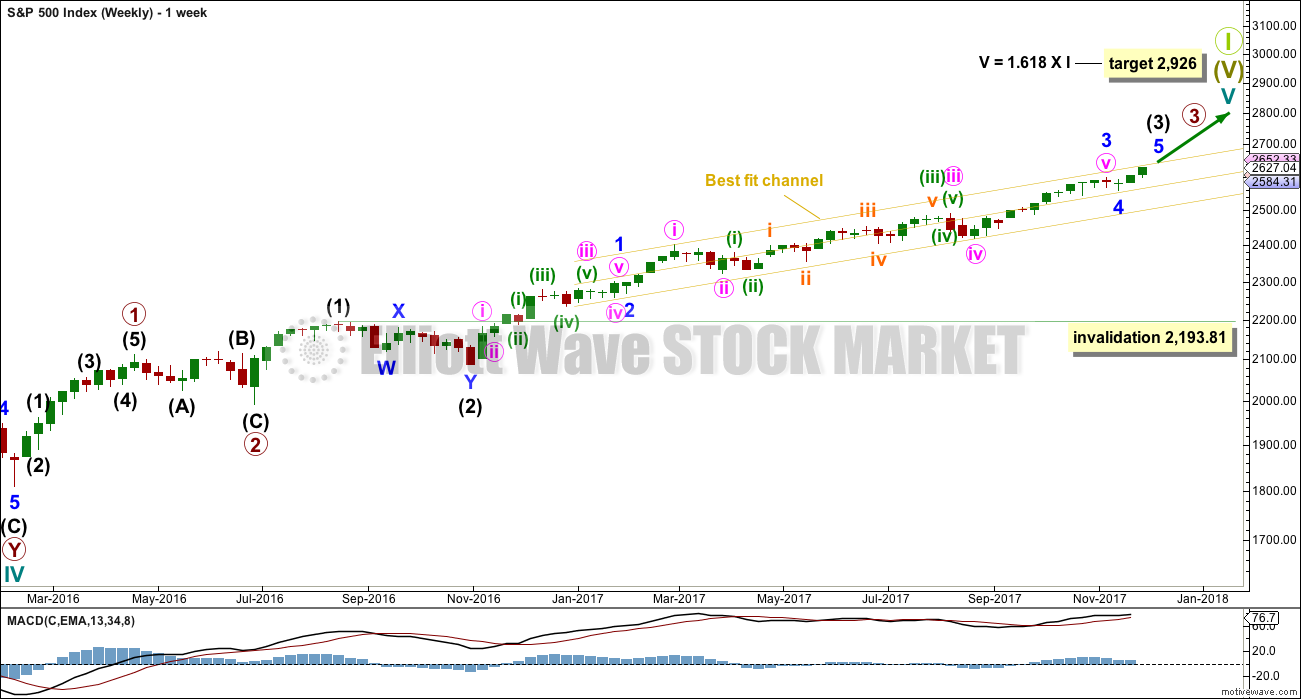
Cycle wave V must complete as a five structure, which should look clear at the weekly chart level. It may only be an impulse or ending diagonal. At this stage, it is clear it is an impulse.
Within cycle wave V, the corrections for primary wave 2 and intermediate wave (2) both show up clearly, both lasting several weeks. The respective corrections for intermediate wave (4) and primary wave 4 should also last several weeks, so that they show up at weekly and monthly time frames. The right proportions between second and fourth wave corrections give a wave count the right look.
Cycle wave V has passed equality in length with cycle wave I, which would be the most common Fibonacci ratio for it to have exhibited. The next most common Fibonacci ratio would be 1.618 the length of cycle wave I.
Intermediate wave (3) may now be nearing completion. When it is complete, then intermediate wave (4) should unfold and be proportional to intermediate wave (2). Intermediate wave (4) may be very likely to break out of the yellow best fit channel that contains intermediate wave (3). Intermediate wave (4) may not move into intermediate wave (1) price territory below 2,193.81.
DAILY CHART
Click chart to enlarge.
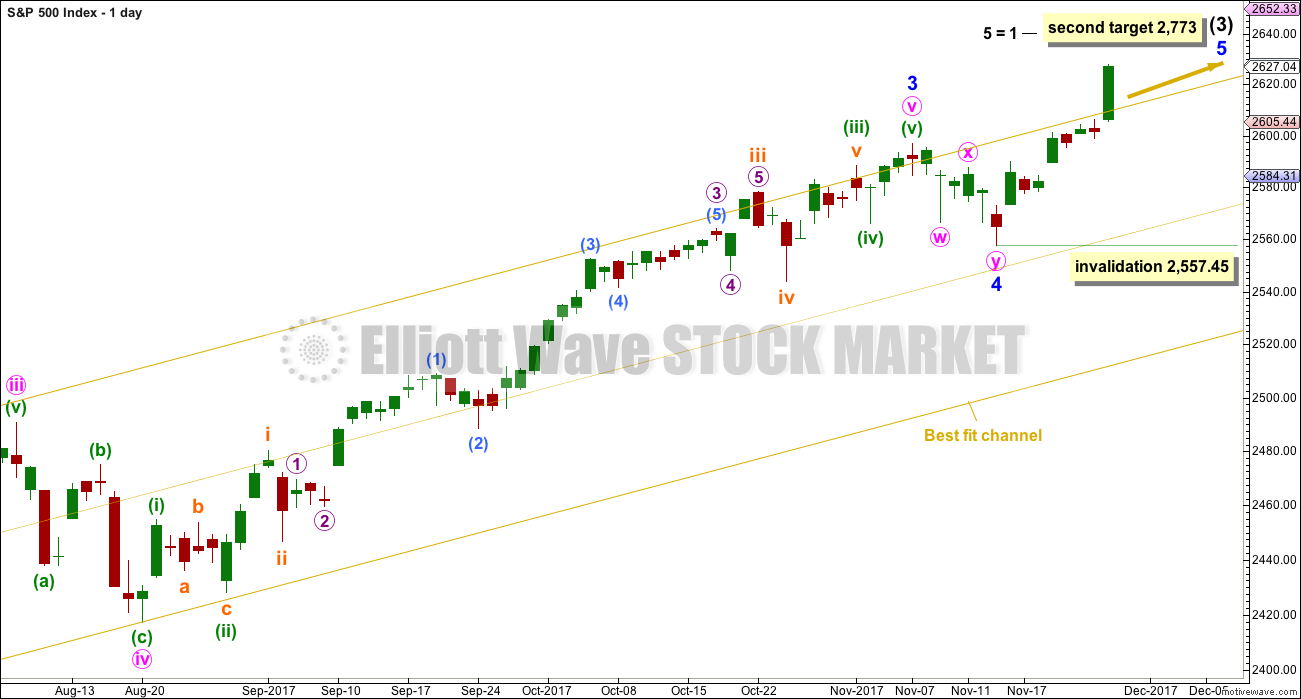
Minor wave 4 may now be complete. It will subdivide very well as a double zigzag. This provides only a little alternation in structure with the single zigzag of minor wave 2. There is also poor alternation in depth: minor wave 2 was very shallow at only 0.16 of minor wave 1, and minor wave 4 would be only 0.12 of minor wave 3. Alternation is a guideline and not a rule; it is seen more often than not, but not always.
The first target at 2,614 has been passed and the structure of minor wave 5 is still incomplete. The hourly chart will focus on this structure.
The second target calculated for minor wave 5 expects it to exhibit the most common Fibonacci ratio for a fifth wave. This target would not expect a Fibonacci ratio for intermediate wave (3) to intermediate wave (1).
Within minor wave 5, no second wave correction may move beyond the start of its first wave below 2,557.45.
HOURLY CHART
Click chart to enlarge.
This hourly chart is new today.
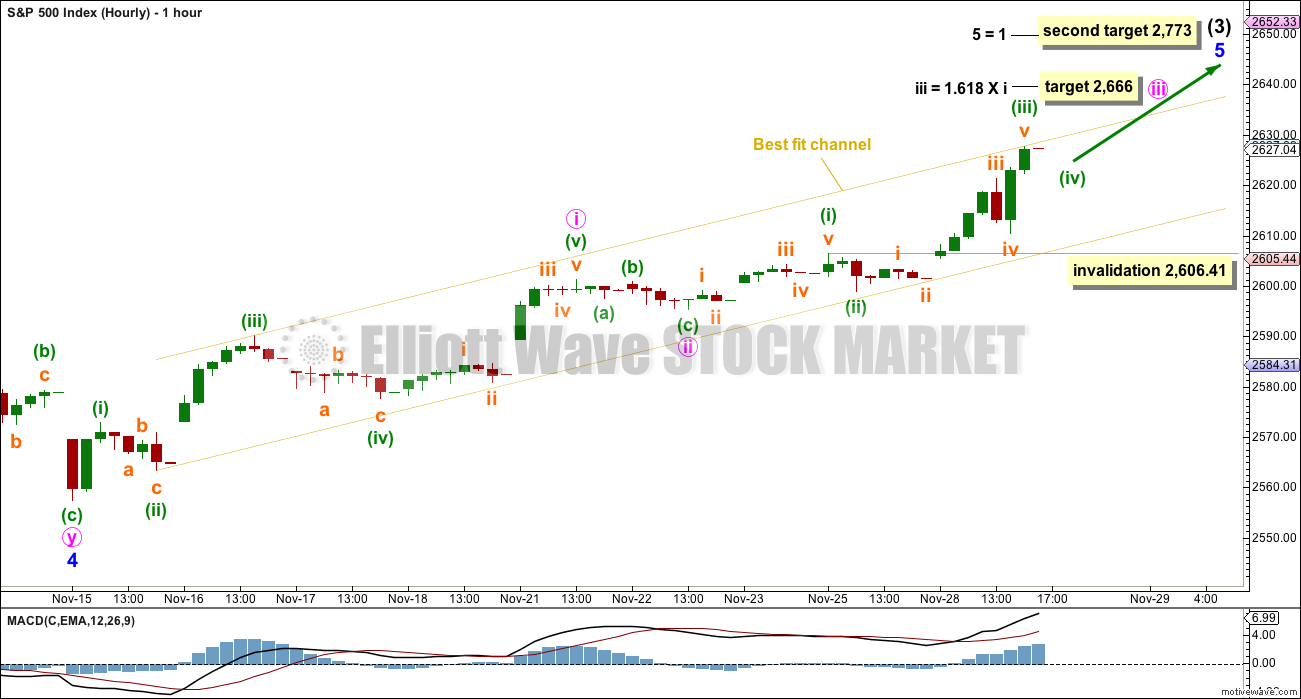
With strong upwards movement today showing an increase in momentum, it looks now like the middle of a third wave has passed and not a fifth wave. The S&P can behave like a commodity, but it is unusual for it to do so. What is more common for the S&P is for it to exhibit strong third waves.
Minute waves i and ii may be complete. Minute wave iii may have passed its middle today. The target for minute wave iii expects it to exhibit the most common Fibonacci ratio to minute wave i.
Minute wave iii may only subdivide as an impulse. Within minute wave iii, minuette wave (iv) may not move into minuette wave (i) price territory below 2,606.41.
When minute wave iii is complete, then the invalidation point must move down to the high labelled minute wave i at 2,601.19. Minute wave iv may not move into minute wave i price territory. However, minute wave iv looks fairly likely to remain contained within the best fit channel. This yellow channel is slightly adjusted today. It neatly contains all of minor wave 5 so far.
The target for minute wave iii fits well with the next Elliott wave target at 2,773.
TECHNICAL ANALYSIS
WEEKLY CHART
Click chart to enlarge. Chart courtesy of StockCharts.com.
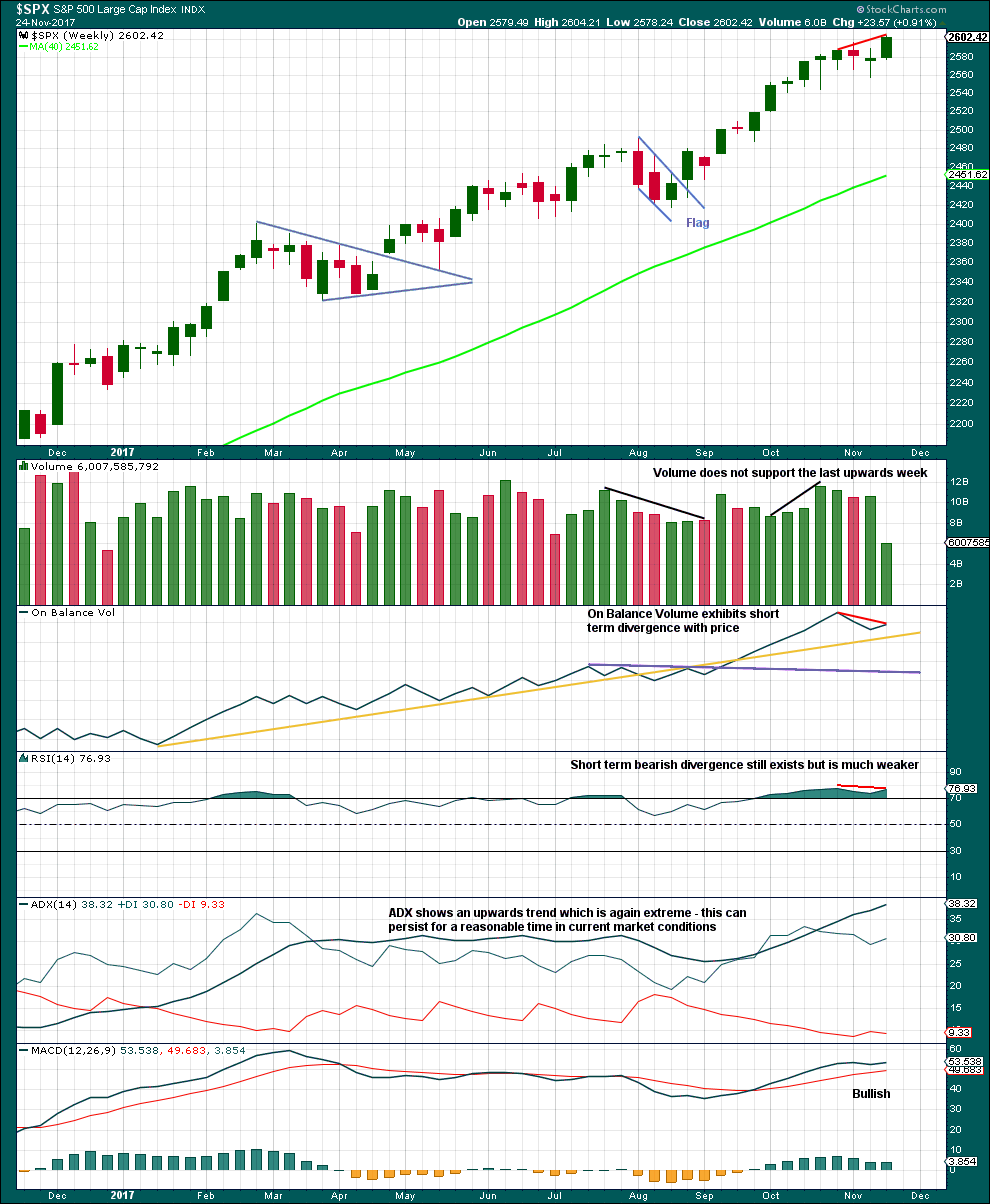
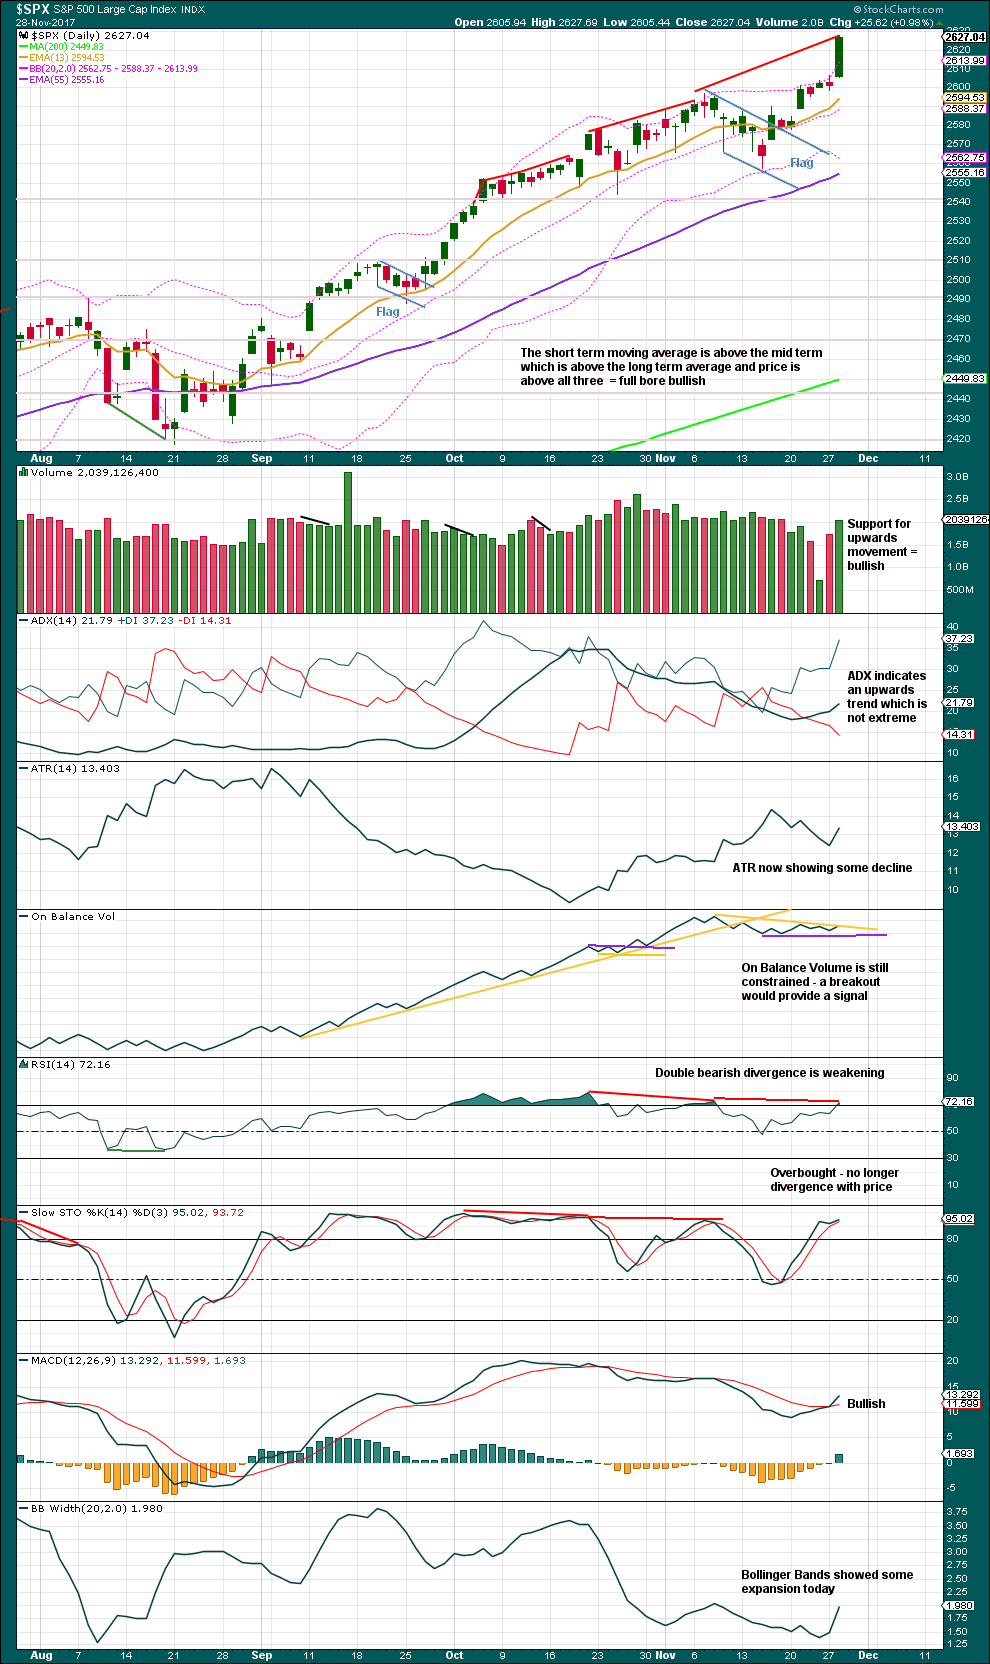
Lighter volume for a week with a US holiday in it would be expected. On its own, this lighter volume should not be taken as a signal that a high is in place.
Some weakness and overbought indicators should be expected as intermediate wave (3) comes to an end.
DAILY CHART
Click chart to enlarge. Chart courtesy of StockCharts.com.
The target using the measured rule for the flag pattern is at 2,634.
There is some weakness now with divergence between price and RSI and On Balance Volume. While price is making new highs, RSI and On Balance Volume have failed to make corresponding new highs. This is regular bearish divergence. Divergence like this is not a useful timing tool in trying to pick a high, and it can only be taken as a warning that a high may be approaching. Sometimes this divergence can just disappear.
With volume and price very bullish, expect more upwards movement. I will be watching for a candlestick reversal pattern to appear because they are fairly common at highs.
VOLATILITY – INVERTED VIX CHART
Click chart to enlarge. Chart courtesy of StockCharts.com.
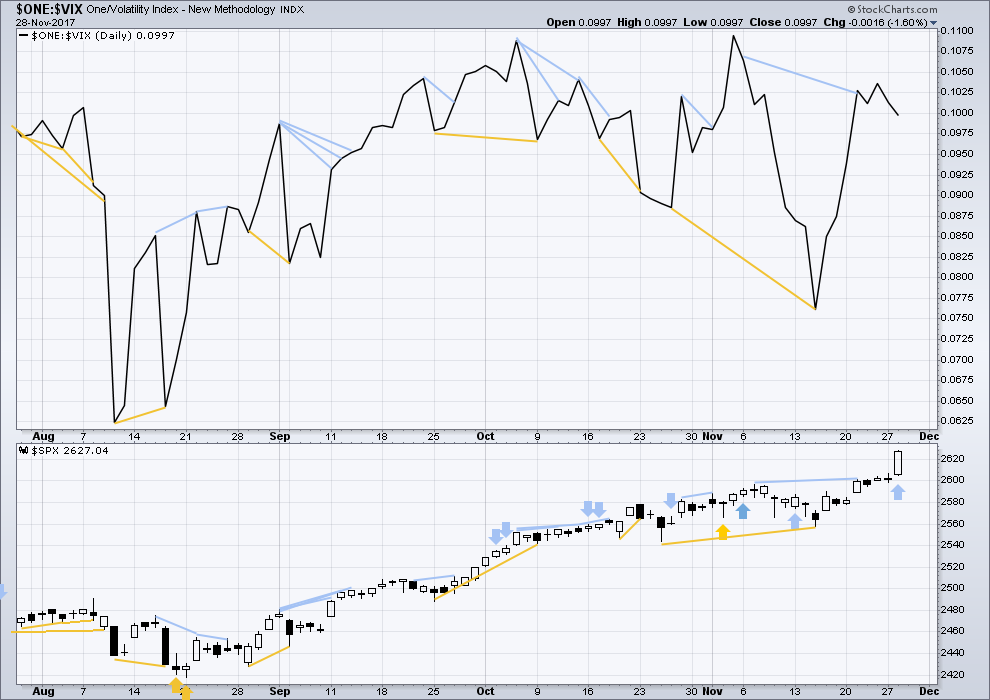
So that colour blind members are included, bearish signals will be noted with blue and bullish signals with yellow.
Normally, volatility should decline as price moves higher and increase as price moves lower. This means that normally inverted VIX should move in the same direction as price.
There is very strong bearish divergence today between inverted VIX and price: the rise in price today has not come with a normal corresponding decline in volatility; volatility as measured by VIX has increased. This is regular bearish divergence, and it indicates some weakness within price.
BREADTH – AD LINE
Click chart to enlarge. Chart courtesy of StockCharts.com.
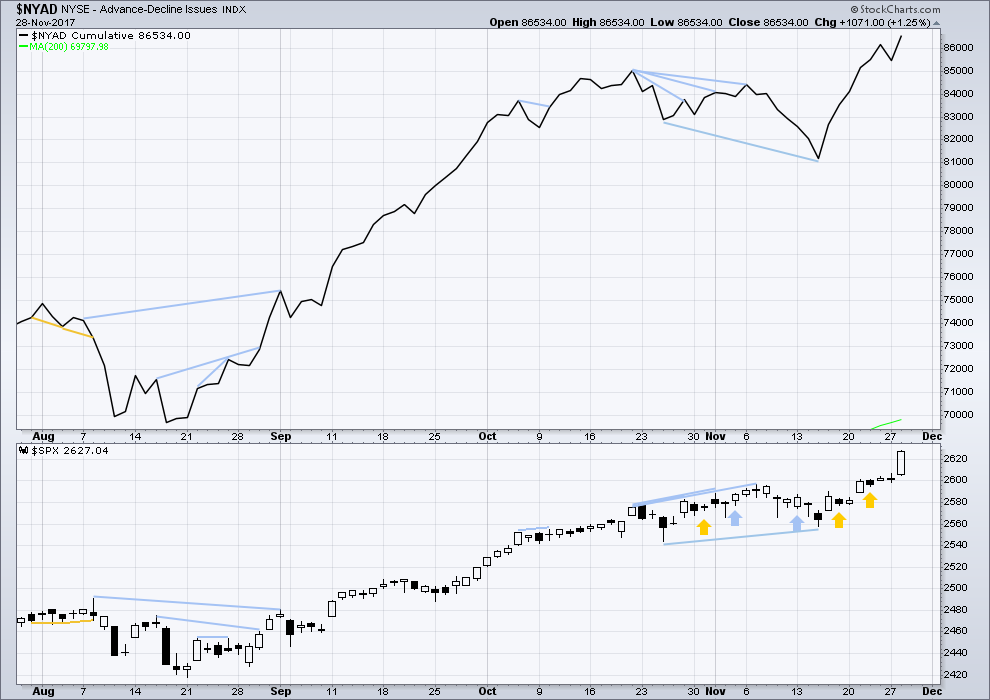
There is normally 4-6 months divergence between price and market breadth prior to a full fledged bear market. This has been so for all major bear markets within the last 90 odd years. With no longer term divergence yet at this point, any decline in price should be expected to be a pullback within an ongoing bull market and not necessarily the start of a bear market.
All of large, mid and small caps last week have made new all time highs. The rise in price has support from market breadth.
Both price and the AD line today moved higher. The rise in price today had support from rising market breadth. This is bullish.
DOW THEORY
Only DJT has not made a new all time high last week. The S&P500, DJIA and Nasdaq all this week made new all time highs.
Failure to confirm an ongoing bull market should absolutely not be read as the end of a bull market. For that, Dow Theory would have to confirm new lows.
The following lows need to be exceeded for Dow Theory to confirm the end of the bull market and a change to a bear market:
DJIA: 17,883.56.
DJT: 7,029.41.
S&P500: 2,083.79.
Nasdaq: 5,034.41.
Charts showing each prior major swing low used for Dow Theory are here.
Published @ 07:26 p.m. EST.
Buying 239 DIA puts expiring next week for 1.35….the current price extreme is mathematically unsustainable….
An epic amount of capital flowing in, all in the absence of any real selling pressure. Quite a few indicators continue to diverge from these series of new all time highs….so interesting!
It’s not impossible we see an epic up move here over the the next 1-3 weeks, as it becomes certain this tax bill is passing. Things looks oddly strong, despite tech today (which may have been a headfake / little 4?) The pricing in may be FAR from over. Borrowing $1.5 trillion from the future to stimulate investment and a little spending now is a hell of a lot of stimulation. These markets start popping again and I’m getta hellah long.
This is education/self-awareness for me, first and foremost. Some of you might benefit from it as well over time. One the unstated learnings I extract from it aside from the self-explanatory ones on the chart…you must be extremely watchful for these kinds of setups and triggers! They don’t happen every day.
This is a 2 hour chart of RUT, going back to mid August.
Cool!
hourly chart updated:
minuette (ii) looks like a possible flat, now minuette (iv) a zigzag which if this count is right should be complete.
another opportunity to enter long? looks like it
I’m a bit suspicious given all the tech weakness that SPX may do a WXY here, with the WX just about complete now, with the Y bottoming on the lower hourly trend line to complete the minuette 4. That’s right about where I have a cluster of retracement fibos (around 2616.5), adding to it’s “strange attractiveness”. Just a suspicion the selling isn’t quite over. I’ve already “bought the dip” in multiple issues that are particularly oversold but relatively lightly, with an intention to be selectively adding on if there’s another push down.
Looks like folk are starting to follow Bezos and Thiel out the back door. Nasdaq futures quite divergent from the giddiness in the other indices…! 🙂
Yet another shooting star in DJI, this time above the upper B band….
VIX coming back down to test 10.50. Will it bounce, or will it break?! 🙂
What is the significance of 10.50?
Was resistance, then support, then resistance….now? 🙂
Opening a “stink bid” to grab a boat load of VIX calls when the lemmings double down…I would not be surprised at another attempt to smash the 10.50 shelf. These calls should go out at least 30 days to allow the pressure to build…. 🙂
Anybody tracking or trading Auto Home (ATHM)? It’s been a “star”. What do they do? Big high quality tents that fold up easily and go on top of your car!! Perfect for my generation, actually, I might even consider one sometime in the future! Anyway, this pullback is setting it up nicely IMO. From 65 to 55 in the last 2 days…
Transports blast off should be giving a Dow Theory bull market confirmation (re-confirmation??) soon, I suspect. Not that we needed confirmation…but hey, the more the better when pushing long chips onto the table!
Sorry if this was already shared but just read the GS as 2,850 target on S&P…..I think S&PO and NASDAQ are done the pulled for near term.
Bitcoin weekly. Just another 17% today. It’s surreal.
Looking for a blowoff top then a trend line breach to indicate a change, then to go short with Bitstamp.
That would be a heck of a counter trend trade, in the face of that kind of firepower! I assume you are wave counting it; some pundits think this is major resistance here and a substantial 4 is due now, you too I guess!!
NASDAQ going to start trading bitcoin futures in 2018..
Leading expanding diagonal from this morning’s high in DJI?
SPX holding for moment at 61.8% retrace of yesterday’s afternoon up move, 2620 ish. So far just a little 4 completely consistent with Lara’s hourly. Despite the sharp selloff in the FAANG stocks driving down the NDX (and to some degree, the SPX here as well). Transports very strong today, and financials, more support for this being a minor correction and an opportunity in progress to get in line with the trend.
O.K. Let see what the VIX short lemmings have in the tank…
DJI at an insane FOUR standard deviations from 21 dema!
I recently read an article in which the author cited the absence of investor euphoria as basis for continuation of the bull run… 🙂
VIX 100 Day MA is at 10.65
200 Day MA is at 11.11 today…
VIX now over the 100 Day MA at 10.84 with the 200 Day MA in sight and within reach!
Once again the B bands are critical. The containment of the price move up, or not, will signal the depth of the correction. Unlike so many other signals, VIX upper B band penetration still reliably signals an imminent VIX reversal….
It just might be too much to expect, but the prisoners of the short vol trade are going to have to short some more vol futures to stay alive. Expect another big red candle and an attempt to push price back below 10.50 by the close…assuming of course they are able…
Taking profits on half my short term long vol positions. Will roll positions farther out on any move back below. 10.00, as well as lower cost basis if possible, on remaining half…
I’m holding 75 percent of them, but had to tag some
You are the smart one! I had a huge stake so still well positioned… 🙂
If anyone wants current proof that the US is run by an oligarchy, just consider the carried interest loophole. $170 Billion is NOT COLLECTED in taxes yearly because of this BS (payments for services out of hedge funds are taxed as capital gains instead of standard income). A small number of ultra rich make out like bandits. Trump (who doesn’t use it, not his business) railed against it throughout his campaign. Now…not a peep. Not a peep from the Republicans. And not a peep from the Democrats either! Those big money folks pay them all for their “services” on the Hill. All of the US congress people are big money corporate shills. Every last one of them. It’s utterly corrupt. Imagine, we are going to remove deductions for interest on graduate student education loans, and raise taxes immediately on those making less than $30k a year (just two of many, many examples of sticking it to the Little People), but allow a few ultra rich to dodge $170 Billion in taxes. The corruption is staggering.
VIX 10.50 was prior support, may now prove resistance. A CLOSE above would be noteworthy…
It is really fascinating how broken market signals have become…gravestone dojis, hanging man candles, massive upper B band penetration, intra-day gap fills, impulsive five wave declines, etc, all no longer suggesting even the mildest of retreats, but rather seeming to spur an even greater frenzy of buying. Fascinating!!
I guess that stuff goes by the wayside in one of (if not the) greatest bull market in history! Of course it’s all a huge multi-year in progress blow-off top leading to the end of the Grand Supercycle…but that top’s a ways out still. I’m thinking 2020-2022 for that, perhaps even later. We need that massive deficit spending/wealth transfer to the already extremely rich to play out, leading with certainty to the largest recession/depression in history. Everything is lining up perfectly to support the big picture EW count! Fascinating, that.
The BTFD crew has launched into action.
Will they win or Lose this time??? or just shoot their final _ _ _ _ !
In that regard, I like HAL and FSLR here. I bought a tad of FB and NFLX too, with intention to double/triple lower down as needed. AVGO as well; looks well oversold! They ain’t staying down long. This is all just a smallish 4. Market is going back up soon enough. Way up. EW says so.
The measured rule target of 2634 is reached. As Lara said, if we keep going up, the next target is 2773. At that point the 2900+ target doesn’t see so far fetched. I think we are seeing an extension Minor and Minute degrees.
I agree Kevin with the XIV divergence. Looking for a correction to add some long positions.
You and me Rodney. Time to play “guess the bottom”. I see an interesting confluence of retrace fibo’s around 2616, though I’ll also be watching 2620 (61.8% of yesterday’s final move) very closely. At the moment the 38% of that move is holding, and it’s length is symmetric with yesterday’s mid-day pullback. Also watching the FAANG group closely to see if they come to a lazy stop to their fall…or do a sharp V bottom and start trending strongly straight back up. I’m expecting “more” selling overall here rather than an immediate resurgence of the bull trend, as Larry Williams calls it, “backing and filling”.
Unfortunately for me, I am traveling today and will be away from my computer starting in the next hour or so. Isn’t that some sort of modern Murphy’s Law – “When you need to trade you can’t get to a computer!”
Yea, or it doesn’t boot, or your u-verse modem has died. I suspect this pullback last all day frankly. If this market shoots up strongly into new highs today, I will be pretty mind blown, the FAANG sell off was very sharp and fairly deep. I expect a day or two for things to settle and turn.
It would seem that in the face of relentless new all time highs, someone sees the need to acquire some downside protection as VIX quietly moves higher. The current levels, however, still prove that unwinding the monstrous short vol trade is the farthest thing from the minds of the masses. I remain greatly intrigued by this situation and think its eventual resolution will be the most interesting market event we will see in our lifetimes. Whispers are beginning to circulate that this trade CANNOT be unwound – there is no one big enough (or foolish enough) to take the other side. Oh I am sure there will be a bid, but the short vol cohort will not be able to afford it….how long can they keep VIX under 15? I expect the big red candles to continue as they have no choice. One day VIX will spike to 18 or higher….game over!
VIX 18 in 2018. Interesting as such an opportunity knocks.
VIX 100 DMA is at 10.65
200 DMA is at 11.11 today…
Right Now 10.52 up 48 … both within reach.
$DJI about to go below its open of 23,883.86 … within 30 pts
NDX has rolled oved and at lows currently for today.
COMP has also rolled over and currently at lows for today.
RUT looks to be topping.
Hmmm. All I know is, I have a sharp downtrend line on XIV 5 minute chart, and when that gets busted to the upside, I’m buying a wad!! The epic VIX spike/XIV crash of the future will have wait a bit.
Big profit taking on FAANG stocks this morning (has to be institutions). Meanwhile, VIX futures as represented by XIV in bearish divergence yet some more with rising SPX. Hmmm….me thinks an SPX top (start of some kind of multi hour or several day 4) may be very, very close here. May be.
Price stalling at Lara’s first target of 2634…
Norway, Sweden and the Saudis
They would have to file with SEC ahead of those kinds of liquidations. Distribution underway it would seem. Nothing new under the sun.
They are probably getting CB cover with this run-up. What a system!
Verne, I heard Our old buddy has the major top as in (Four of a kind + a wild card for 5 of a kind) for the DOW once it rolls over and breaks below last weeks lows. 3rd hit of 1/3 trend line with throw over.
Interesting. I kinda miss those guys!
He made the exact same call just about a month ago. lol! 🙂
5 degrees of 5 currently on a throw over of 1/3 line.
It was updated to this as of last night I was told. Just need DOW to go below last weeks lows and then see how strong & sharp down.
I found it quite strange that more people did not follow Bezos and Thiel out the exits. Are investors these days really THAT stupid??!!
VIX up 32 to 10.35
NDX has rolled over!
The purpose of the tax bill was made clear from the core of it, but many individuals are nonbelievers, actually tax reform could be changed again by a Democratic president within a couple years. The next president could once again challenge it and change it after Trump is out of office. Overriding tax policy again in the future could be the biggest campaign contributor. So confidence on taxes could be resolved in the future.
You mean in 8 years!
Q3 GDP 3.30% with Capital Investment/Expenditures increasing for the 1st time in 17 Years and that is ahead of Tax Reform taking effect.
100% Expensing which will start Jan 1st (Upon Approval) … Will Spike Capital Investment/Expenditures for the next 5 Years.
That increase PROVES Capital Investment/Expenditures to Grow Revenue Production in the USA WILL CERTAINLY end or greatly curtail Stock Buy Backs. You ain’t seen nothing yet!
What is interesting… the 30 Year Treasury Yield spiked to 2.81% from 2.77% on the news. Lets see if that continues… To confirm if Yields have truly started to higher levels, 30 Yr Yield must break above 3.26% and accelerate higher from there. If not, Yield curve to flatten to within 10 basis points all across the Treasury Yield Curve at all maturities.
Another 100 Year Bond Issued… Wonder what the Yield will be?
Oxford University To Issue £250 Million Ultra Long 100-Year Bond
Individual Oxford colleges – there are thirty-eight altogether – have issued bonds in the past, but this will be a first for the ancient university as a whole. Timed to perfection for its upcoming bond issue, Moody’s today assigned a “AAA” credit rating with a stable outlook to the 900-year old institution.
Oxford’s credit quality benefits from its strong balance sheet which includes a large endowment and displays low leverage. Oxford’s endowment reached GBP2.6 billion in 2016, up from GBP1.4 billion five years ago. Debt will increase following a planned bond issuance in Q4 2017. However, because of the low historical debt the post-bond issuance leverage will remain below that of international peers.
Target =2,666
Low Close 2008 -09 = 666
Perfect spot for a End of it all! What did Elliott call this? Perfect Symmetry
Up Up and away!!
Where is everyone?
They’re waiting for Lara’s analysis. But we know it’s early today. Shhh… let’s not tell!
Actually we are all studying up on Climate Change (which used to be called Global Warming) so that we will have something to write about here on this site tomorrow.
and had its origin as Global freezing.
So from freezing to warming to just change.
Joseph I just read your comment to my query on the last thread and you are right. I do indeed remember that great debate you referenced. Sadly for many, grant proposals don’t get funded if you are on the “wrong” side of some of these debates.. 🙂