
An upwards breakout was expected after some more sideways movement. The upwards breakout has come a little more quickly than expected, but movement above 2,590.09 in the first hour of trading was a signal that the main hourly Elliott wave count was correct. Members then should have used the first target, which remains the same.
Summary: The first Elliott wave target is again at 2,614. A target using the measured rule is 2,634. The second Elliott wave target is 2,773. As price approaches each target, if the structure is incomplete and there is no weakness in price, then the next target will be used. But if price approaches a target and the structure is complete and there is some classic weakness, then a high may be in place
Always trade with stops and invest only 1-5% of equity on any one trade. All trades should stick with the trend. The trend remains up.
Last monthly and weekly charts are here. Last historic analysis video is here.
MAIN ELLIOTT WAVE COUNT
WEEKLY CHART
Click chart to enlarge.
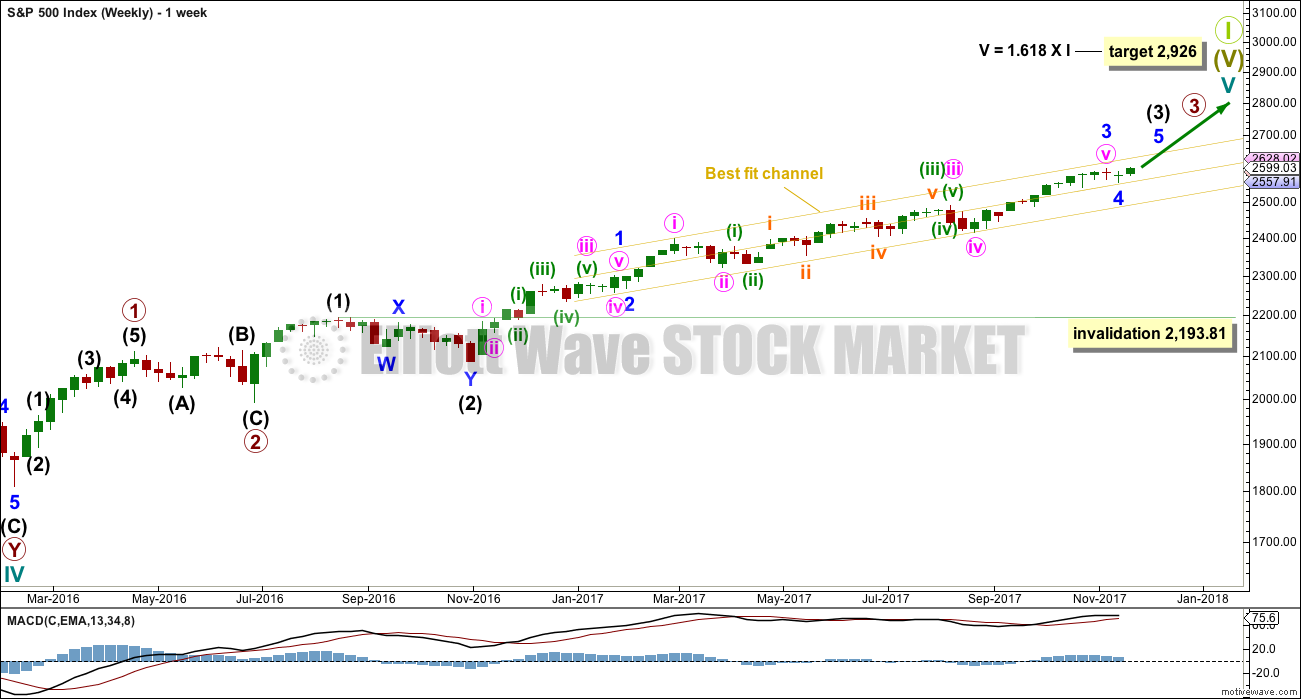
Cycle wave V must complete as a five structure, which should look clear at the weekly chart level. It may only be an impulse or ending diagonal. At this stage, it is clear it is an impulse.
Within cycle wave V, the corrections for primary wave 2 and intermediate wave (2) both show up clearly, both lasting several weeks. The respective corrections for intermediate wave (4) and primary wave 4 should also last several weeks, so that they show up at weekly and monthly time frames. The right proportions between second and fourth wave corrections give a wave count the right look.
Cycle wave V has passed equality in length with cycle wave I, which would be the most common Fibonacci ratio for it to have exhibited. The next most common Fibonacci ratio would be 1.618 the length of cycle wave I.
Intermediate wave (3) may now be nearing completion. When it is complete, then intermediate wave (4) should unfold and be proportional to intermediate wave (2). Intermediate wave (4) may be very likely to break out of the yellow best fit channel that contains intermediate wave (3). Intermediate wave (4) may not move into intermediate wave (1) price territory below 2,193.81.
DAILY DETAIL CHART
Click chart to enlarge.
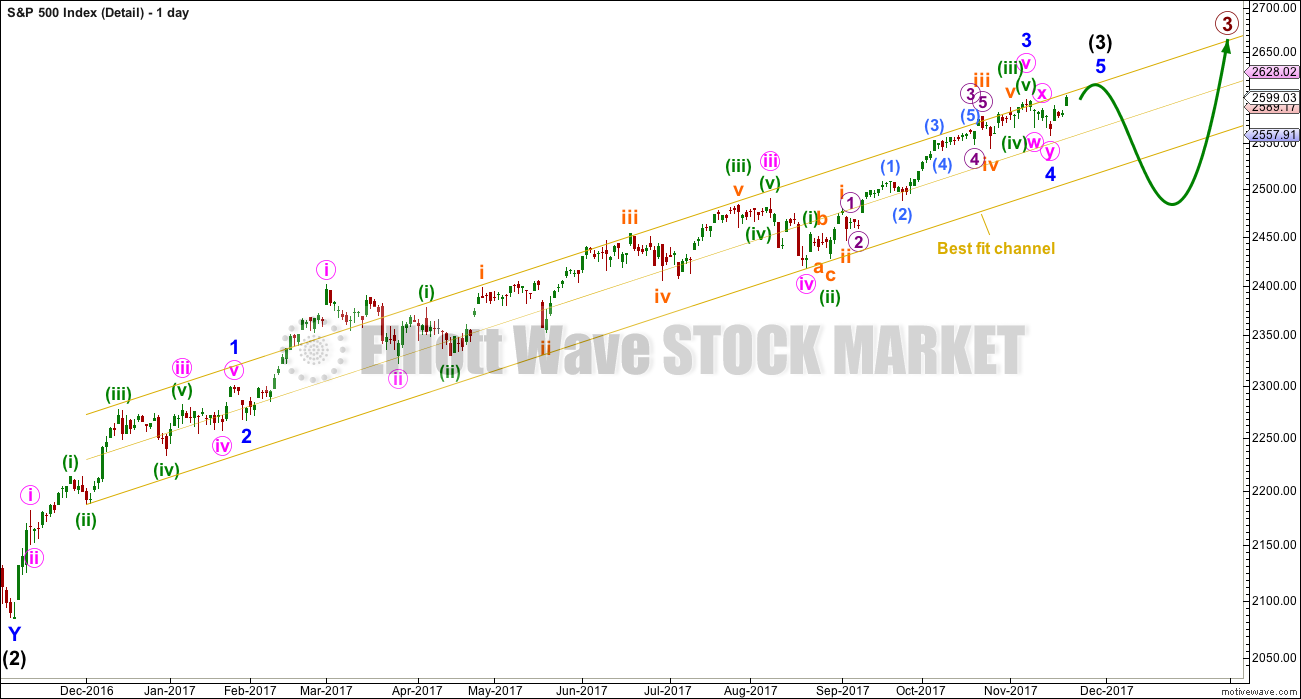
For transparency, this chart shows all subdivisions so far within intermediate wave (3). This is not the only way to label this movement, but all subdivisions here fit at the hourly chart level.
The proportions are not perfect, but then the S&P just does not always exhibit great proportion. The more important issue for this market in my opinion is that the subdivisions fit.
DAILY CHART
Click chart to enlarge.
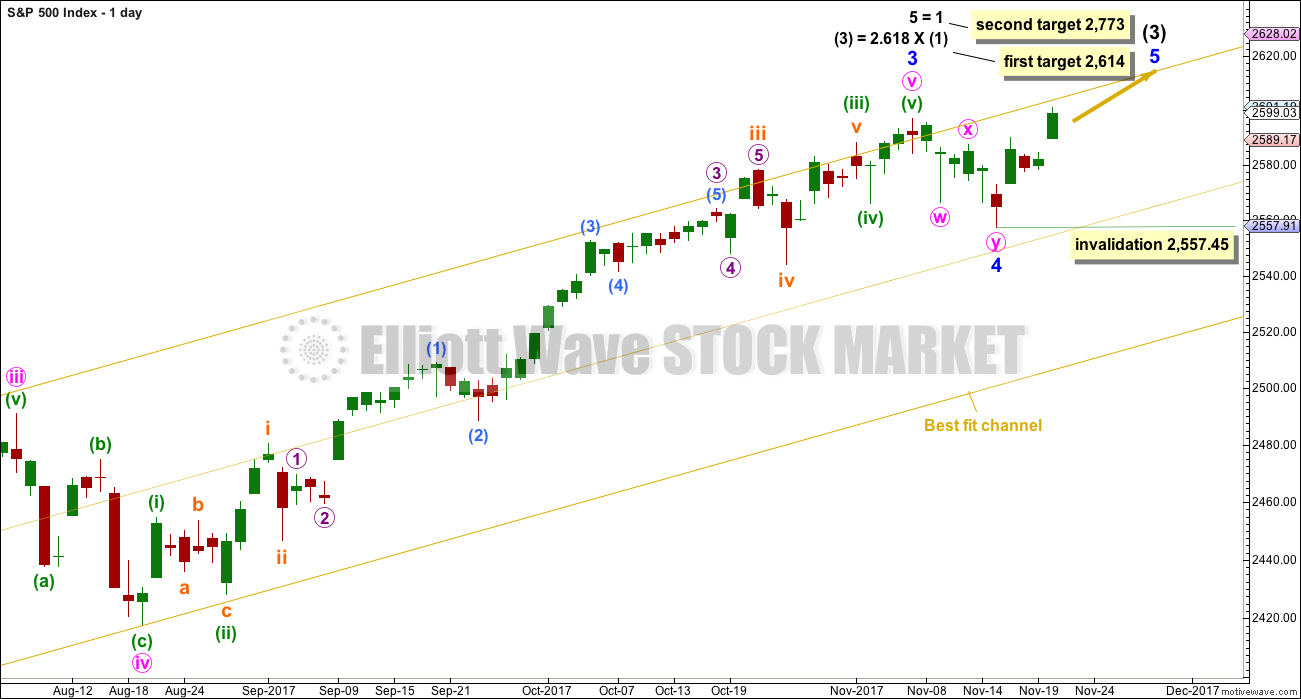
Minor wave 4 may now be complete. It will subdivide very well as a double zigzag. This provides only a little alternation in structure with the single zigzag of minor wave 2. There is also poor alternation in depth: minor wave 2 was very shallow at only 0.16 of minor wave 1, and minor wave 4 would be only 0.12 of minor wave 3. Alternation is a guideline and not a rule; it is seen more often than not, but not always.
The first target at 2,614 would see a Fibonacci ratio between intermediate waves (3) and (1), but no Fibonacci ratio for minor wave 5. This would be acceptable. There is already a somewhat reasonable Fibonacci ratio between the two actionary waves of minor waves 3 and 1, so minor wave 5 may not exhibit a Fibonacci ratio to either of minor waves 3 or 1.
The second target calculated for minor wave 5 expects it to exhibit the most common Fibonacci ratio for a fifth wave. This target would not expect a Fibonacci ratio for intermediate wave (3) to intermediate wave (1).
If price gets up to the first target, and the structure may be complete and there is some divergence with price and Stochastics or RSI, then members are warned that it would be possible for a high to be in place for the mid term. But if price keeps rising through the first target, then the second target would be used.
Within minor wave 5, no second wave correction may move beyond the start of its first wave below 2,557.45.
HOURLY CHART
Click chart to enlarge.
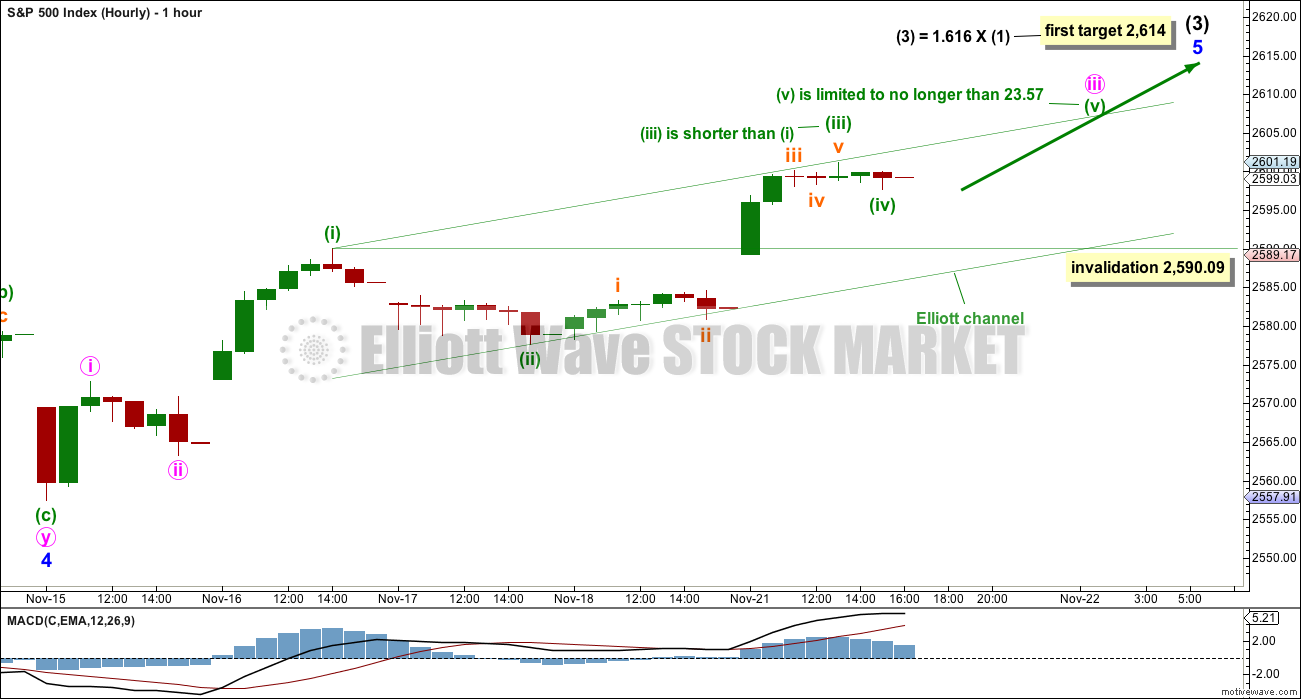
At the hourly chart level, this wave count is new. This wave count would fit very neatly with the first Elliott wave target at 2,614.
Within minor wave 5, it may be that minute wave iii is developing as a very long extension. This is typical behaviour for the S&P.
Minute wave iii may only subdivide as an impulse. Within minute wave iii, minuette waves (ii) and (iv) should be clear; here, they are. This has a typical look despite minuette wave (ii) being longer in duration than minute wave ii one degree higher.
Minuette wave (v) is limited in length, so that minuette wave (iii) is not the shortest actionary wave within the impulse and the core Elliott wave rule is met.
Minuette wave (iv) may not move into minuette wave (i) price territory.
This wave count expects overall upwards movement for another few days. If minor wave 5 exhibits a Fibonacci duration, then it may continue for another four days to total a Fibonacci eight. Along the way up, minute wave iv should show up as at least one red daily candlestick or doji at the daily chart level.
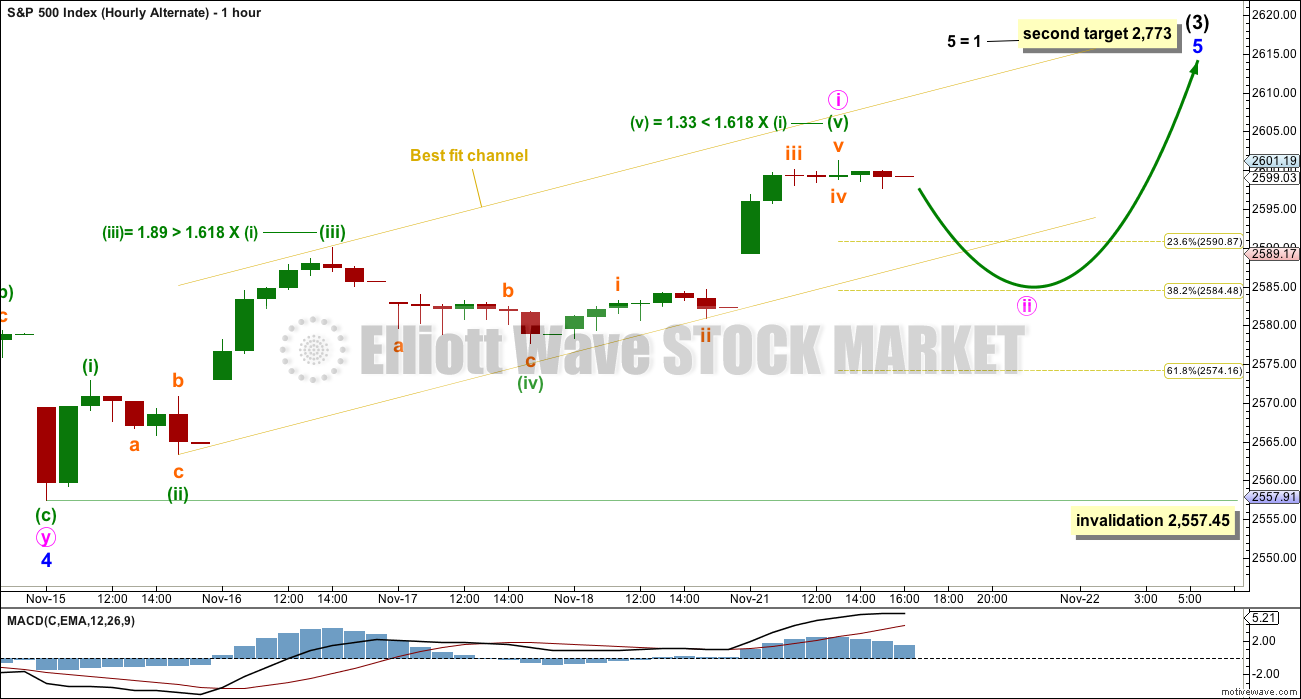
ALTERNATE HOURLY CHART
Click chart to enlarge.
A five up may be complete. This may only be minute wave i within minor wave 5.
This wave count would now expect a pullback for minute wave ii. However, a bullish signal from On Balance Volume should be given reasonable weight; the signal supports the main hourly Elliott wave count and not this alternate.
Minute wave ii may end about either the 0.382 or 0.618 Fibonacci ratios. The first small second wave correction for the S&P is sometimes shallow, and that is why I have put the label for minute wave ii closer to the 0.382 Fibonacci ratio. Members should be aware of this possibility.
The next target for this alternate wave count, at 2,773, has a better fit.
It is of course possible to move the degree of labelling within minute wave i all up one degree to see minor wave 5 complete at today’s high; if so, then the entirety of intermediate wave (3) could be complete today. This idea would be charted and considered seriously if price and technical signals become more bearish. That is not the case today.
TECHNICAL ANALYSIS
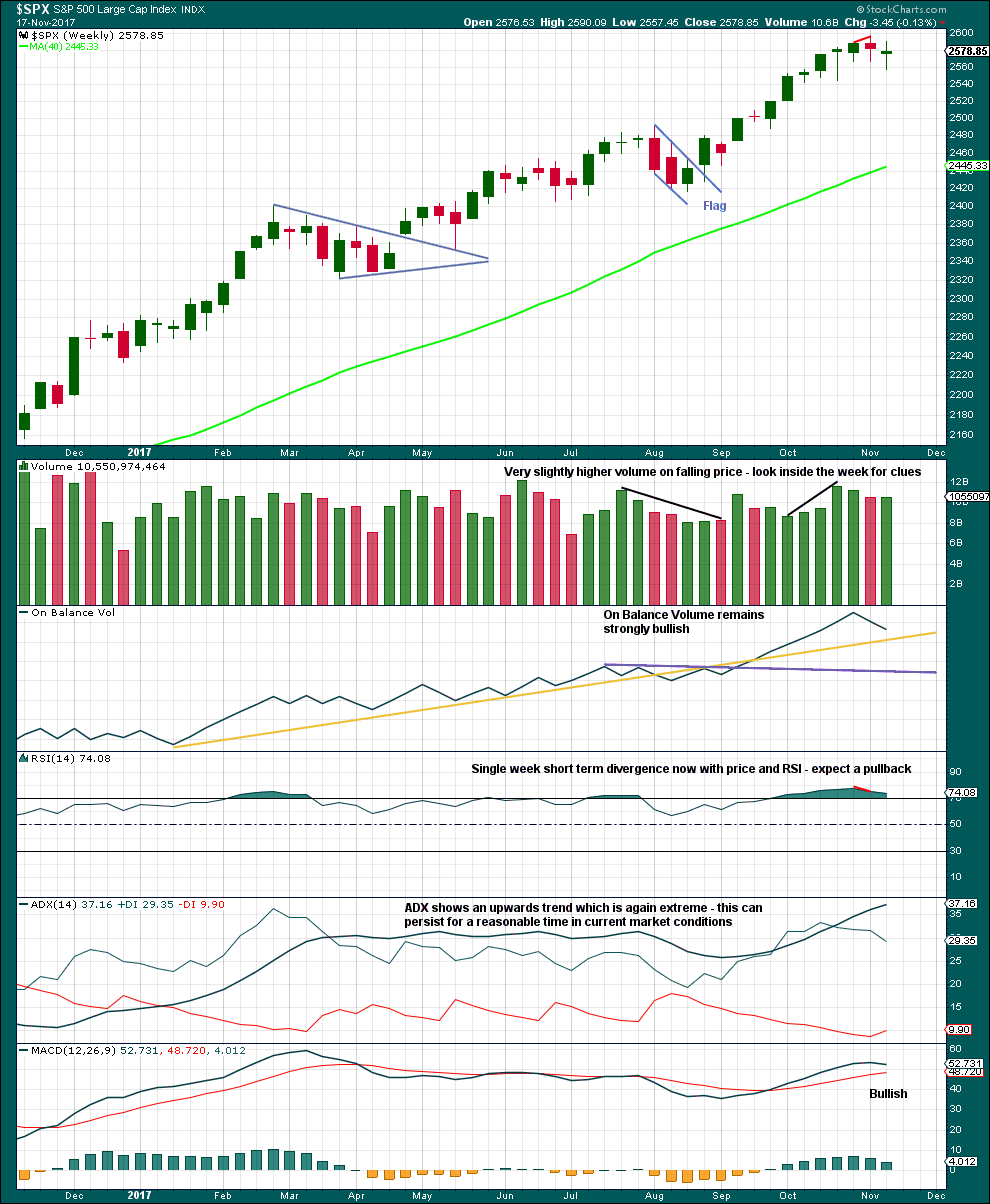
WEEKLY CHART
Click chart to enlarge. Chart courtesy of StockCharts.com.
A small range, downwards week completes as a small doji. This indicates a balance of bulls and bears and indecision. At this stage, this small week does not look like a convincing beginning of a new downwards trend, and looks much more like a small pullback within an ongoing upwards trend that should be used as another opportunity to join the trend.
There is a little distance below before On Balance Volume finds support. It is entirely possible that the pullback is not over.
DAILY CHART

Click chart to enlarge. Chart courtesy of StockCharts.com.
Reasonable weight will be given in this analysis to the bullish signal from On Balance Volume, which is now very clear. This has proven to be a very reliable indicator recently. Volume, ADX and ATR are also bullish.
Only MACD is bearish now.
Bollinger Bands do show some weakness though, which is entirely reasonable if the Elliott wave count is correct and price is within a fifth wave. For the S&P, fifth waves do most commonly exhibit weakness towards their end.
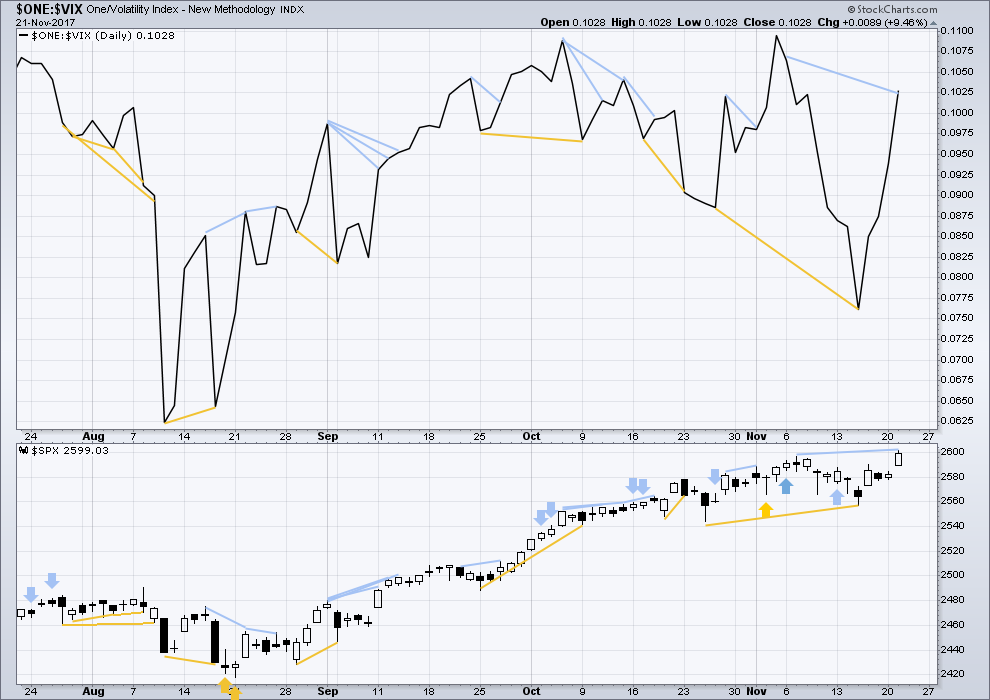
VOLATILITY – INVERTED VIX CHART
Click chart to enlarge. Chart courtesy of StockCharts.com.
So that colour blind members are included, bearish signals will be noted with blue and bullish signals with yellow.
Normally, volatility should decline as price moves higher and increase as price moves lower. This means that normally inverted VIX should move in the same direction as price.
The last divergence noted was bullish. It has now been followed by two upwards days, so it may now be considered resolved.
There is regular bearish divergence today between price and inverted VIX: price has made a higher high, but inverted VIX has not. This indicates underlying weakness. However, very little weight will be given to this divergence today as it has not proven to be very reliable lately.
BREADTH – AD LINE
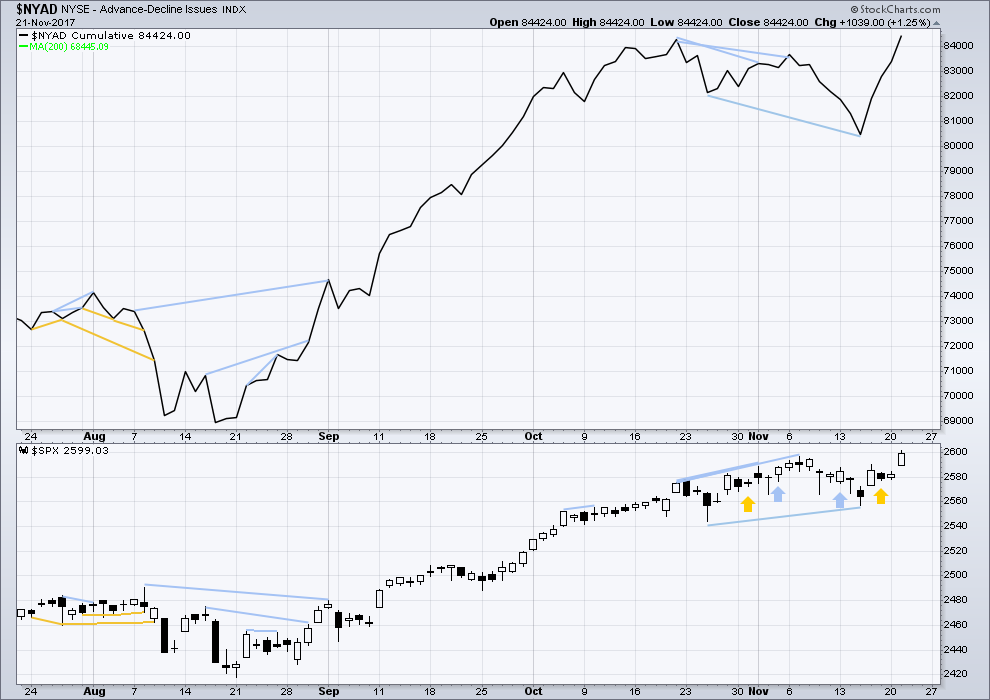
Click chart to enlarge. Chart courtesy of StockCharts.com.
There is normally 4-6 months divergence between price and market breadth prior to a full fledged bear market. This has been so for all major bear markets within the last 90 odd years. With no longer term divergence yet at this point, any decline in price should be expected to be a pullback within an ongoing bull market and not necessarily the start of a bear market.
Mid and large caps last week moved lower, but small caps moved up to make a high above the prior week. Small caps are strongest and may be leading the market at this time.
Last divergence noted was bullish and has now been followed by two upwards days and a new all time high. It may now be considered resolved.
Both price and the AD line have made new all time highs today. The rise in price today had support from rising market breadth; this is bullish.
DOW THEORY
Only Nasdaq has made a new all time high this week. The S&P500, DJIA and DJT have not yet made new all time highs.
Failure to confirm an ongoing bull market should absolutely not be read as the end of a bull market. For that, Dow Theory would have to confirm new lows.
The following lows need to be exceeded for Dow Theory to confirm the end of the bull market and a change to a bear market:
DJIA: 17,883.56.
DJT: 7,029.41.
S&P500: 2,083.79.
Nasdaq: 5,034.41.
Charts showing each prior major swing low used for Dow Theory are here.
Published @ 09:33 p.m. EST.
German DAX trade looking promising…! 🙂
I see a completed 1-2-3-4 in the RUT starting at the mid-August lows. The 5 up has just reached (slightly exceeeded) the length of the 1. Though I can’t really easily count the 5 up; it appears to me (the uneducated) as rather incomplete. That said, I would expect a rough “harmonic matching” of this 5 wave up in the RUT to complete about the same time the SPX completes it current minor 5 up. Then it’s get short time.
I am still hoping to find the time to do a full RUT analysis
sorry for the delay everybody 🙁
No worries. It’s worth the wait! 🙂
Updated hourly chart:
so far, so good
a bit more labelling on this here today
as soon as minuette (v) makes a new high, look out, it could be over fairly quickly because it needs to be shorter than minuette (iii)
as soon as we can see a new high above 2,601.19 (the end of minuette (iii) ) then the invalidation point must move down to the high of minute i at 2,572.84
but minute iv shouldn’t be too deep, it should remain within a channel
Interesting. VIX hammer ahead of a new 52 week low, which is what I expected (new low).
Could this be interpreted as bearish divergence? Not sure. Signals have been inconsistent of late so we will see….I think the key is the open gaps….
What’s likely with the VIX if/as SPX price moves up to 2700, then 2800, then 2900? Yes, “it goes down”, but by increasingly small units? I.e., there’s a limit to how low SPX options will get priced? Just wondering, given both appear headed for “new lands” soon, and because I like to trade XIV which is driven (inversely) by the VIX (via the VIX futures market).
I’m thinking the 23.4% retracement at 2595.5 might hold SPX here. Otherwise, the next stop down is about 2592, the 38.2% retrace (of Nov 20 end of day low to yesterdays high)
A low for the day (so far…) of 2595.44, I love fractal market geometry. Also, buy triggers on the 5 minute, cross ema’s, swings highs taken out, and a break of the downchannel. I bought some XIV to try and pay for lunch…
INCY is for sale on deep discount, and appears to be starting a possible V bottom move back up.
The new hourly is quite interesting, and so far, the action is supporting it. Next week there just might be some serious fireworks in either direction though, as the tax theft plan by the US oligarchy gets resolved one way or another. Part of me wants to get real long…part of me thinks that a few Republican senators with a tiny shred of concern for the citizenry vs. allegiance to the oligarchy will vote “no” and block this dumpster fire of a bill, and that will kick off the intermediate 4 in a nano-second, with an initial giant move down to scrub much of the pricing in already performed.
well, I can’t opine on what’s happening with US politics, but I am expecting intermediate (4) to show up in the reasonably foreseeable future
Me too!
Great risk/reward on a great company there; like INCYs long term potential as well. Only thing I don’t like is that institutional ownership is at 94 percent long; usually that caps upside when they are already in a growth name that heavy
Interesting, thanks Chris. “I’m just in it for the V-bottom”, he he!!
Shorting IWM Gap fill
Very nice doji being printed above upper B band.
NORMALLY, quite a reliable reversal signal….! 🙂
Let’s see if it fills out. If not I will be adding to my TZA leaps….
IWM doji morphed into shooting star but still looking good. Grabbed a few Dec 15 150 strike puts for 1.57 apiece. Open STC order for 2.10….
In the green, but hoping the classic signal and little bit of luck works again!! Happy Thanksgiving everyone!
Thanks Chris. And to you and your family as well!
Has anyone seem retail vs. commercial interest on S&P futures? It will be useful to see how each side is situated for trading. Common thinking calls for retails to be on the wrong side of the trade.
Commercial interest, as reported by the CFTC has shown immense short interest vs. speculators. Theorists in my space have said the FED directs that positioning and when the press control p and send funds to say JPM they also have them cover the short position to make the market rip. Since July 2016, net short has been been 4 and 7 to 1. Like the wave theory, i believe those traditional signals no longer carry the weight they once did.
Chris,
I don’t doubt that traditional technical indicators are being manipulated to the hilt. Just was wondering if we can somehow get an early warning of the likely outcome (with some level of confidence) but I guess we work the market as it presents to us not getting overly dependent on technical reads.
I believe it. It is so clear to me as a trader that short sellers are being systematically targeted and ambushed and it has been happening for several years now. Even positioned correctly if you have not been taking profits quickly on short trades, whatever vehicle you are using, you got whipsawed. I have never accepted that this is Co-incidental. I cannot explain how it meshes with EW theory but I do know what I have been seeing over and over again for many years now. This is why I have often opined that the market will not head South if CBs can arrest the decline, so when it does, as it eventually will, it will probably be unlike anything we have seen before…we continue the longest period in market history without a 5% or more correction. Someone mentioned the remarkable brevity of the corrective waves so this may be one way the intervention is manifesting itself..
Overnight Sunday, all 5 (G20 Banksters)of them came in huge to hold up the major indexes.
One thing to keep an eye on is a market falling on low volume.
That is significant as it would be declining in the absence of any intense selling pressure. The implication is that the market must have constant injections of liquidity, not only to advance, but to avoid falling under its own bloated weight…
The march higher has been proceeding on low volume for years. Few are thinking about what this means in the even of a real market rout…
Chris I have a question. I am really scratching my head when I hear people dismiss some of the things we say about market price action and the only thing I can conclude is that perhaps they don’t really trade the market. How can you not see this happening right before your very eyes???
Are we crazy????!!! Don’t worry, its rhetorical… 🙂
And how do you know their rational was “hold up the indexes”, vs. “make a ton of money on the coming waves up”? I actually believe Lara’s calls. And I’m quite certain the banks have access to similarly qualified EW people. How do you know they aren’t doing this because it’s simply a highly profitable play? Occam’s razor says it is because they think they are going to make serious coin, not to “prevent plunge”, as I see it. The corollary of that would be the insanity (?) of jamming more and more assets into a market that they “think is going to go down”, under some possibly delusional idea that they can hold it up.
I have a question about that. These central banks, with their “plunge protection teams”, are told by the top brass to do exactly WHAT? Invest EVERYTHING to prevent market drops? Or…just some of the banks assets? You see, it seems hard to believe that a bank would take a position of “we will use all our assets to stop market downmoves”. Really??? No limits? That just can’t be. Seems MUCH more reasonable to me that they would be told, “if the market moves down THIS much…sell everything!”. Cuz first out the door does best when the rush starts, right? Buying into a true market “plunge” with all the banks assets is not a strategy I would expect the bank rulers to adopt. Ergo, is it possible that what you call “plunge protection buying by CB’s” is just another form of “buying the dips”, for the reason that the banks have a pretty good clue about the market, etc.? But maybe I’m misunderstanding something about it?
Got it! Ha Ha you silly wabbit.
hot rod
Sorry guys…had to make a deposit in my own hot rod! 🙂
LOL
you guys make me laugh pretty much every morning 🙂
🙂