
Downwards movement was overall expected, but it was expected that price should have a short term bounce first. Downwards movement is now choppy and overlapping, suggesting an Elliott wave diagonal may be unfolding.
Summary: The target for a multi day pullback is still about 2,539.
If price makes a new high tomorrow above 2,578.64, then it would be possible that the pullback is over already. A target would then be at 2,773.
Pullbacks and consolidations at their conclusions offer opportunities to join the upwards trend.
Always trade with stops and invest only 1-5% of equity on any one trade.
Last monthly and weekly charts are here. Last historic analysis video is here.
MAIN ELLIOTT WAVE COUNT
WEEKLY CHART
Click chart to enlarge.
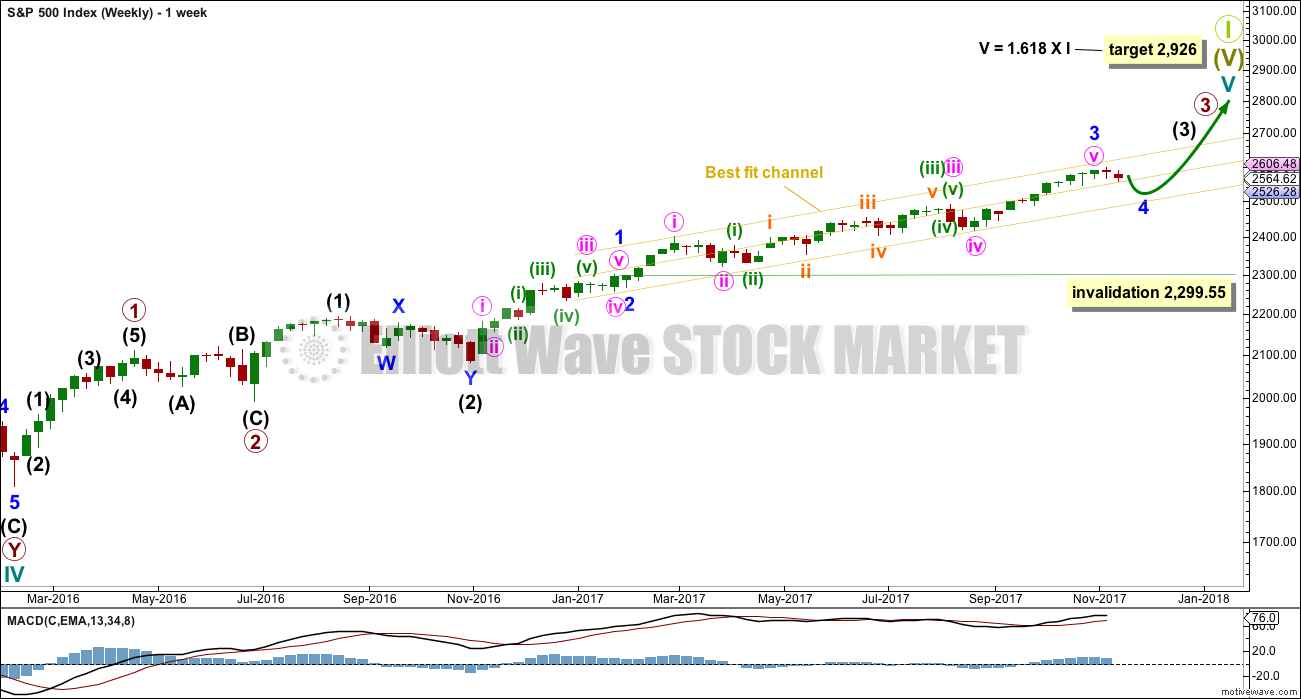
Cycle wave V must complete as a five structure, which should look clear at the weekly chart level. It may only be an impulse or ending diagonal. At this stage, it is clear it is an impulse.
Within cycle wave V, the corrections for primary wave 2 and intermediate wave (2) both show up clearly, both lasting several weeks. The respective corrections for intermediate wave (4) and primary wave 4 should also last several weeks for the wave count to have the right look at the weekly and monthly time frames, so that they show up at weekly and monthly time frames.
Cycle wave V has passed equality in length with cycle wave I, which would be the most common Fibonacci ratio for it to have exhibited. The next most common Fibonacci ratio would be 1.618 the length of cycle wave I.
Intermediate wave (3) looks incomplete. It may only subdivide as an impulse. Within intermediate wave (3), minor wave 4 is currently unfolding and may not move into minor wave 1 price territory below 2,299.55. However, minor wave 4 should remain contained within the yellow best fit channel if this wave count is correct.
DAILY CHART
Click chart to enlarge.
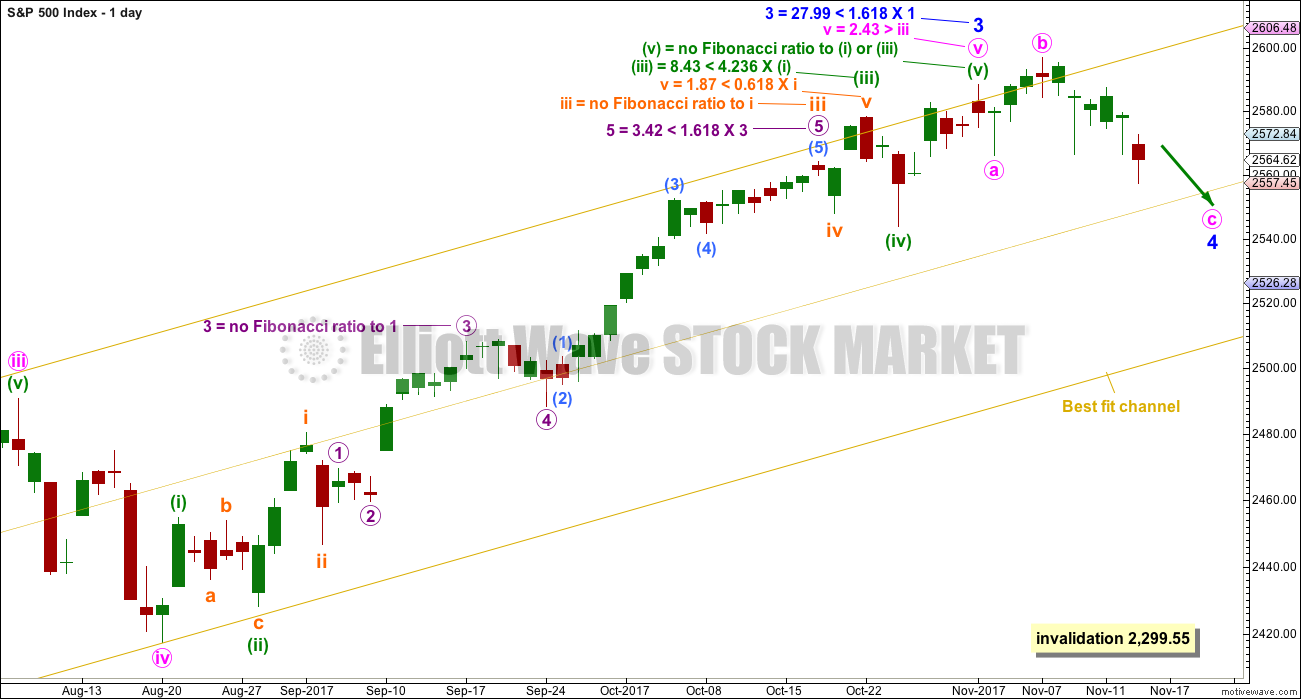
Minor wave 4 is so far a very shallow and overlapping sideways movement. When it is complete, the breakout is expected to be upwards. Minor wave 4 may end when price finds support about the mid line of the yellow best fit channel.
Minor wave 4 may be any one of multiple corrective structures. There is also variation in where the end of minor wave 3 may be seen. This first wave count sees minor wave 3 over earlier and minor wave 4 an expanded flat correction. This would provide alternation with the zigzag of minor wave 2.
So that members may compare this wave count with a new alternate below, Fibonacci ratios at minor degree and below to micro degree are provided on both daily charts. The ratios are overall slightly better for this main wave count.
At its end, minor wave 4 should offer a good entry point to join the upwards trend.
HOURLY CHART
Click chart to enlarge.
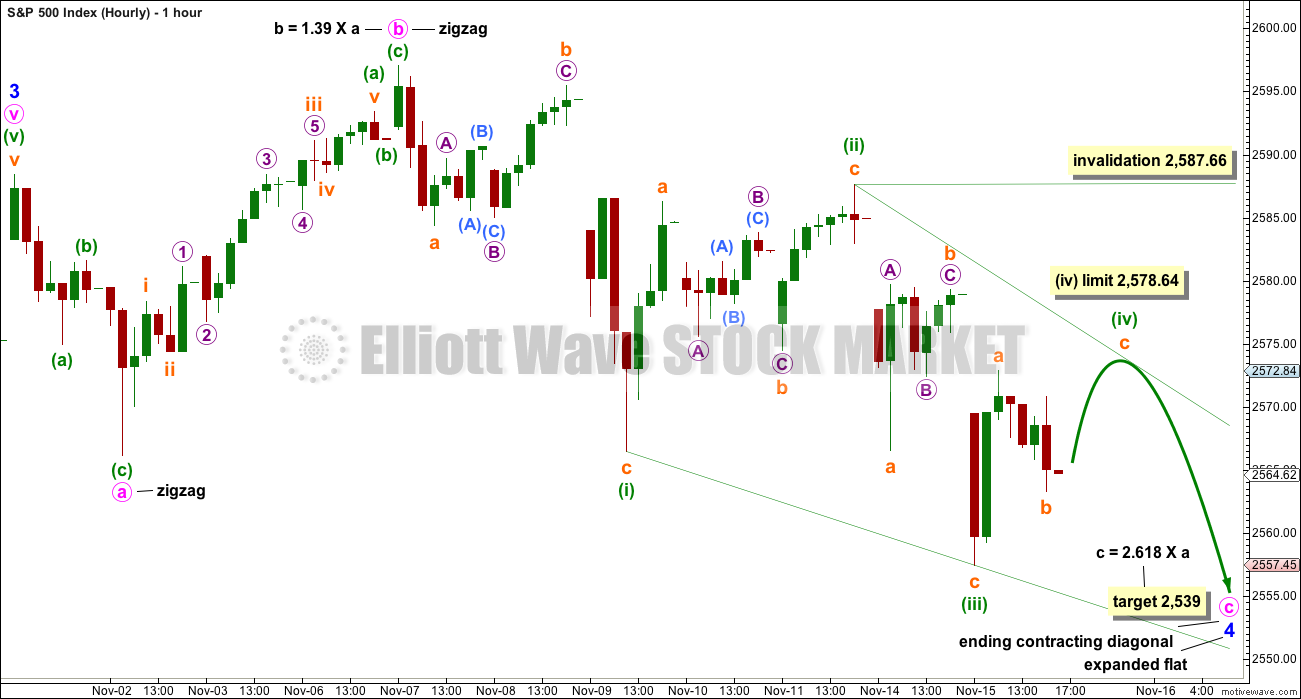
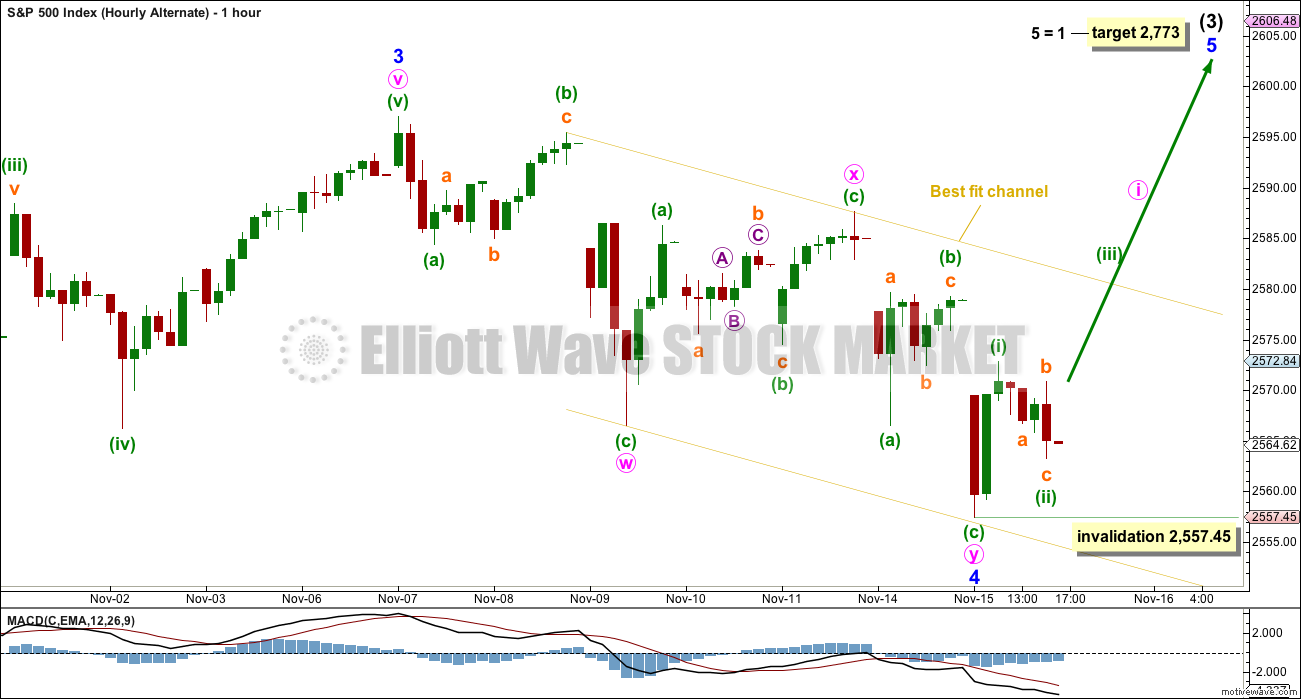
Minor wave 4 may be an expanded flat correction. This would provide very good alternation with the zigzag of minor wave 2.
Within a flat correction, both minute waves a and b must be three wave structures. Here, they are both zigzags. Minute wave c must be a five wave structure, either an impulse or an ending diagonal. The overlapping downwards movement of the last days suggests a diagonal.
Most common diagonals are contracting. Minuette wave (iv) must end before the limit, so that it is shorter than minuette wave (iii), meeting the rule regarding wave lengths for contracting diagonals. If price moves above this limit, even prior to a full invalidation of this wave count, then a contracting diagonal would be invalid and this wave count would be discarded upon that basis.
The final fifth wave of a contracting diagonal almost always overshoots the 1-3 trend line. Here, as soon as downwards movement shows a small overshoot of the green (i)-(iii) trend line, then a quick sharp reversal may happen.
If the target at 2,539 is wrong, then it looks now to be a little too low. When minuette wave (iv) is complete, then the starting point for minuette wave (v) may be determined, and a limit for it to not be longer than minuette wave (iii) may be calculated. That cannot be done yet.
ALTERNATE WAVE COUNT
DAILY CHART
Click chart to enlarge.
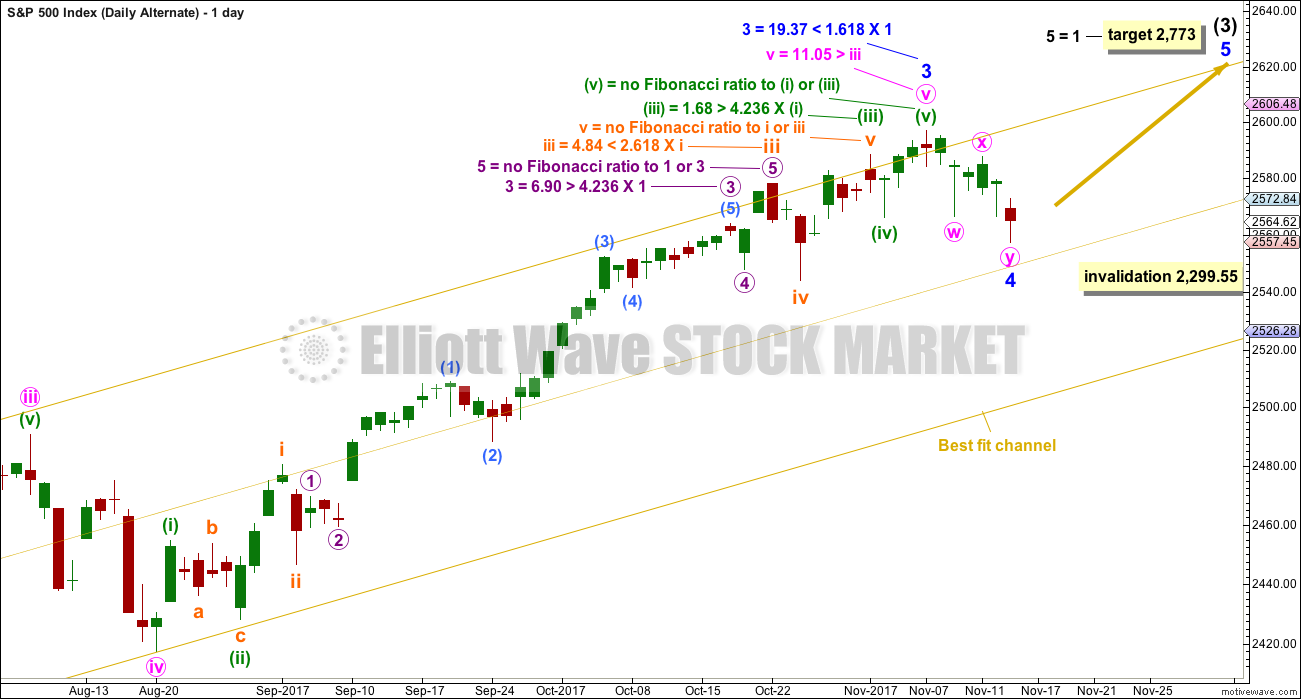
It is possible that minor wave 3 was over at the last all time high. Fibonacci ratios are given, but they are not quite as good as the main wave count’s ratios.
If minor wave 3 was over at that last high, then minor wave 4 may now be a completed double zigzag. This would not offer very good alternation with the single zigzag of minor wave 2. There is a little alternation though, in depth: minor wave 2 was relatively deep whereas minor wave 4 here would be very shallow.
HOURLY CHART
Click chart to enlarge.
The double zigzag has a very good fit. The subdivisions are seen in exactly the same way for this portion of movement between both wave counts.
If minor wave 4 is over, then within minor wave 5 the correction for minute wave ii may not move beyond the start of minute wave i below 2,557.45.
A new high above 2,578.64 would see the probability of this wave count increase. If that happens, then look out for an imminent upwards breakout to a new all time high.
TECHNICAL ANALYSIS
WEEKLY CHART
Click chart to enlarge. Chart courtesy of StockCharts.com.
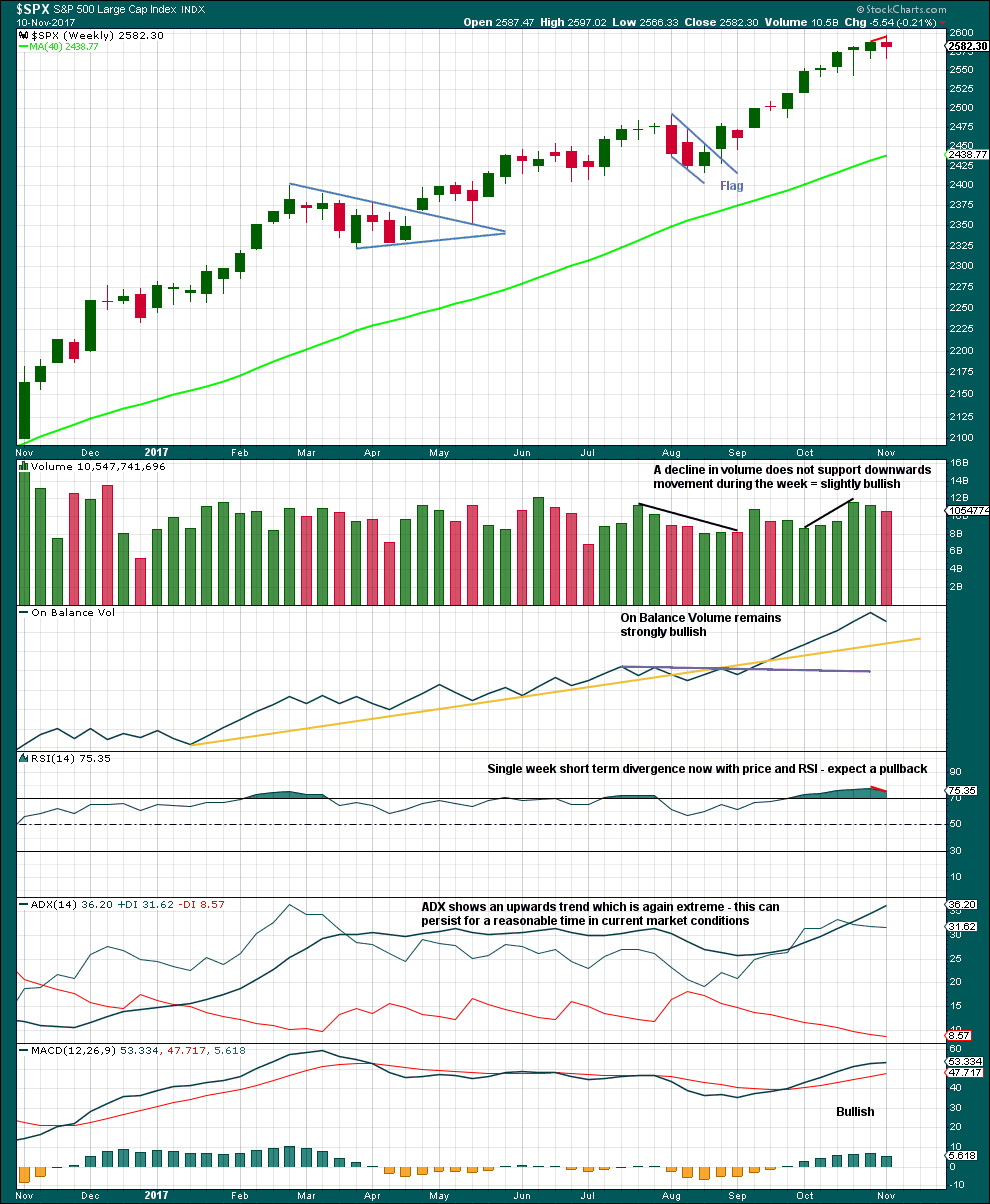
Last week moves price higher with a higher high and a higher low, but the candlestick closed red and the balance of volume was down. Volume did not support downwards movement during the week; this is slightly bullish, but it would be better to look inside the week at daily volume to make a clearer judgement.
With ADX now extreme and RSI exhibiting divergence while overbought, some pullback to resolve this seems a reasonable expectation.
The overall trend does remain up though, so pullbacks are still an opportunity to join the trend.
DAILY CHART
Click chart to enlarge. Chart courtesy of StockCharts.com.
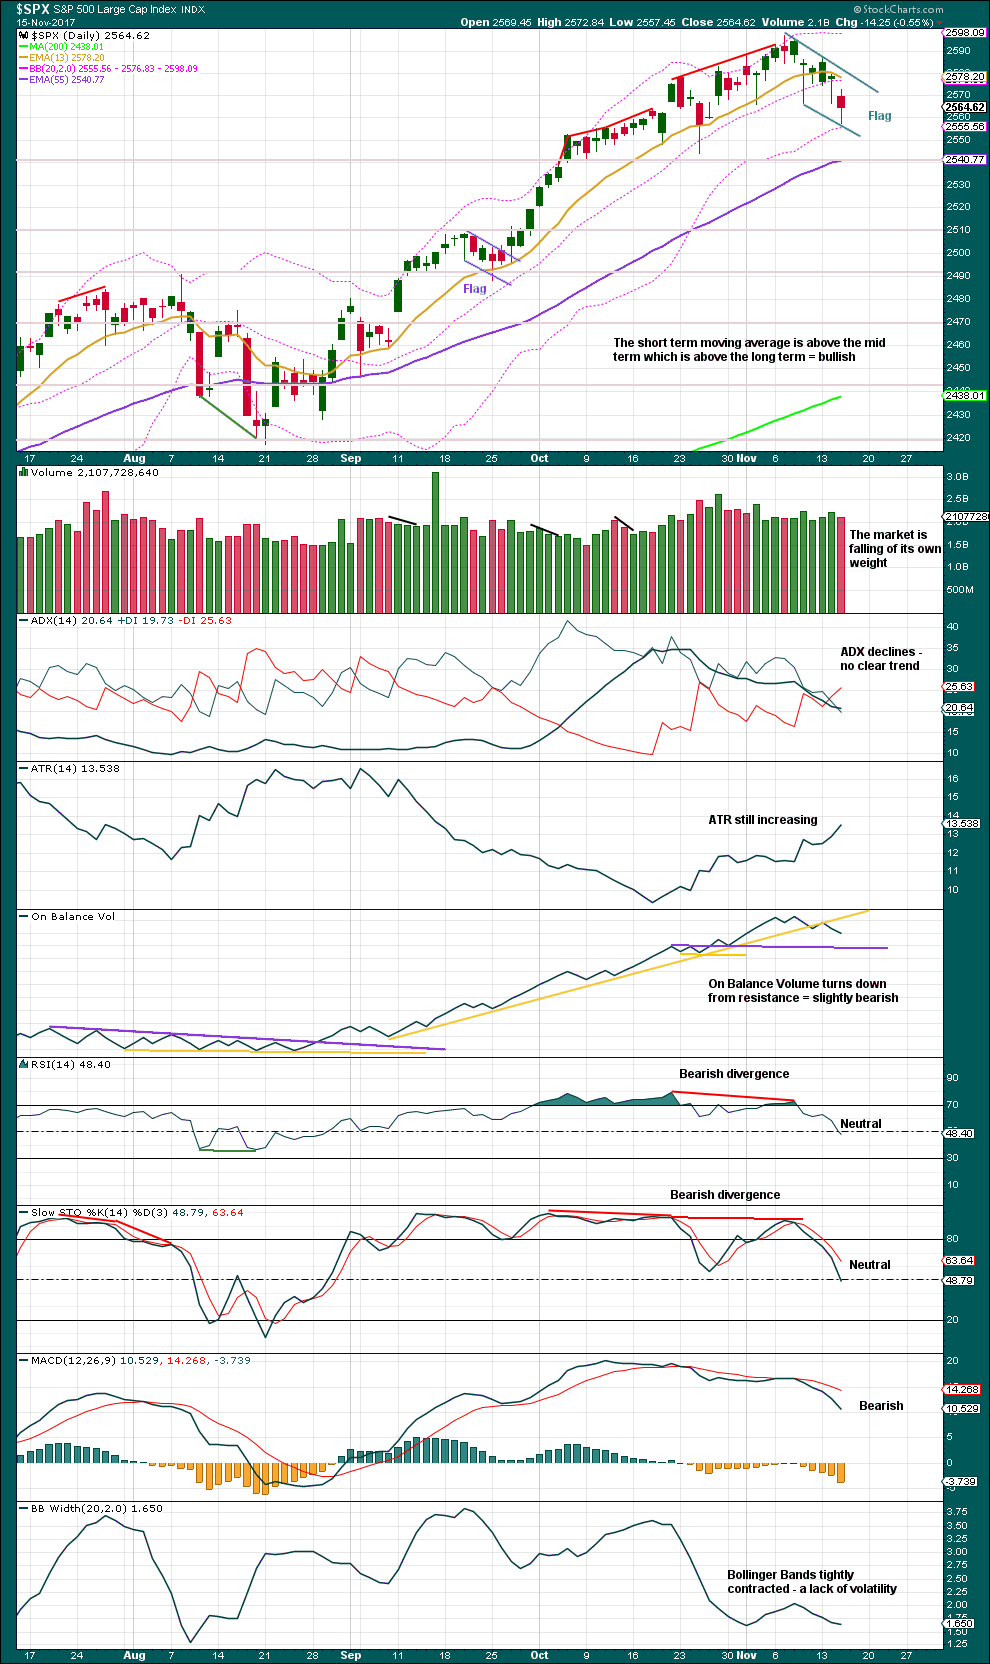
It now looks like a small flag pattern may again be completing. These are reliable continuation patterns. If the beginning of the flag pole is taken as the low for the 25th of October (which looks about right), then a target using the measured rule is about 2,630, if the breakout comes about 2,577.
An upwards breakout should have support from volume for confidence.
There is a series now of four candlesticks in recent days with long lower wicks. Together, this looks bullish. It looks like current downwards movement is a pullback or consolidation within the ongoing upwards trend at this stage. That should be used as an opportunity to join the upwards trend.
This consolidation has been long enough now to pull ADX down from extreme overbought.
There is room here for price to fall; On Balance Volume is not yet at support, and RSI and Stochastics are not yet oversold.
VOLATILITY – INVERTED VIX CHART
Click chart to enlarge. Chart courtesy of StockCharts.com.
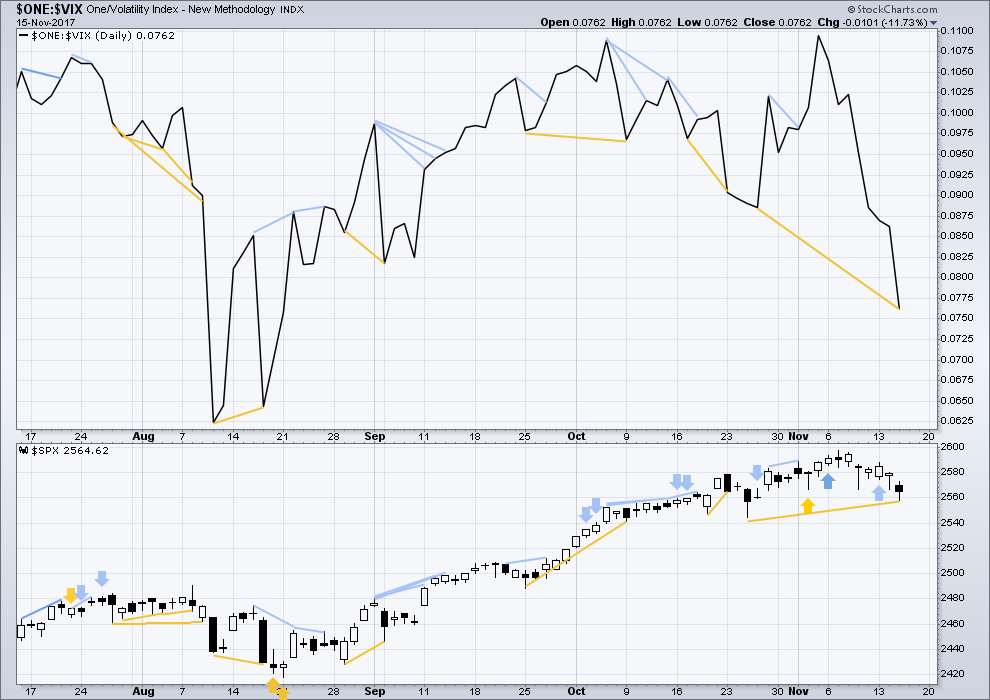
Normally, volatility should decline as price moves higher and increase as price moves lower. This means that normally inverted VIX should move in the same direction as price.
Bearish divergence noted has now been followed by another downwards day. This divergence may now be resolved.
There is mid term divergence between price and inverted VIX: inverted VIX has made a lower low, but price has failed to make a corresponding new low. The conventional interpretation of this is bullish and may indicate weakness within price.
However, mid and longer term divergence between price and inverted VIX is not usually very reliable. It will not be given much weight in this analysis.
BREADTH – AD LINE
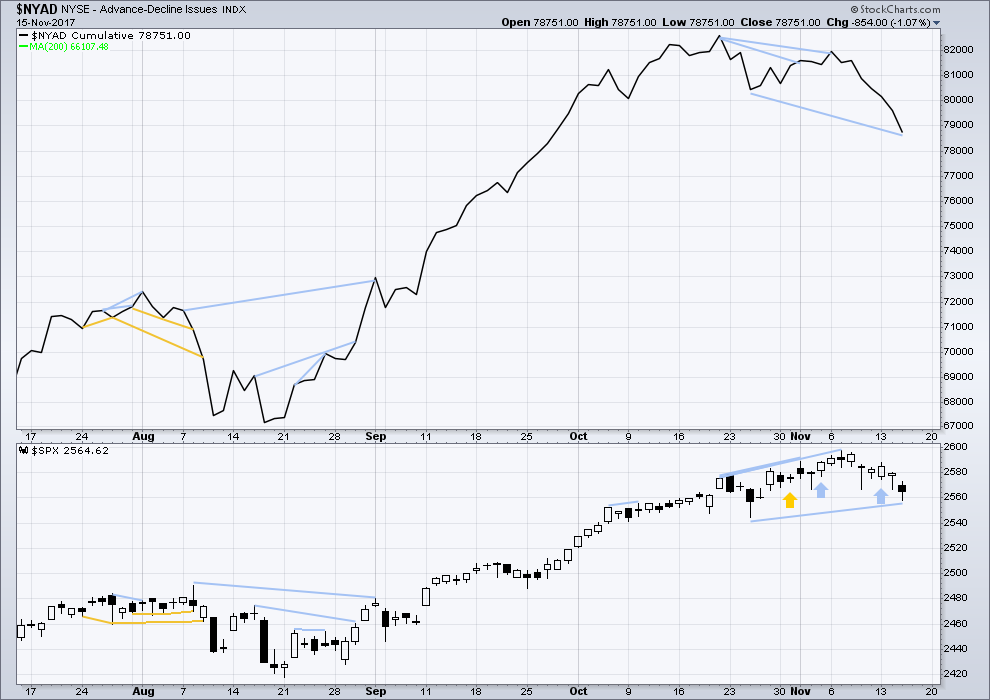
Click chart to enlarge. Chart courtesy of StockCharts.com.
There is normally 4-6 months divergence between price and market breadth prior to a full fledged bear market. This has been so for all major bear markets within the last 90 odd years. With no longer term divergence yet at this point, any decline in price should be expected to be a pullback within an ongoing bull market and not necessarily the start of a bear market.
Small caps have moved strongly lower last week and mid caps have moved somewhat lower. This market continues to show some short term weakness in support of the new main hourly Elliott wave count.
The AD line is bearish. It is making new lows while price is not. As the AD line may be a leading indicator, this divergence is interpreted as bearish. It is quite strong today, so it is given reasonable weight in this analysis. This offers reasonable support to the main Elliott wave count.
DOW THEORY
At the end of last week, DJT has still failed to make a new all time high. The S&P500, DJIA and Nasdaq have made new all time highs. DJT has failed so far to confirm an ongoing bull market.
Failure to confirm an ongoing bull market should absolutely not be read as the end of a bull market. For that, Dow Theory would have to confirm new lows.
The following lows need to be exceeded for Dow Theory to confirm the end of the bull market and a change to a bear market:
DJIA: 17,883.56.
DJT: 7,029.41.
S&P500: 2,083.79.
Nasdaq: 5,034.41.
Charts showing each prior major swing low used for Dow Theory are here.
Published @ 10:50 p.m. EST.
You were right on Kevin. A double ZZ is complete, now onwards and upwards!
If this count is right then today is still a reasonable entry point for a longer term buy and hold. While minute i is incomplete and minute ii may well be a reasonable correction, it may not be.
If you are prepared to hold an underwater position for a few days now could still be a good entry point. Keep some power dry though for a pullback, for minute ii. It will arrive, but it may not be very deep. Look back to the rise which began after intermediate (2) ended. The start of intermediate (3) on 4th November didn’t have any deep corrections.
I will have an alternate. Always should have an alternate. (I say should, but as you know by now I don’t always do what I should do…. )
My go to alternate is always to move the degree of labelling down one degree. The double ZZ may only be minute wave a within a flat or triangle for minor 4.
I will let volume, On Balance Volume and the AD line guide me today as to which idea is more likely. Could minor 4 be over already?
At this stage with recent price behaviour I’m leaning towards the view that minor 4 is indeed over and done.
That long lower wick on VIX sure looks a bit suspicious. I would have expected to see a full red candle at a minor degree turn but vol has been acting strangely of late so perhaps it is of little consequence…..still looking for move back below 200 day sma…
I simply ran out of time yesterday to do your extra analysis. By popular demand here it’ll be on the RUT index.
I have noted requests for EURUSD, Natural Gas, DJI and XIV or FXE. Probably won’t do the last two as equities just don’t have the huge volume necessary for reasonable EW analysis.
So I’ll start with RUT then do EURUSD, DJI and finally maybe Natural Gas.
Coming soon to a site near you….
Awesome TY!!!
🙂 Most welcome Kevin. Very happy to do extra as I know many members do appreciate it.
SPX likely to drop now to 38% retrace of move from late yesterday to today’s high at about 2580, where there’s also a ton of supported from Nov 14. Or maybe it gets to the top of the Nov 14 opening gap at 2583 and turns back up there. If it goes for 62% it’s down to 2574 and we are all wondering again if it’s still minor 4 vs a pullback of minor 5. I’m guessing more shallow this time though. I want some XIV again at a relative low…
Agreed. Nice drop, hopefully, then enter long…
Selling my 258.50 SPY calls expiring next week and buying same strike calls expiring tomorrow….cheaper insurance, bigger pop if move up persists…
Tax Reform and Jobs Bill
Has just PASSED in congress….
Reps: 227 Yea 13 Nay
Dems: 0 Yea 192 Nay
Total: 227 to 205
Now on to the Senate
DOW up a whole big 8 points since passage! Yea that’s what you call priced in!
I posted this this morning (7:00AM ish) with one link to story… But it ended up in awaiting moderation. Have no idea why.
A Leonardo Da Vinci painting sold late yesterday for $450.3 Million!
Yes that’s typed right… $450.3 Million! WOW! The most ever paid for anything.
If that doesn’t tell us we are at or near a major top, I don’t know what does.
EWI has always in the past said things like this are evidence of a Top!
Agree, how long before another one goes for $1.0 Billion…unreal
I got one better. A modern piece called “ketchup on canvass” just sold for 50 million!
I had to look that one up…good call! LMFAO!!!!! You couldn’t pay me $100 to put that up in my house for a year!!! $48M. Oh my.
Can you believe it??!!
I am not sure why but a previous comment I made is “awaiting moderation”. So I will post it again while it may still be relevant.
Does this EW count work? Any thoughts?
Rodney,
I thought I read in Lara’s update that there is the possibility of S&P hitting 2592-2593 before heading down yet again and very quickly.
You are right. She wrote that yesterday in the update during trading hours. But she did not include that in the daily analysis last night. I am guessing because she thought it was a lower probability.
My only concern has been the lack of any meaningful pullback in the markets so far. All that means is longer this straight ramp keeps going the worse the pullback will be for most investors as they are pretty much all (99% atleast) buy the drop mindset. If there is no pullback over the next week or so, expect an ATH before Dec. 15ish and then time to lock the profits as selling will start into the year end and new year JMHO..
Could be!! A push here past the Nov 13 high though would pretty much seal the 4 wave done deal for me. It’s hanging in the balance…
Boom…main invalidated. Minor 5 time. But another 2 is likely before more 3 up?
Yep! Back to tag wedge underside… 🙂
Does this chart work? Any thoughts?
VIX needs to stay BELOW 13 today to confirm the new impulse up. If it does not we have at least one more low ahead…
I like the action a lot and am getting rather long. If the tax bill crashes and burns now…well, I hope I “see in coming” in time for graceful landings, lol!!! ps: did I mention B? Looking good. As are many issues I suppose.
I am holding SPY 258.50 hedging calls that are showing a nice pop. Not quite ready to add. I want to see how VIX reacts to 200 day MA before I take the plunge….which will be in the form of bearish call credit spreads on UVXY. I want as many back door long calls as I can accumulate…. 🙂
I have a high so far as 2578.69 exceeding the limit for the ending diagonal. Those of you who have a live feed, what is the high for the day you are showing?
2578.17
Thanks Joe. Boy, we are right up against the limit and it looks like it will be taken out.
and rising moment by moment…
I am looking at a possible expanding diagonal that could still be in play, having completed yesterday, or putting in the b wave of a fifth today. Watching VIX closely for some clues…
I have about 2582 where the big channel line across the Nov 8 and 13 highs intersects today’s rising price. I’m very much expecting a turn there today…but we’ll see.
BOOM!!!!! Outside the channel. Goodbye minor 4!!! Perfectly synched with strong signals DC is going to implement the tax theft plan. It’s BULL PARTY TIME folks. Minor 5 be here, I do believe. Price has already done a 1-2 and is in either another 1 (likely) or a 3.
It’s sell on that news as The Tax and Jobs Bill is priced into Stock Prices on the move up from election day 2016.
Not done unless the Senate passes it… then it goes to conference where both chambers have to agree and work out the differences in both bills.
Do you all remember what sell on the news means? That hasn’t happened in a few years.
Over two days the DOW is up only 41 points as of right now. Big deal.
I believe you are correct. That said, the “news” isn’t here yet, it’s going to be weeks until the completion of the theft. And assuming they are successful, that may end up being the close of this minor 5 wave, and it’s sell into the intermediate 4 time!! So everything is lining up. But for right now right here, it’s bull time.
My current working EW model…
I suspicious that this “impulse” up is now going to crumble back into sideway muck, continuing the minor 4 instead of clearly establishing the start of a minor 5. It’s started promising, but “more of the same” (big whippy sideways movement) is always the most likely. It’s decision time for the market: up in a wave 5, or sideways in more wave 4? I’m tightening stops….
Looking for VIX to tag MA at around 11.14 before reloading short term long vol trade…if it breaks below we could be in new wave higher…we do have what looks like an island reversal…
I pulled the trigger pre market at 16.57
With VIX at 12.34 down .79
Yep typical!!!!
I think the key is the VIX 200 day SMA at around 11.15. How it reacts there will be a good confirmation or rejection of the new uptrend. The short term gyrations are unimportant. Whether or not a new larger vol uptrend has been started will be the key to getting the short term vol trade right.
Well the Low was 11.38 this morning… A turn may be in progress. It doesn’t have to touch.
Agreed. But a touch and bounce is nice to see. It confirms smart money is accumulating, but you are correct; they may not wait for that deep a move down…
Take a look at the 1 hour on the VIX they could be using the 100dayMA on this chart. 11.26
Plus the 100day crossed over the 200day on Tuesday.
The army in Zimbabwe finally decided to rid the country of the scourge that single handedly transformed one of the most lush and productive nations in the world to a basket case of hyper-inflation and overall economic blight. What took ’em so long??!
Mugabe is “on the board” for consideration as one of the worst despots in history. I have no idea if anything will get better in Zimbabwe, let’s hope so. Sadly, as we all know, things can always get much, much worse.
Oh yes! It was the prospect of his wife, Grace, taking over that prompted the military to take decisive steps…
Curioser and curioser! Supposedly the market run-up was in anticipation of widespread tax cuts that would boost the economy, but when you look at what is actually being proposed, you can only conclude that the clueless, corrupt politicians in Washington are hell-bent on sabotaging it. The only winners are big corporations, period. There is no relief for middle class tax payers and small businesses, and they in fact are going to see net substantial tax INCREASES. Does anyone truly believe this is a formula for boosting the economy? Have these morons in Congress forgotten that 70% of all new jobs is actually created by small businesses? Even if this thing passes it is going to be an unmitigated disaster for average taxpayers. Folk buying in anticipation of it being good for the economy are completely out of their minds…!
What should alarm everyone is that there is not a whisper of cutting bloated government and wasteful spending from these kleptocrats, not a whisper! The whole thing is nothing but a subterfuge for them to continue,and even ramp up sticking it to the little guy…what a cesspool!
🙁
Oh, the cutting will come soon, after passage, it goes like this…”okay, now we have MASSIVE deficits coming, we have to CUT SPENDING!!!! Okay, every single social program for the poor, women, minorities, and all funding for arts, and science, and public education, and infrastructure, and and and and and….HAVE TO GO!!! But hell yes we are adding $55B to the military budget, the most bloated and unnecessary in the world!!!”. Oh yes, the “conservatives” (steal from everyone and give to the rich only) are winning….
You need bigger fears, Kevin. As long as these frauds are talking about any tax relief being “paid for,” no Federal program will be cut. None. Ever.
Hmmm. I’ll keep that in mind as I watch what happens with budgets in congress coming up. Somehow…I am more than doubtful of that. Part of the reason for running up deficits like this is to “force” the termination of social programs. It’s all part of the Koch brothers master plan. It won’t be long before there weill be movement for a constititional convention too, to really “free the corporates” from governmental (the people’s) control. Also part of the Koch’s plan. Well, despite my fears, there is only one thing, the only thing, to live to see from huts and on journeys: the great day that dawns, and the light that fills the world!! (so sayeth the Inuit). Cash to pay for journey’s helps…back to work!
The fascinating part of this is the vice grip the Republican congressmen (most are white men) are in. Even if they KNOW this is a horrible deal for the USA in the longer term…they “HAVE TO” vote for it, for the simple reason that they are in power because of corporate and hyper-rich financial support, and if they vote NO…that goes to zero, and they are out of office in 1-5 years. For sure!! The US system is totally corrupted by “corporations are people” and “money is speech” rulings by the corrupt supreme court. Democracy, dead as doornail. Witness: the party in total power is backed by what, 23% of the US population? (Voting republicans as a % of voting age people.) Oh well…only option is to jiu-jitsu it all and make some money in the market they are stimulating beyond all ken!!
I don’t know about that… The middle class, the forgotten men and women voted heavily for President Trump and congressmen and senators were all swept up in that. In fact he had more black and Hispanic votes than any other republican in many years.
President Trump had no big money donors… he ran the cheapest Presidential campaign ever! President Trump won 306 electoral votes!
All the geniuses said a Republican can never win another Presidency and had No possible way to 270 electoral votes. Remember???
The Debt and Deficit problem will be solved over time with a Business Style Complete Government Restructuring of every agency and that is before entitlements are touched. Plus Economic Growth well over 3%!
I have one word for you sir! Kleptocracy.
Oh I guess I have one more: recession (in…oh, 2024, about the time the grand supercycle terminates).
Until then, trade on!!
Yes… Let the Long, Long… Long Delayed Market Cleansing begin immediately!
The re-introduction of Price Discovery will now be back!
DOW up a whole big 8 points since passage! Yea that’s what you call priced in!
Pricing in has gone on for 12 months, all markets appropriately. Pricing in finishes on passage. Then it’ll be intermediate 4 (“sell the news”) time. My $0.02, worth less.
A Leonardo Da Vinci painting sold late yesterday for $450.3 Million!
Yes that’s typed right… $450.3 Million! WOW! The most ever paid for anything.
If that doesn’t tell us we are at or near a top, I don’t know what does.
Story: Salvator Mundi or “Saviour of the World”, which depicts Jesus Christ.
Lost for years only to resurface at a regional auction in 2005, it is one of fewer than 20 da Vinci paintings generally accepted as being from the Renaissance master’s own hand, according to Christie’s.
Full Story with pictures: http://www.thejournal.ie/da-vinci-painting-sold-3699555-Nov2017/
Looks like the script is changed from last few days so we might have a positive open and then let the market lead the way..I like Lara new projected target 2773…lot of room to run for markets …
First? Really!!??
two Rons in a row