
A consolidation or pullback was expected to continue. Price has moved lower today and remains within the consolidation zone.
Summary: The target for a multi day pullback is now about 2,539. Today, this is supported by bearish divergence with price and the AD line, price and inverted VIX, and On Balance Volume at resistance.
Pullbacks and consolidations at their conclusions offer opportunities to join the upwards trend.
Always trade with stops and invest only 1-5% of equity on any one trade.
Last monthly and weekly charts are here. Last historic analysis video is here.
MAIN ELLIOTT WAVE COUNT
WEEKLY CHART
Click chart to enlarge.
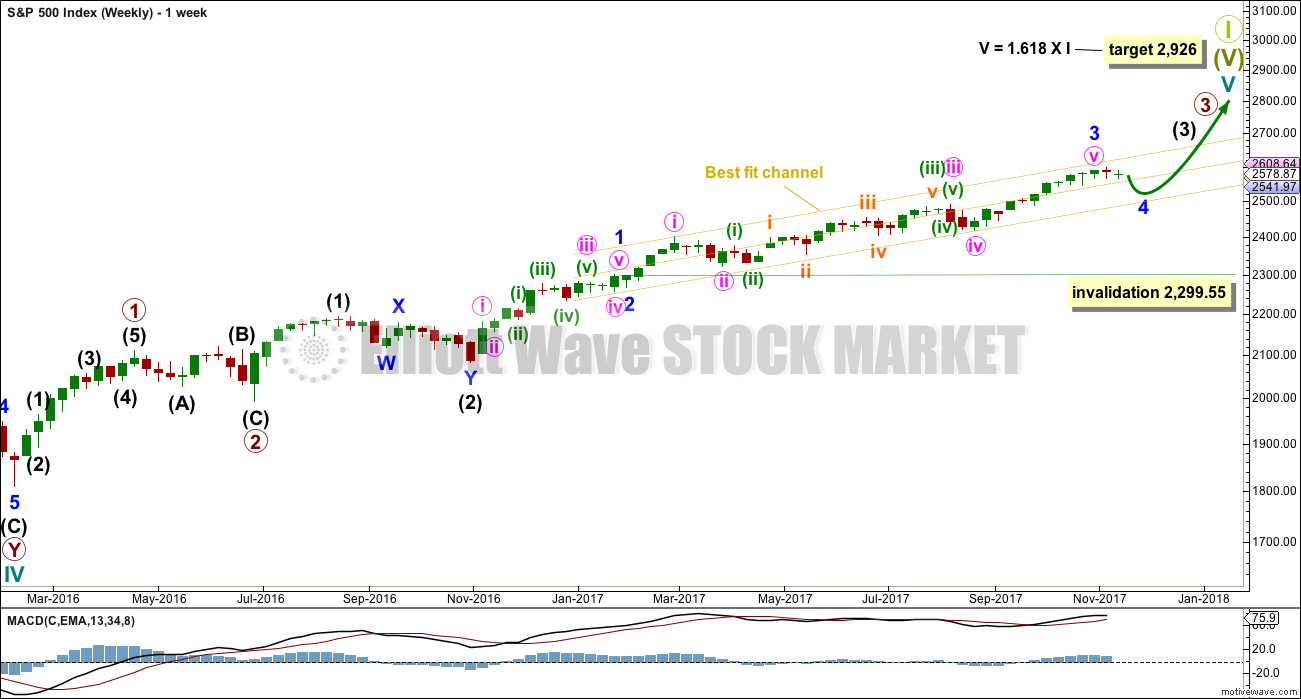
Cycle wave V must complete as a five structure, which should look clear at the weekly chart level. It may only be an impulse or ending diagonal. At this stage, it is clear it is an impulse.
Within cycle wave V, the corrections for primary wave 2 and intermediate wave (2) both show up clearly, both lasting several weeks. The respective corrections for intermediate wave (4) and primary wave 4 should also last several weeks for the wave count to have the right look at the weekly and monthly time frames, so that they show up at weekly and monthly time frames.
Cycle wave V has passed equality in length with cycle wave I, which would be the most common Fibonacci ratio for it to have exhibited. The next most common Fibonacci ratio would be 1.618 the length of cycle wave I.
Intermediate wave (3) looks incomplete. It may only subdivide as an impulse. Within intermediate wave (3), minor wave 4 is currently unfolding and may not move into minor wave 1 price territory below 2,299.55. However, minor wave 4 should remain contained within the yellow best fit channel if this wave count is correct.
DAILY CHART
Click chart to enlarge.
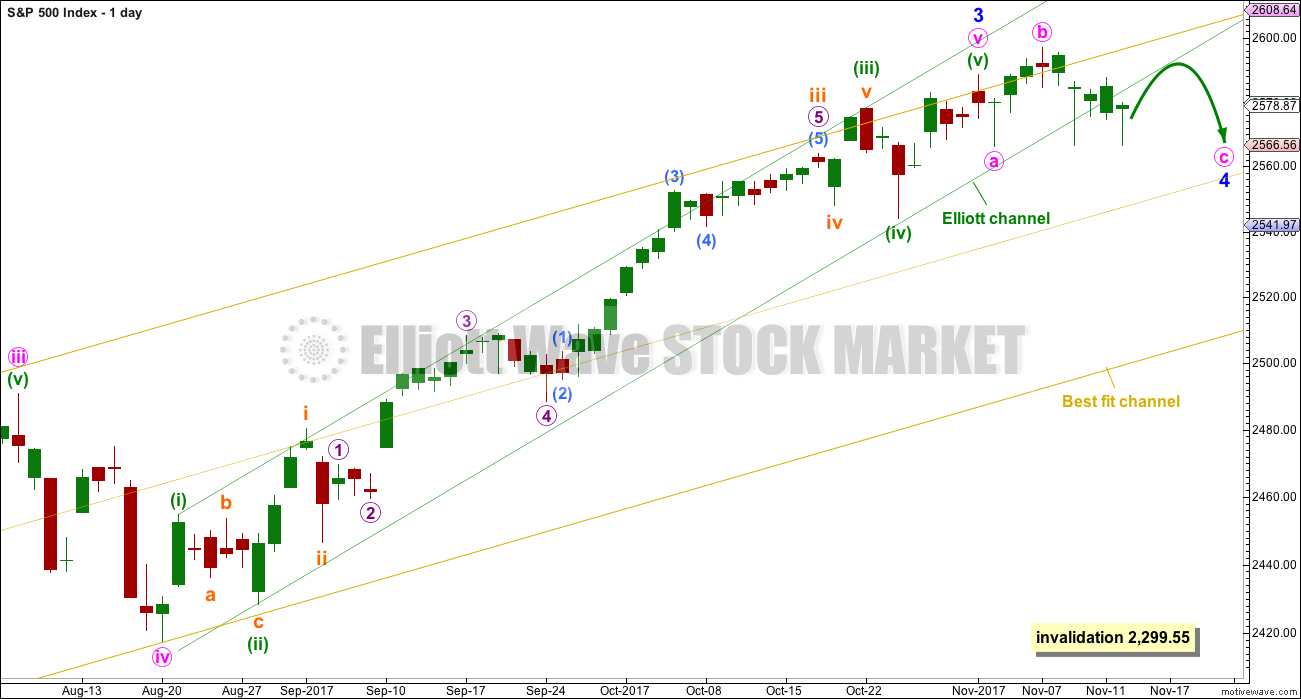
Price has today properly broken out of a channel which contains minute wave v (green channel). A full daily candlestick is now outside and not touching the channel; this constitutes a breach, and is an indication that minute wave v should be over. If the wave count is right at higher degrees, then that means that minor wave 3 should be over.
Minor wave 4 is so far a very shallow and overlapping sideways movement. When it is complete, the breakout is expected to be upwards. Minor wave 4 may end when price finds support about the mid line of the yellow best fit channel.
Minor wave 4 may be any one of multiple corrective structures. The only structures which may be reasonably eliminated today are those in the zigzag family (single and multiple zigzags) if the start of minor wave 4 is correctly labelled.
Minor wave 4 may still be any one of a different type of flat, triangle or combination. At this stage, a triangle does not have a good fit, so a flat and combination are considered in two hourly wave counts below.
At its end, minor wave 4 should offer a good entry point to join the upwards trend.
To label minor wave 4 as complete at the last low would be to see it as a rare running flat. The rarity of this structure means it is highly unlikely.
HOURLY CHART
Click chart to enlarge.
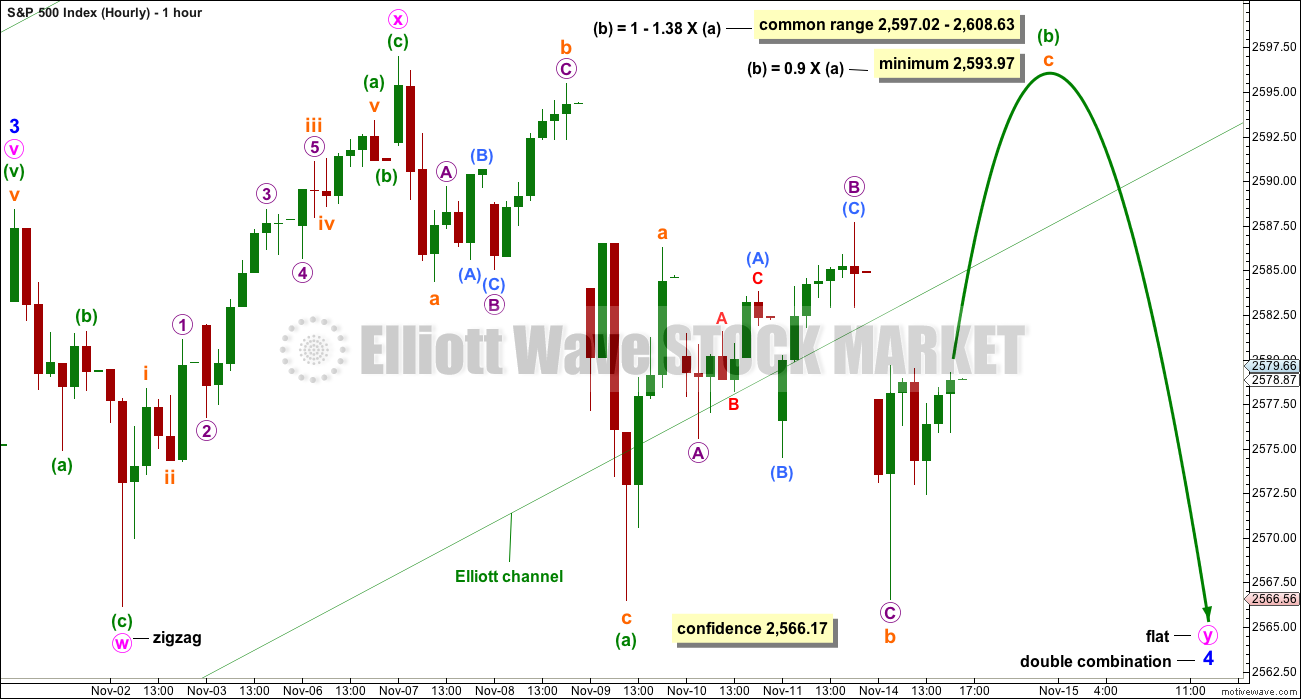
Minor wave 4 may be a combination. The first structure in the double combination may be a completed zigzag labelled minute wave w. The double may be joined by a complete three in the opposite direction labelled minute wave x.
Minute wave y may be a flat or triangle. It may not be a zigzag, because then minor wave 4 would not be a double combination but a double zigzag. Double zigzags are very different structures to combinations; they should have a strong slope against the prior trend and their X waves should not make new price extremes.
Within minute wave y, if it is a flat correction, minuette waves (a) and (b) should both be three wave structures. Minuette wave (b) must retrace a minimum 0.9 length of minuette wave (a).
When the length of minuette wave (b) is known, then a target may be calculated for minuette wave (c). It would be expected to be reasonably close to the end of minute wave w at 2,566.17, so that minute wave y ends about the same point. Double combinations are sideways movements and to achieve a sideways look the second structure in the double normally ends close to the same level as the first.
ALTERNATE HOURLY CHART
Click chart to enlarge.
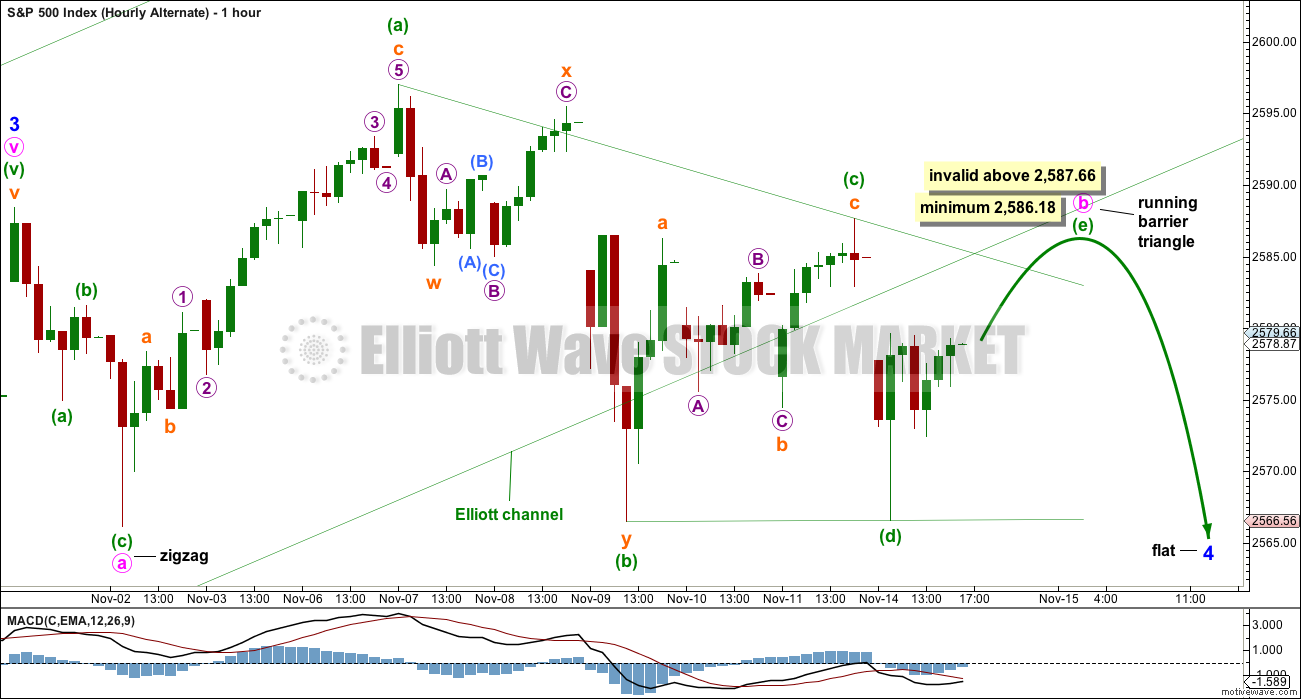
This wave count does not have such a good look as the first, but all possibilities that I can see are considered today.
Minor wave 4 may be a flat correction and minute wave b within it may be a triangle. Minute wave b at its end must effect a 0.9 retracement of minute wave a, so it needs to end at the minimum requirement or above.
If the triangle is correctly labelled, then only minuette wave (e) may be required to complete it. It may overshoot the (a)-(c) trend line. Minuette wave (e) may not move beyond the end of minuette wave (c) above 2,587.66.
TECHNICAL ANALYSIS
WEEKLY CHART
Click chart to enlarge. Chart courtesy of StockCharts.com.
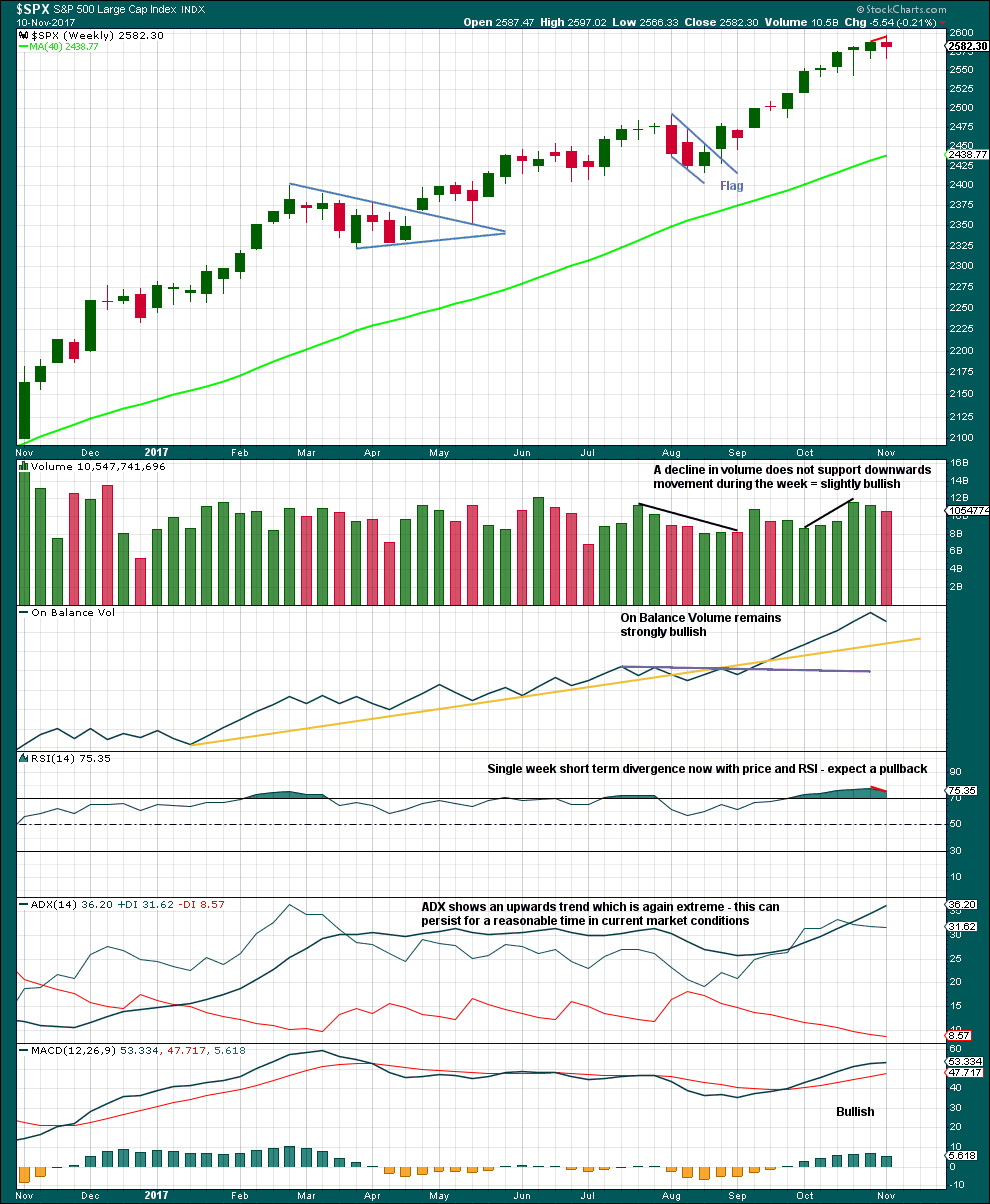
Last week moves price higher with a higher high and a higher low, but the candlestick closed red and the balance of volume was down. Volume did not support downwards movement during the week; this is slightly bullish, but it would be better to look inside the week at daily volume to make a clearer judgement.
With ADX now extreme and RSI exhibiting divergence while overbought, some pullback to resolve this seems a reasonable expectation.
The overall trend does remain up though, so pullbacks are still an opportunity to join the trend.
DAILY CHART
Click chart to enlarge. Chart courtesy of StockCharts.com.
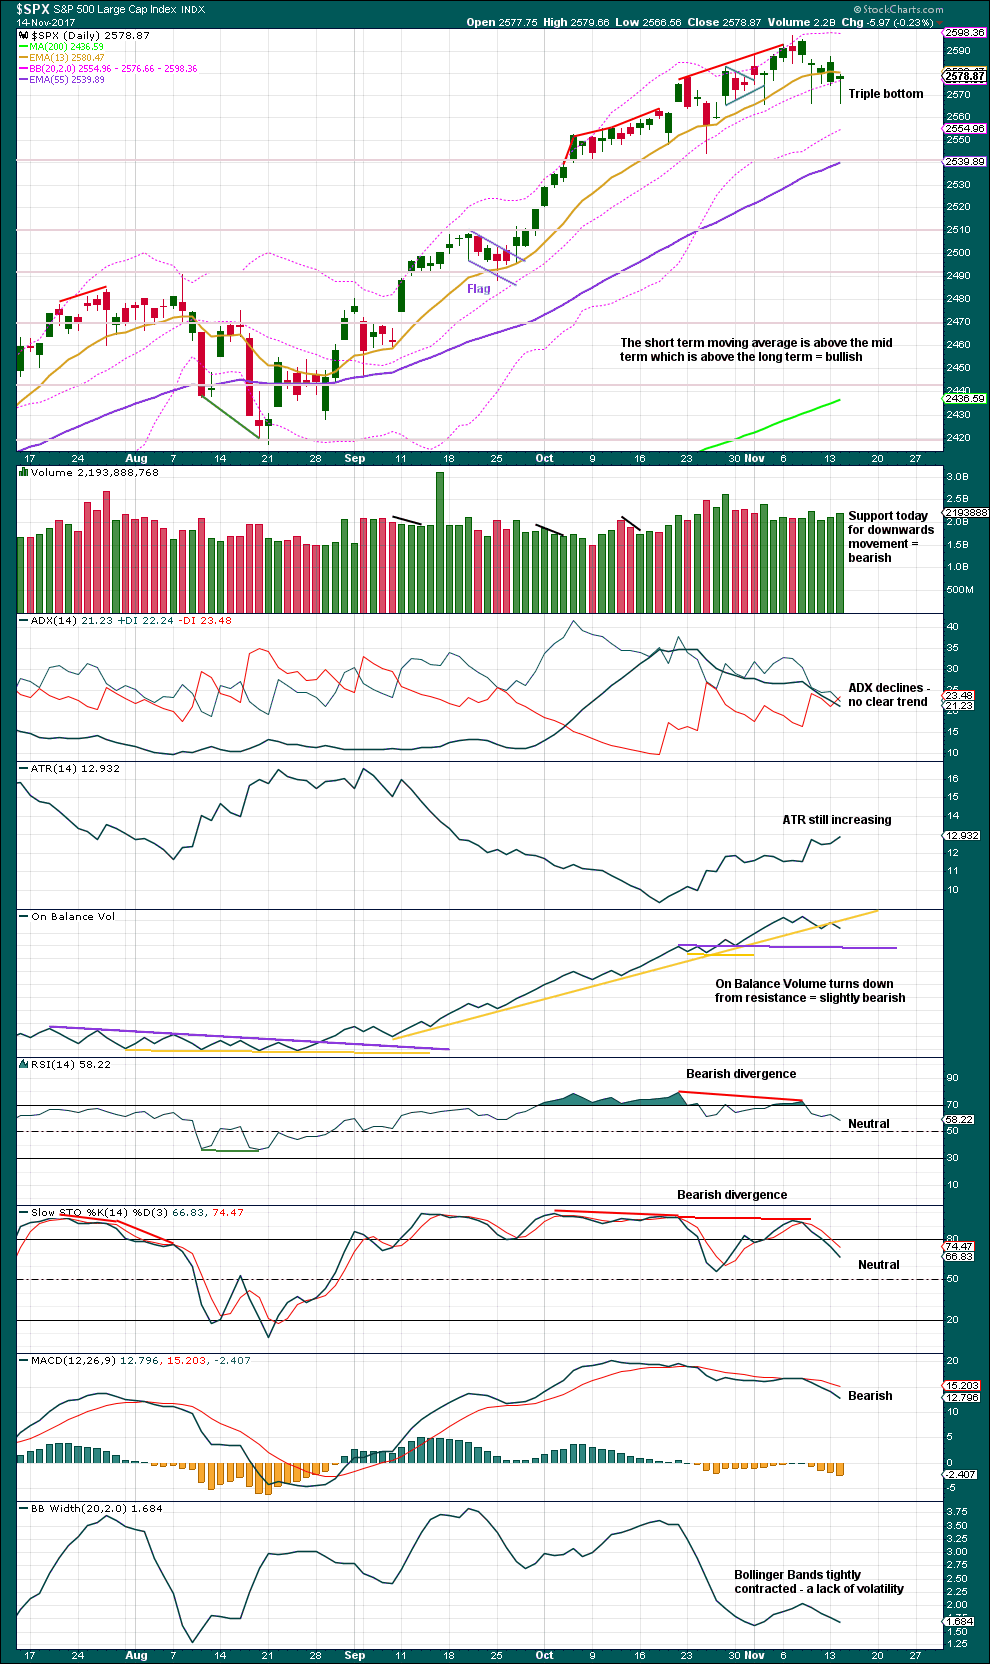
A triple bottom is a rare pattern and failure rates are very low. The breakout should be upwards. The second peak here is slightly higher than the first; this is favourable.
The current consolidation has been sufficient to bring ADX well down from extreme. There is now again room for a more sustained trend to develop.
An upwards breakout would be the classic bullish signal. It should have support from volume for confidence.
VOLATILITY – INVERTED VIX CHART
Click chart to enlarge. Chart courtesy of StockCharts.com.
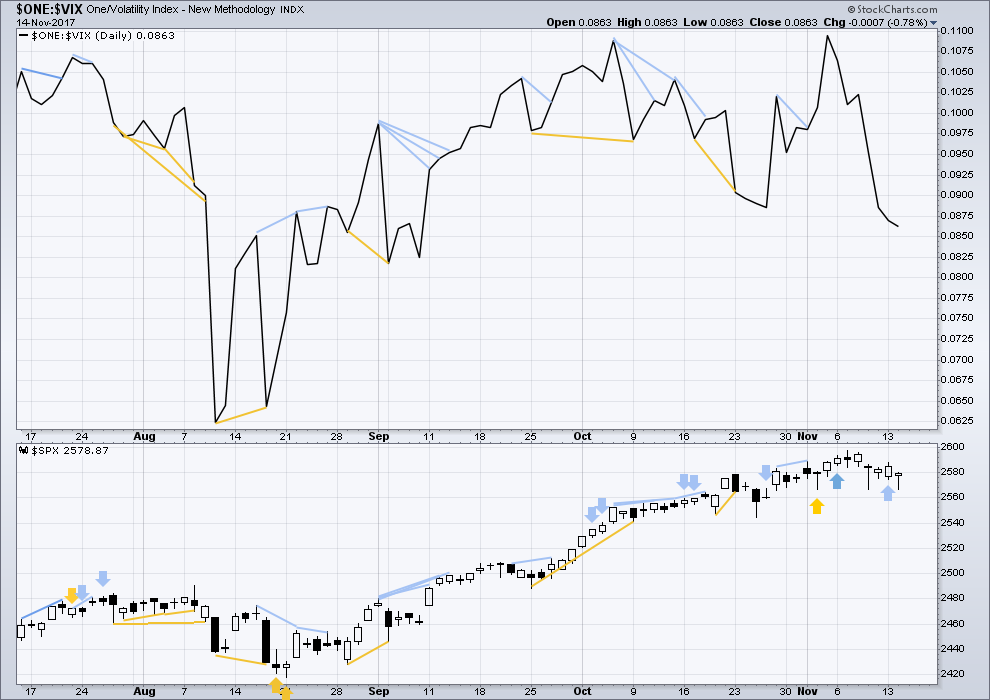
Normally, volatility should decline as price moves higher and increase as price moves lower. This means that normally inverted VIX should move in the same direction as price.
Bearish divergence noted in last analysis has now been followed by a downwards day. This divergence may now be resolved, or it may need another downwards day to resolve it.
There is no new divergence today between price and inverted VIX.
BREADTH – AD LINE
Click chart to enlarge. Chart courtesy of StockCharts.com.
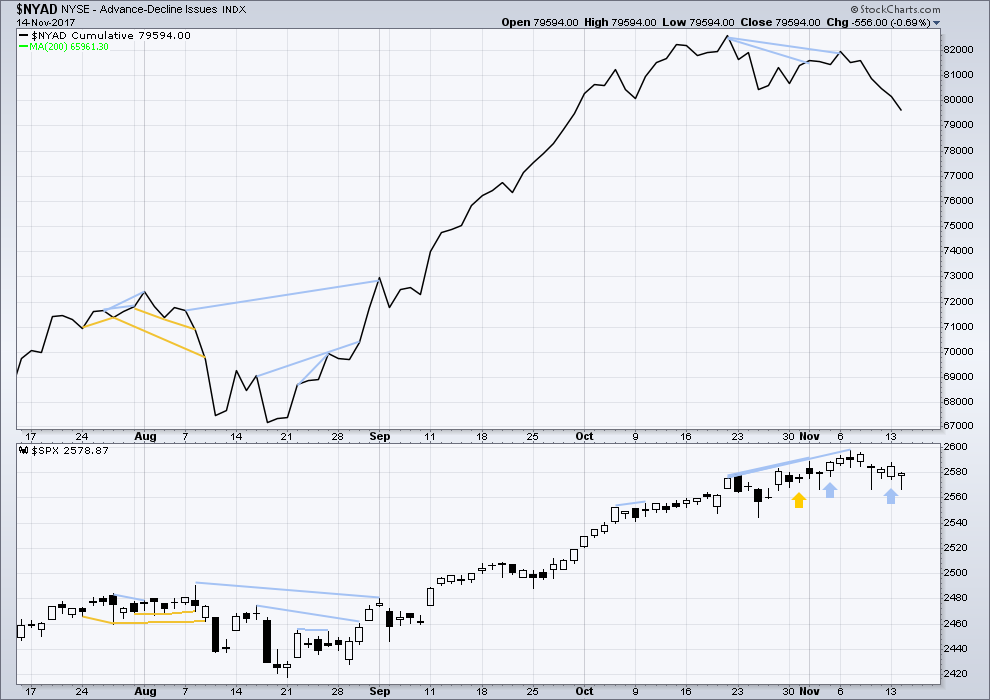
There is normally 4-6 months divergence between price and market breadth prior to a full fledged bear market. This has been so for all major bear markets within the last 90 odd years. With no longer term divergence yet at this point, any decline in price should be expected to be a pullback within an ongoing bull market and not necessarily the start of a bear market.
Small caps have moved strongly lower last week and mid caps have moved somewhat lower. This market continues to show some short term weakness in support of the new main hourly Elliott wave count.
Bearish divergence noted in last analysis has now been followed by a downwards day. This divergence may now be resolved, or it may need another downwards day to resolve it.
The AD line is bearish. It is making new lows while price is not. As the AD line may be a leading indicator, this divergence is interpreted as bearish.
DOW THEORY
At the end of last week, DJT has still failed to make a new all time high. The S&P500, DJIA and Nasdaq have made new all time highs. DJT has failed so far to confirm an ongoing bull market.
Failure to confirm an ongoing bull market should absolutely not be read as the end of a bull market. For that, Dow Theory would have to confirm new lows.
The following lows need to be exceeded for Dow Theory to confirm the end of the bull market and a change to a bear market:
DJIA: 17,883.56.
DJT: 7,029.41.
S&P500: 2,083.79.
Nasdaq: 5,034.41.
Charts showing each prior major swing low used for Dow Theory are here.
Published @ 08:55 p.m. EST.
We should know tomorrow if we are seeing a “managed decline” unfolding. This would be a most intriguing way to stealthily usher in a new down-trend. I am really curious about how many of these would have to happen before everybody started to notice…! 🙂
Another possible target if blue shelf broken…
Here is what I think we need to look out for overnight. That blue line on the “gap map” is where I think price needs to bounce tomorrow to stave off a market rout.
Isn’t this how it all Turned at the start of the big uptrend?
Many open unfilled GAPs down there.
It’s fitting if that’s how the Top plays out.
Hey everybody, I’ve just asked the question over at EWG so I’ll include you all and ask here too.
I need to do something today to provide a public analysis over at EWG for SEO. I’m thinking a full EW and classic TA of a market I don’t normally provide for you all.
Anyone for a currency? Another index?
Let me know which market you’d like me to do. If it’s one I don’t have a current updated EW count on then I’ll video the thinking process I go through to develop an EW count. How to use Motive Wave… and how I use classic TA to judge probability.
Rut is my vote
$DJI
$RUT
Maybe going too far but with a 4-5% positive edge per month it’s overwhelmingly attractive…XIV?
Or FXE.
Well, looking like we will get an interim bottom overnight in ES and probably in the cash session in the a.m. Still looking for that downside target of around 2540.
Until tomorrow! 🙂
Love to see RUT!
When does the TAX selling typically expected. I am wondering given the ramp this year, how is market going to handle tax selling…GE comes to mind as folks offload losers to balance gains..thoughts?
New alternate today:
I agree with Kevin, it sure does look like a double zigzag has completed downwards.
For this idea we would need the classic bullish signal of an upwards breakout to a new ATH with support from volume.
Daily chart:
Hourly chart:
Now to put Fibonacci ratios back on the daily charts so we can compare the two different ways of seeing minor 3 and minute v within it.
Updated hourly chart:
Still possible. This requires a bounce higher, could make a new ATH, and then a sharp fall to follow.
Looking again at that VIX chart. It sure is starting to look a lot like the start of a parabolic rise people…just saying… 🙂
On the other hand knowing how sneaky the bankster are, if we see a plunge into the close I would probably cash out rather than hold over-night…
Would 17 to 17.30 be a good buy?
If in at that… what kind of POP is possible?
Looks like they are trying to smack it down at the moment!
That I think would depend on whether you are trading shares or option contracts. If shares a market buy with a stop at the top of this morning’s gap would be a reasonable approach I think, which would amount to just about a 0.75 point trailing stop to capture any move higher…
If this was my first entry I would actually sell the 16.50 put with the intention to take delivery of the shares provided I did not mind buying at least 100 shares.
At 0.35 cents that would lower cost basis to 16.15 per share.
Shares and thanks… waiting.
I am done with options. Never again!
Still waiting! 16.98 at the moment. up .57
VIX up .96
That’s Odd isn’t it?
This has been the pattern lately with volatility heading higher towards the close…a cautionary note for bulls…
Definitely not for everyone! 🙂
Had a chance to get in at 16.95 but I waited too long to pull the trigger. It closed at 17.67 … OH well!
Maybe SPX will bounce and VIX declines and I will get a 2nd chance.
Yep. Looks like just around 17.00 offering short term support. I wish you had got in as it is likely to bolt higher at the open tomorrow and spike during the session or maybe Friday. Remember this is definitely a short term trading instrument and until we get confirmation of the bear market should be scalped not not a long term hold. A trailing stop is highly recommended! 🙂
30 Year US Treasury Yield wend down Big today!
Now Yielding… 2.768% … Yield curve continues to Flatten!
They know something is coming!
As to UVXY… can be had in after hours in decent size. Bouncing between 17.45 to 17.55
I am not going to do anything… I don’t like to chase anything.
Assuming my “gap theory” is remotely plausible, we are gong to see, as Tim Knight would say. “Serious Droopage” overnight. I am going to make a SPECULATIVE trade on UVXY calls expiring in two days.
Buying the 17.50 strike calls for 0.62 apiece. Opened sell to close order for limit price of 2.00 even in anticipation of spike…if it plays out should be good for a few additional stocking stuffers! 🙂
Another service just came out with aggressive idea for shorting CUBES (QQQ) as they will likely see a quick drop compared to other areas given the rapid rise so far. S&P closes below 2,566 would mean some serious selling tomorrow and day after very likely.
B has turned at the 76% retrace with a beautiful HS bottom pattern, if anyone is looking for discounted long opportunities.
CTRP also, double bottom in place, etc…
And a HS bottom in GS. I don’t remember seeing so many of these things on the same day in a while, I wonder if that means something.
Apparently excellent timing on the VIX bull credit spread; they are already in the money…! 🙂
Are we seeing a pattern here or is it just me, I think I’ll call it the “Wedge a Gap” pattern… 🙂
Verne… what do you think is a good entry price on UVXY 1. on a pull back?
2. and/Or otherwise?
I would use VIX to plan an entry. If VIX bounces at the 11.14 200 dmsa pivot I would go ahead and buy it at the market. We could have seen a long term change of trend in this beast. In fact, I plan on taking delivery on the shares of the December call contracts I am holding if that turns out to be the case.
A day or two ago I thorised that the persistent buying of these gap downs would only result in the gaps down becoming more violent. Could that be what we are witnessing? If so, we are gonna get a doozy tomorrow to probably finish the correction…or more….!
This last drop in the stochastic wasn’t accompanied by a corresponding big drop in price… perhaps the pattern has changed?
VIX has bounced in the 12.50 area or just below. Is this now the new support floor going forward? Interesting….
Apparently I am not the only one bearish on AMZN. Guess who just unloaded ONE BILLION, you heard me, worth of stock? 🙂
Taking a bit more conservative approach to a VIX reversal trade. Selling to open the VIX November 22 (next Wed) 11/11.50 bull put credit spread for limit of 0.15 per contract. The expectation is that VIX should move a bit higher prior to a reversal allowing buy back of the short puts for a close to zero cost basis to get positioned. If VIX above 11.50 next Wed, which has now become support, keep the premium. If it breaks 11.50, buy back the 11.50 puts and hold the 11.00 strike puts for additional gains. A buy stop at 11.35, the break even level for the short puts limits downside risk. It is not a ten-bagger, but one can always ADD to the 11.00 strike puts with a reversal confirmed.
The defining technical of the market right now for me is this “big” down channel. Price is moving “down the channel” until it isn’t. An approach of the upper line would obviously present a big decision point. Up and through it and the minor 4 is over and maybe wxy is right. I doubt that line gets approached today though. I dub this minor 4 the TAX WAVE. The 5 out of it probably doesn’t start until there is certainty of a pass.
Some interesting “wedge symmetry” going on, I’ve speculatively put in the current wedge. If history repeats itself, in a few hours price will drop out of this one too. Or the 4 is over and it won’t.
I’m seeing that W-X-Y too Kevin. I’ll be publishing the idea as another alternate today.
And yes, the channel is the decision point.
SPX now 9 waves up from today’s low. That qualifies as an impulse, right?
Man I gotta tell ya…I am looking at UVXY B bands and that compression is as a friend of mine would say (wassup Olga?) “Hair-On-Fire” scary! Ain’t no way I am shorting that beast…No Siree!! Not today…THANK YOU…! 🙂
Anybody else think we have what looks like a very nicely formed left shoulder and head in DJI? That would imply a nice move up to finish the right shoulder in what could possibly be some sort of second wave…
Thanks for pointing that out, interesting set up in process.
I’ll mention again that Bulkowski measurements of success rates of stock patterns have little accuracy (or perhaps I should say, have extremely large confidence intervals) due to extraordinarily small sample sizes. Tens of thousands of samples minimum are needed to get somewhat accurate figures; he’s only got tens to hundreds per pattern.
VIX short trade with a target at the 200 dsma of 11.14 not a bad risk/reward set up. We did not really have a spike as this is just a very orderly drift down from the morning’s highs. It is a bit unusual…
I was tempted to sell calls against my hedging SPY calls this morning and am glad I didn’t. Sometimes it is hard to remember hedges are primarily intended to protect your position, NOT produce a profit. Hard not to get greedy though… 🙂
I just noticed there were TWO VIX gaps today. Only the second filled so far…first remains open…
We now do indeed have the tell-tale long upper wick above the B bands in VIX. Odds are an at least interim bottom is close.
Morning gap open now filled…
On one-minute chart, this bounce looks like it may have started with a 3, not a 5. Maybe new lows yet today? Not going long yet.
3-3-5 bounce possibly nearing completion?
looks like gap is likely to fill today. I’ll ring the register once it is and look to reenter long again on the inevitable small sell off there, perhaps.
Looking that way atm…
Here is thought. A few weeks ago I commented on the remarkable series of gap up opens we were seeing and pointed out series gaps tended to be seen at the start, and at the END of extended bull runs. It does make one wonder if the same is true for extended BEAR runs….
Since we have rebounded above 2566, in order for my possible count of a series of 1-2’s to work, we would need another 1-2. I think this is too man. Thus Kevin’s count of a w-x-y looks better and more likely. However, we may see one more low toward the target of 2539.
Gotta go. See ya!
JPM’s reversal signal is pretty strong. Seeing finance hardly blip down this morning then start reversing fast gave me confidence to buy the lows (XIV). Working out okay so far. I’m hoping this batch will last me deep into the new impulse up (has it started????).
This is the 3rd day of gap down and test. Is this one going to finally push up and through the opening gap? Or another failure?
A better reversal signal would be a second VIX close below its upper B band and a fat red candle…
I had got positioned for the upside possible ten bigger in the vol trade but bailed like a WUS due to bankster intimidation…I hate those guys!! 😀 😀
We are probably coming back to re-test broken neck-line…bottom of gap at around 2570 should be good for short scalp…
Here we go. Another torturous wedge grinding higher and perhaps we gap down to final target manana…
The massively short vol futures supporting the historic short vol trade not even remotely close to being unwound. Are these traders nuts??!!! 🙂
Does it require something far larger than a small minor 4 to do that?
Probably. Which is why I am curious if we could possibly be in a higher degree correction…
O.K. people. If we get a capitulation spike tomorrow VIX 13.50 strike puts expiring next week could see an 80% haircut. Opening “stink bid” to snag ’em for 0.50 GTC.
No guarantees, but if you get filled, it’s an easy 5-bagger! 🙂
Still holding mid term UVXY calls and waiting for downside target. Wow! These things can really explode when you get the thing right…
The SPX is now in the range of a wave IV of one lower degree, in this case Minuette IV of Minor 3. I suspect this should be our minimum target. The question is this; “Will 2544 provide support or will it be taken out?”
Also, if VIX, SPX, and $NYMO all end outside of their respective daily Bolinger Bands, we will be provided a signal to go long. I am looking for this over the next day or two. However, only the daily close counts. So we have to wait until the end of the day for the “Buy” signal.
We also need to look for the wave pattern to complete. In other words, a series of 4-5’s.
VIX above B band but no long upper wick yet…stand by…
I suspect the herd is complacently thinking: ” Same as it ever was…!”
Filled on SPY 260 strike puts at 4.00. Hard not to be greedy but you know what they say about pigs! 🙂
Selling VIX 10.50 calls for rare triple!! Look at the spread on those animals!!!! Yikes!!!!!
Perhaps we are seeing a triple 1-2. In other words a 1-2, i-ii, (1)-(2). My chart shows this but the wave labeling is not as Lara’s. But I think you will get the idea.
The subdivisions show up nicely on the hourly chart as well.
Yep! I started to suspect as much when VIX started to give the bankster pumps the proverbial finger with that series of bull flags…! 🙂
Perhaps, but I see this simply as a WXY down starting at the recent ATH, with this leg being the completion of the Y. I don’t think a 4 wave is going to be a highly nested impulse down (unless it’s not a 4 wave!).
Whether a detailed count can be made to support that WXY claim I don’t know!
Good point Kevin.
O.K Just changed the limit price for my 260 strike SPY puts to 4.00 pesos. Now watch am go to 10.00 lol!
I want to see how VIX closes today before I decide on the target for my ” stink bid” to try and catch the capitulation spike if it comes. Here’s hoping for an early Xmas present! 😉
If a lot of folk start doing this MMS are going to be in some serious pain so keep it quiet will ya? 😀
ES moved right down to the 2562 (2562.25) pivot and bounced. They are trying mightily to avoid breaking the neckline of the possible H&S pattern. I wish ’em luck….
I will be watching the upcoming VIX spike very carefully for clues as to what degree correction we are likely in. If the spike exceeds the August 11 high of 17.28 it could be a game changer…
VIX UP 1.26 TO 12.85 pre market… So Verne what are the key levels we should look for today and its meaning.
Moving past the August 11 high “might” suggest a higher degree correction. A move past 15 will almost certainly trigger initial VAR (value at risk) concerns and could result in some speedy liquidations. A close above 15 I think will see the smart ones bail.
Do you mean those short the VIX will bail at a close above 15?
In addition to those who were permitted to establish bigger leveraged long positions due to the ridiculously
low VIX. This is one consequence of protracted low volatility that few take into consideration when gauging how violent unwinds can become…
I had an open limit order to sell my SPY 260 puts but the gap down is going to blow past that limit and some market maker is eyeing those puts and licking his chops. He is going to be so disappointed when I change it to a market order just before the open…hyuk! 🙂
The move up in VIX means a fatter premium as well…
Yup, I missed getti ng VIX yesterday as was hoping jump to 2593 happens before this drop but will stand put for now..
I got REAL suspicious yesterday when I opened an order to buy and the ask immediately scooted higher. Either a big buyer jumped in ahead of me or somebody decided to do some serious hedging. I was able to get an after hours fill as price came down almost exactly to 11.50 🙂
The banksters are panicking but the herd is not; at least not yet! 🙂
I expect the pattern to continue with the precipitous initial plunges and the torturous rising wedges as they step in to discourage sellers from jumping on the bandwagon. I would continue to take profits at the open and reload as the rising wedge approaches the gap area. VIX will probably spike this week so this is one of the few times you can execute a high probability trade to take advantage. I will add some calls at the open and use a generous 1.50 point trailing stop as we now have temporary support around the 11.50 area. A strong move above the upper B band accompanied by a long upper wick means it’s time to short VIX. Especially if SPX reaches Lara’s target and we see evidences of a reversal in the indicators.
Looks like a repeat of Monday and Tuesday at the market open but let’s see how the market does after that…perhaps a more deeper correction is finally here. Still a lot of time between now and market open
Lara,
I thought a triple bottom, like a hammer candlestick, would only be valid if it has some downwards movement to reverse. The bottom of those three candles certainly show significant support. But I do not understand how they can be a reversal pattern. Please help me understand.
Thanks in advance.
An excellent question Rodney.
This is what I refreshed myself on from Dhalquist and Kirkpatrick today:
“The triple top and bottom formation is just a rectangle with the number of touches to the support or resistance line being three.”… “the patterns are rare and usually depend on the underlying market trend”.
I am assuming that like rectangles they can be either reversal or continuation patterns.
“Edwards and Magee claimed that rectangles are more often continuation patterns but as a reversal pattern they occur more frequently at bottoms”.
I’m expecting that here it may be a continuation pattern. But yeah, I do see that if they’re like double tops and bottoms they should then be reversal patterns.
I see the reason for your confusion. And maybe I’m wrong? At this stage, that is my interpretation…
Ah, rectangle. Yes, that is a horse of a different color. Thanks so much for the explanation. I appreciate it.
Looks like the first hourly is calling for what should amount to a double top, with a lot of fresh bullish sentiment generated as price zips back up close to the recent ATH. The…kaboom. This should be fun! The first step up should send XIV back up to 115…
Generally not a good idea to attempt shorting VIX when B bands are expanding…
Hello..Hello.. where is everyone 🙂